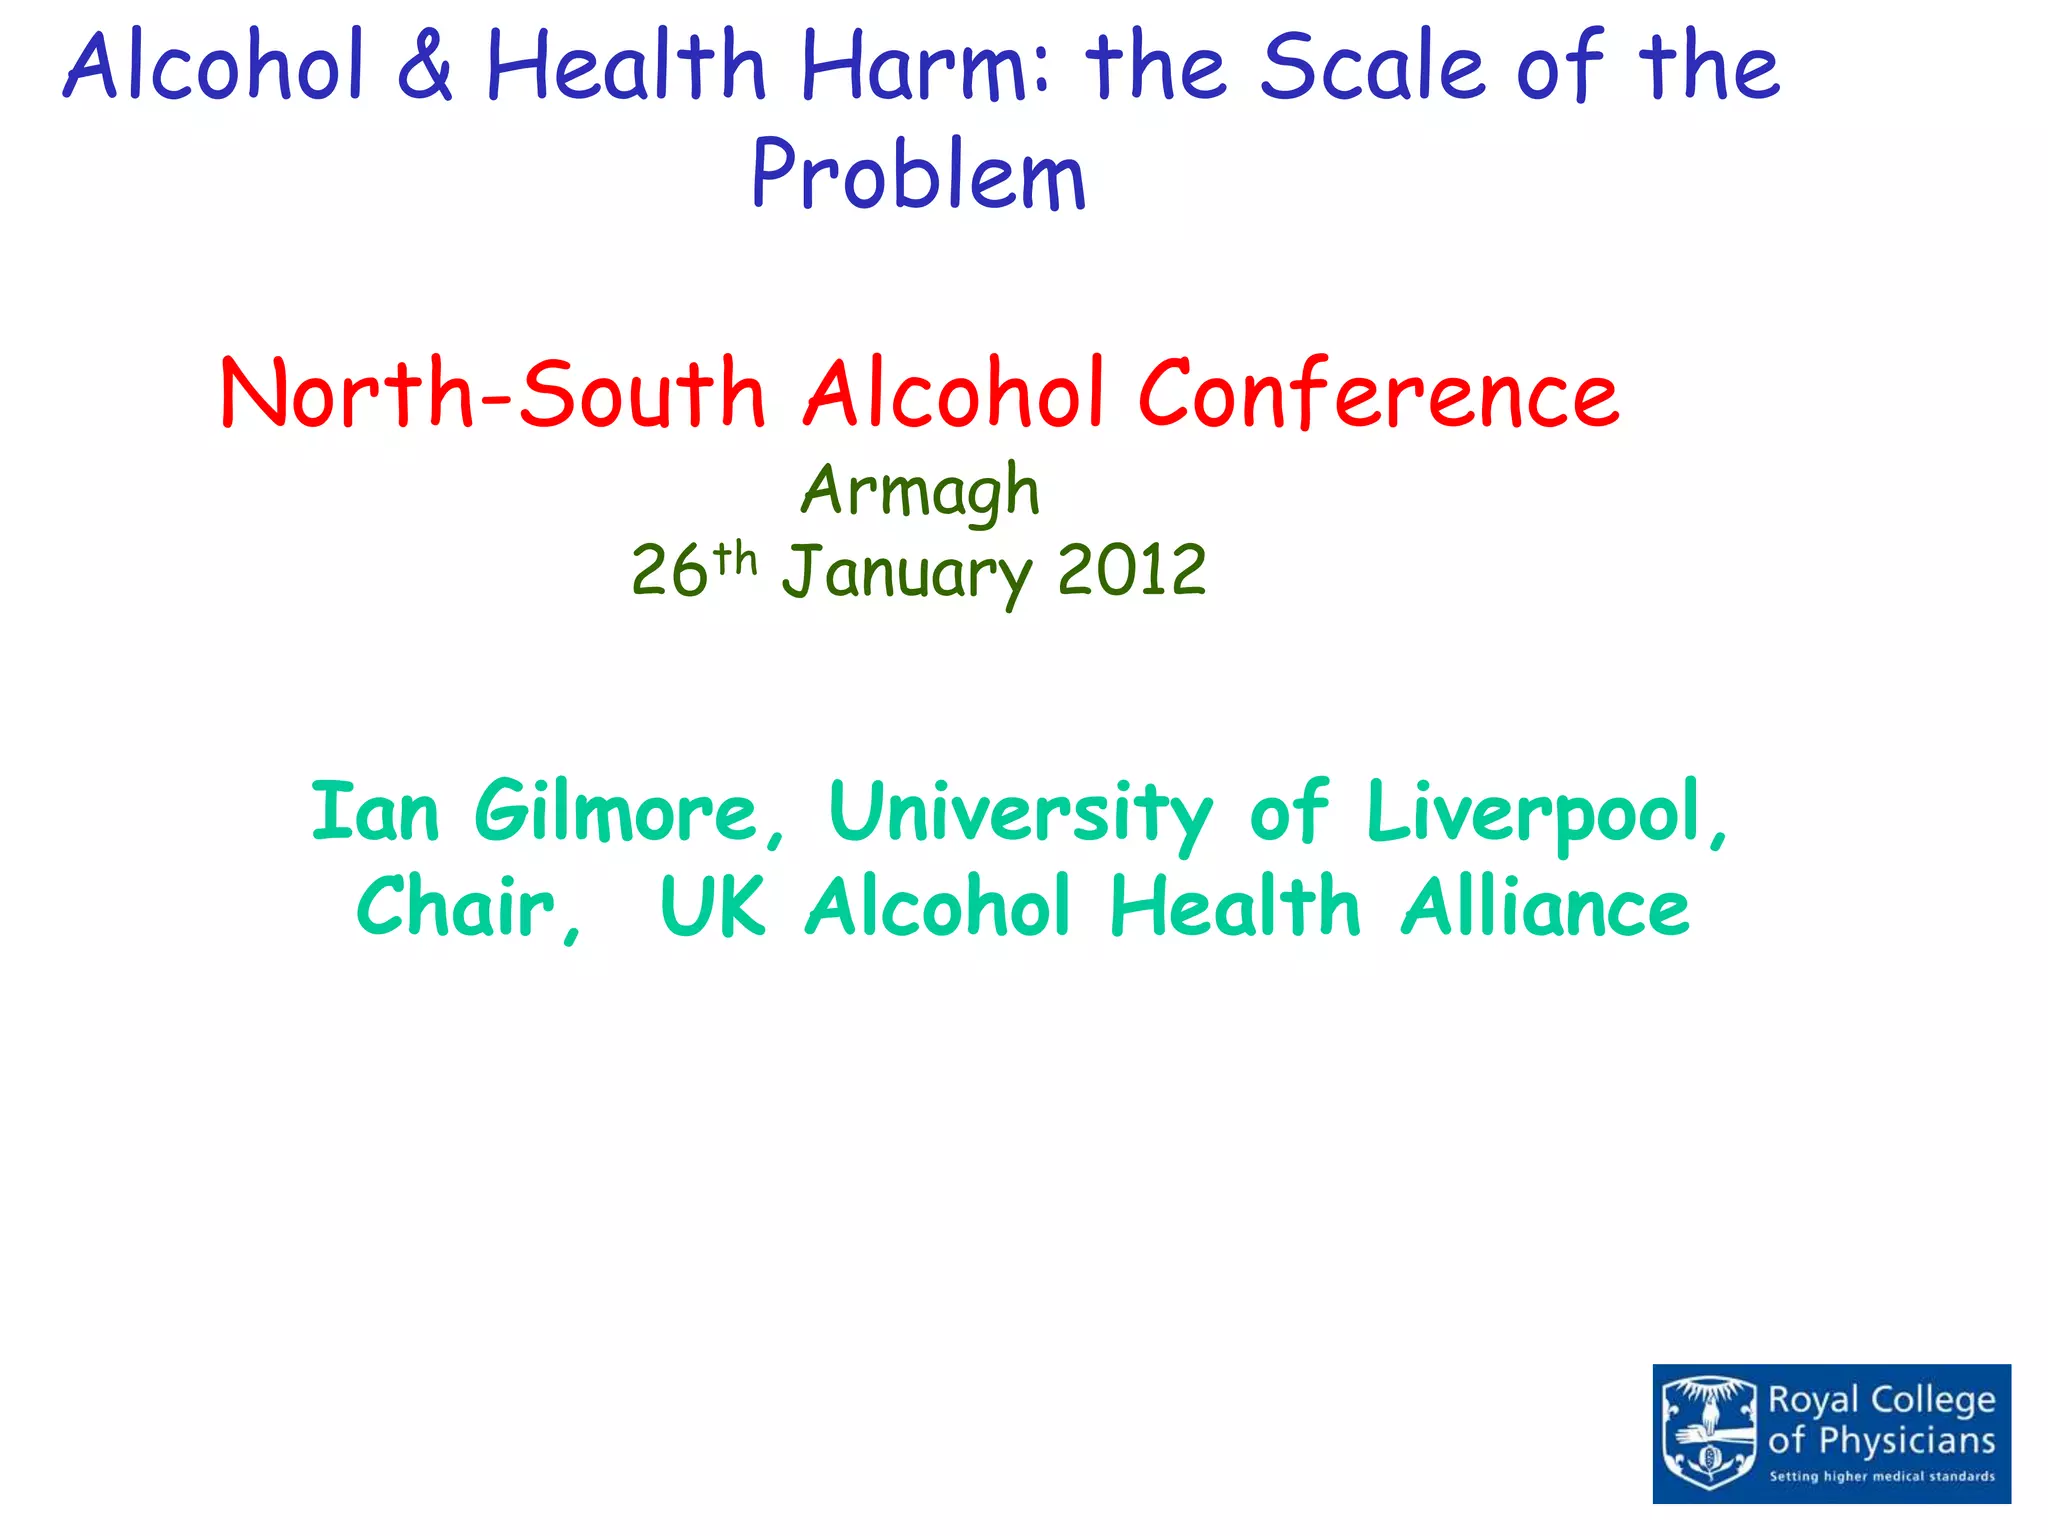
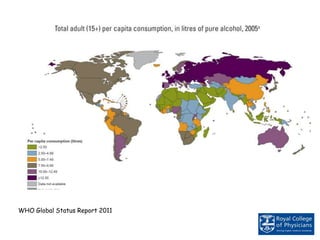
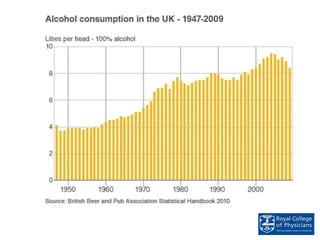
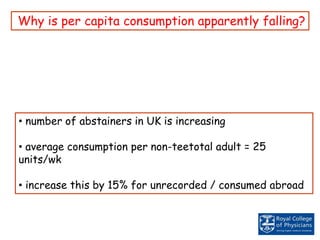
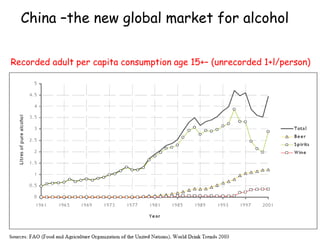
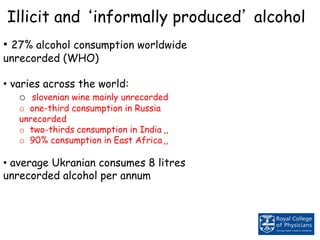
- Alcohol consumption causes significant health and social harms globally. While per capita consumption is falling in some countries like the UK, unrecorded alcohol consumption is estimated to account for around 27% of worldwide consumption.
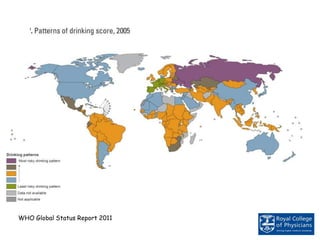
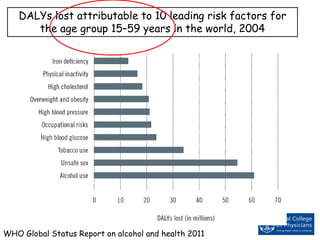
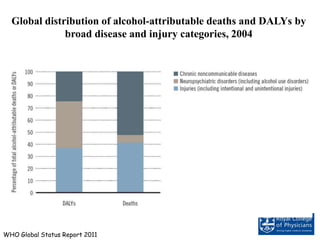
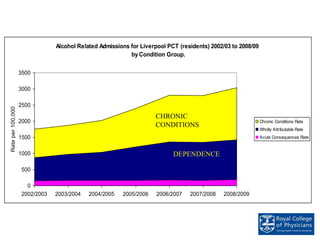
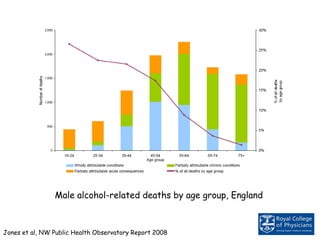
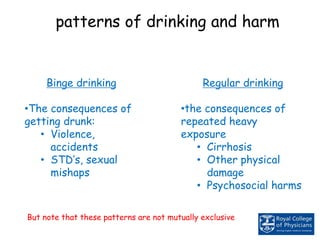
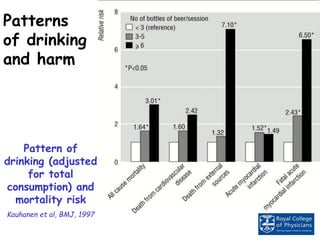
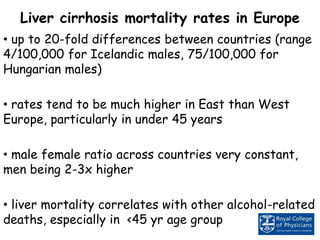
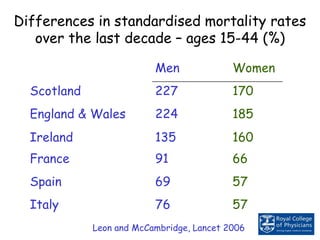
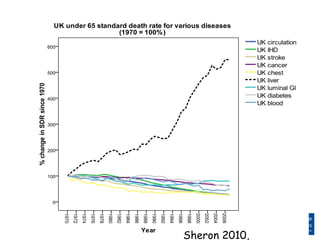
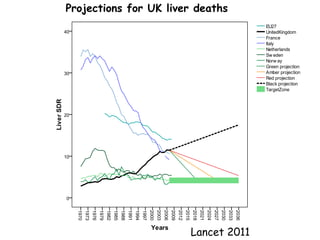
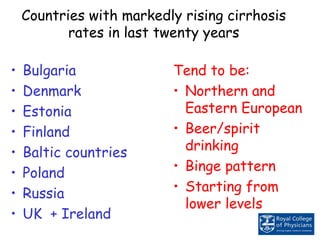
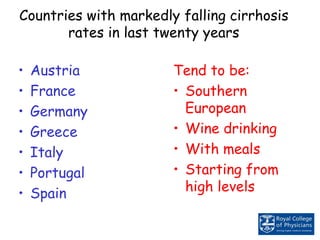
- Heavy episodic drinking and binge drinking patterns are linked to acute harms like injuries and violence. Regular heavy drinking is associated with chronic diseases like liver cirrhosis. Rates of alcohol-attributable deaths and diseases vary widely between countries.
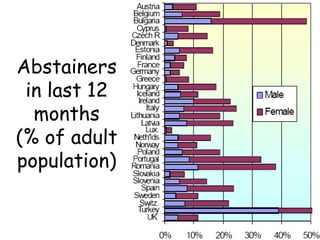
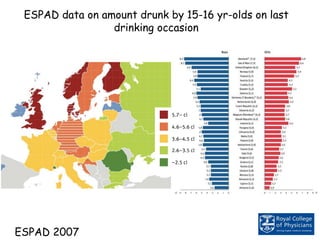
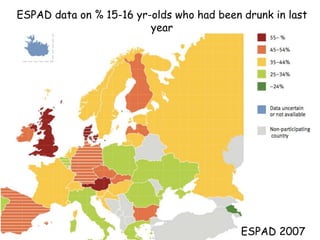
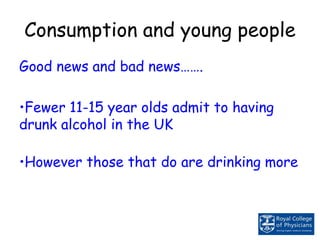
- Younger drinkers tend to consume alcohol in riskier patterns. While fewer young people drink in some places, those who do tend to drink more per occasion. Alcohol marketing also increasingly targets women.