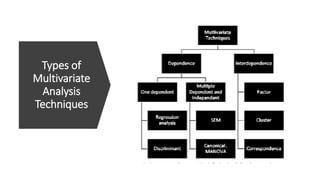
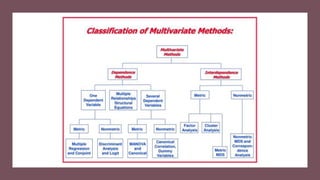
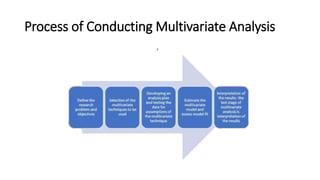
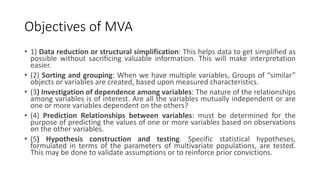
Introduction-Classification of
multivariate techniques
Multivariate Analysis
• Many statistical techniques focus on just one or two variables
• Multivariate analysis (MVA) techniques allow more than two variables
to be analysed at once
• Multivariate analysis is a term which is used for algorithms that have
the ability to analyze multiple variables.
EXAMPLE
• Consider a researcher who is trying to understand the factors which
influence the use of self-service banking.
• After conducting an exhaustive review of literature, the researchers
narrowed down technology acceptance model in order to study the
factors which influence self-service banking. Therefore, using this
model he defines that he wants to study effect of technology
discomfort, perceived risk, perceived ease of use and perceived
usefulness on the adoption of self-service banking by a consumer.
• The number of independent and dependent variables being studied
by the researcher is more than two.
Classification of Multivariate
Techniques
• Selection of the appropriate multivariate technique depends upon-
• a) Are the variables divided into independent and dependent classification?
• b) If Yes, how many variables are treated as dependents in a single analysis?
• c) How are the variables, both dependent and independent measured?
• Multivariate analysis technique can be classified into two broad categories viz.,
This classification depends upon the question: are the involved variables
dependent on each other or not?
• If the answer is yes: We have Dependence methods.
If the answer is no: We have Interdependence methods.
•
INTERDEPENDENCE AND DEPENDENCE
• Interdependence, refers to a fundamental where we can say that the variables
influence the amount of variance in each other to a varying extent.
• For example in certain cases perceived ease of use influences perceived
usefulness and vice versa. Therefore there is a mutual interaction between these
two variables and this is called as interdependence.
• Dependence, refers to a fundamental way we can say that the variables can be
categorised into dependent and independent variables and the study tries to find
the relationship or the influence of independent variables on dependent variable.
• For example a simple regression analysis to find the effect of perceived
usefulness, perceived ease of use, perceived risk and technology discomfort on
the adoption of self-service banking is an dependence analysis.
• The techniques which try and find out interdependence are called as
interdependence techniques. These kind of techniques are used in order to
provide some sort of structure to the dataset.
• For example, the factor analysis and cluster analysis are the most common
interdependence techniques which are applied on metric data.
• The techniques which try and find out the effect of independent variables
on dependent variable are referred to as dependence techniques.
• Dependence techniques further can be classified on basis of the number of
dependent variables. If there is only one dependent variable and metric
data then multiple regression analysis and algorithms based on regression
analysis can be used.
• If several dependent variables are to be analyzed and researcher can move
towards Canonical correlational analysis or multivariate analysis of variance
(MANOVA). If a researcher wants to study multiple relationships of
dependent and independent variables then techniques like structural
equation modelling can be used
Types of
Multivariate
Analysis
Techniques
Principal Component And Common Factor
Analysis
• Principal component analysis, or PCA, is a dimensionality
reduction method that is often used to reduce the dimensionality of
large data sets, by transforming a large set of variables into a smaller one
that still contains most of the information in the large set.
• The technique basically helps to extract a common underlying factor on
basis of interdependence or commonality of variance among the variables
with minimal loss of information. It is important to note that whenever any
sort of data condensation technique is applied there is a loss of sensitivity
of the data.
• It is up to the researcher to determine what is more important for this
study i.e. sensitivity of the data or an in-depth analysis (which might be
compromised due to large number of variables).
EXAMPLE
• For example, a researcher wants to study what are the various components
of a print advertisement. Therefore, he collects data regarding various
components present in a print advertisement i.e. brand-name, trademark,
copyright, model, model details, backdrop, product, adjectives used etc. he
in total has 58 such components for which he has collected data for more
than 1000 advertisements. Therefore. researcher lands up with 58,000 data
points. Analysis of data across 58 that components in detail is very difficult.
• Therefore, for the ease of data analysis the researcher can reduce the 58
components on basis of factor analysis. Factor analysis on basis of
Covarinace will cluster the components into Factors. For the present for
example two factors were generated for 58 components i.e. information
cues and attractiveness use. This made an in-depth analysis as well as
conversion of data into information by the researcher easier.
Multiple Regression Analysis
• Multiple regression is a statistical technique that can be used to
analyze the relationship between a single dependent variable and
several independent variables.
• The objective of multiple regression analysis is to use the
independent variables whose values are known to predict the value
of the single dependent value. Each predictor value is weighed, the
weights denoting their relative contribution to the overall prediction.
• Here Y is the dependent variable, and X1,…,Xn are
the n independent variables. In calculating the weights, a, b1,…,bn,
regression analysis ensures maximal prediction of the dependent
variable from the set of independent variables. This is usually done
by least squares estimation.
Multiple Discriminant Analysis And Logistic
Regression
• In order to study the effect of multiple independent variables (which are
metric in nature) on one dependent variable (which is categorical in
nature) then the appropriate technique would be multiple discriminant
analysis. In this scenario multiple regression would not work as it assumes
all data to be in metric scale. Therefore, when the total sample can be
divided into groups or classes and the primary objective is to understand
the group differences based on multiple independent variables than the
technique used is discriminant analysis.
• For example, if researcher wants to study the difference in the perception
of perceived ease of use, perceived usefulness, technology discomfort and
perceived risk across users and non-users of self-service banking, then
discriminant analysis would be an appropriate technique to be used.
Logistic Regression
• Logistic regression-based algorithms and models are used to predict
relationships amongst multiple independent variables and dependent
variable which might be nonmetric. It is a nonparametric option to
multiple regression.
Canonical Correlation Analysis
• A researcher might be faced with a situation where he desires to find
effect of multiple independent variables on multiple dependent
variables, where both are measured on a metric scale.
• In such circumstances a multivariate analysis technique referred to as
Canonical Correlation analysis can be used by the researcher. The
principle behind this particular algorithm is to develop linear
combination between the dependent and independent variables so
as to maximise the correlation
MANOVA
• Multivariate analysis of variance, MANOVA, is a commonly used
multivariate technique. MANOVA assesses the relationship between two or
more dependent variables and classificatory variables or factors. It is
similar to ANOVA but with the added ability to handle several dependent
variables simultaneously. It uses special matrices to test for differences
among groups.
• The uniqueness of the algorithm is that it is used to state the relationship
between those independent variables which might be categorical in nature
and multiple dependent variables which are on metric.
• The F ratio, generalized to a ratio of the within-group variance and total-
group variance matrices, tests for equality among treatment groups.
Conjoint Analysis:
• It is one of the emerging dependence multivariate analysis techniques. This is a
technique which is most commonly used in the discipline of marketing as it has its
applications in evaluation of objects like new products, new services or new
marketing mix is developed by the organization. It is form of statistical analysis
that firms use in market research to understand how customers value
different components or features of their products or services.
• It is typically conducted via a specialized survey that asks consumers to
rank the importance of the specific features in question. This technique
allows the researcher to find the relative importance of various attributes being
studied. It is a technique which makes subsets of the various levels of
independent variable being studied by the researcher and gives an evaluation in
terms of which one of those combinations is best accepted by the customers. This
is a technique which has highest applications and development of proposed
marketing mix.
Cluster Analysis
• Cluster analysis or clustering is the task of grouping a set of objects in such
a way that objects in the same group (called a cluster) are more similar (in
some sense) to each other than to those in other groups (clusters). While
doing cluster analysis, we first partition the set of data into groups based
on data similarity and then assign the labels to the groups.
• This is one of the techniques which can be used for market segmentation.
This technique is used to develop homogenous groups within the data.
Therefore, the technique can be used for data reduction. This particular
technique involves at least three steps. In the first step the researcher is
desired to measure some form of similarity in the sample. In the second
step the researcher is desired to partition the sample into groups and in
the last step the researcher studies the variables to determine the
composition of the groups.
Multidimensional Scaling
• Multidimensional scaling is a visual representation of distances or
dissimilarities between sets of objects
• For example, given a matrix of perceived similarities between various
brands of air fresheners, MDS plots the brands on a map such that
those brands that are perceived to be very similar to each other are
placed near each other on the map, and those brands that are
perceived to be very different from each other are placed far away
from each other on the map.
Structural Equation Modelling And
Confirmatory Factor Analysis
• Confirmatory factor analysis, is a variation of factor analysis. In circumstances where the
structure of the covariance, among the variables being studied, is not known to the
researcher the researcher prefers to use common factor analysis it is also referred to as
exploratory factor analysis. In this technique the researcher tries to explore the plausible
structures, in the variables, which can be developed and then accepts the best one.
However, there are certain circumstances where the researcher, based on review of
literature, already knows the structure of covariance, among the variables being studied.
• In this particular case applying an exploratory factor analysis might result in results which
are counter-productive to a predetermined structure. In these situations, the researcher
is advised to use confirmatory factor analysis, where this starting point is the structure of
covariance, as defined by the researcher. Confirmatory factor analysis, is a model-based
assessment of the proposed options. Structural equation modelling as a technique uses
confirmatory factor analysis as an data preparation and data editing step. Only when a
model has converged and passed the confirmatory factor analysis, is it ready to apply the
technique of structural equation modelling.
CFA
• Confirmatory factor analysis (CFA) is a multivariate statistical procedure
that is used to test how well the measured variables represent the number
of constructs. Confirmatory factor analysis (CFA) and exploratory factor
analysis (EFA) are similar techniques, but in exploratory factor analysis
(EFA), data is simply explored and provides information about the numbers
of factors required to represent the data.
• In exploratory factor analysis, all measured variables are related to every
latent variable. But in confirmatory factor analysis (CFA), researchers can
specify the number of factors required in the data and which measured
variable is related to which latent variable. Confirmatory factor analysis
(CFA) is a tool that is used to confirm or reject the measurement theory.
SEM
• Structural equation modelling as a technique allows development of
paths/relationships for each set of dependent variables. It is one of
the best techniques which allows a simultaneous assessment of
multiple regression equations at the same time.
• It is important for the readers to know that a model in which the
paths re defined in terms of covariance is referred to as confirmatory
factor analysis. While the model in which the paths are defined in
terms of regression is referred to as measurement model and the
technique is structural equation modelling
19-22
Structural Equation Modeling (SEM)
Model Specification
Estimation
Evaluation of Fit
Respecification of the Model
Interpretation and Communication
19-23
Structural Equation Modeling (SEM)
Process of Conducting Multivariate Analysis
Objectives of MVA
• 1) Data reduction or structural simplification: This helps data to get simplified as
possible without sacrificing valuable information. This will make interpretation
easier.
• (2) Sorting and grouping: When we have multiple variables, Groups of “similar”
objects or variables are created, based upon measured characteristics.
• (3) Investigation of dependence among variables: The nature of the relationships
among variables is of interest. Are all the variables mutually independent or are
one or more variables dependent on the others?
• (4) Prediction Relationships between variables: must be determined for the
purpose of predicting the values of one or more variables based on observations
on the other variables.
• (5) Hypothesis construction and testing. Specific statistical hypotheses,
formulated in terms of the parameters of multivariate populations, are tested.
This may be done to validate assumptions or to reinforce prior convictions.

classification of various Multivariate techniques

  • 1.
  • 2.
    Multivariate Analysis • Manystatistical techniques focus on just one or two variables • Multivariate analysis (MVA) techniques allow more than two variables to be analysed at once • Multivariate analysis is a term which is used for algorithms that have the ability to analyze multiple variables.
  • 3.
    EXAMPLE • Consider aresearcher who is trying to understand the factors which influence the use of self-service banking. • After conducting an exhaustive review of literature, the researchers narrowed down technology acceptance model in order to study the factors which influence self-service banking. Therefore, using this model he defines that he wants to study effect of technology discomfort, perceived risk, perceived ease of use and perceived usefulness on the adoption of self-service banking by a consumer. • The number of independent and dependent variables being studied by the researcher is more than two.
  • 4.
    Classification of Multivariate Techniques •Selection of the appropriate multivariate technique depends upon- • a) Are the variables divided into independent and dependent classification? • b) If Yes, how many variables are treated as dependents in a single analysis? • c) How are the variables, both dependent and independent measured? • Multivariate analysis technique can be classified into two broad categories viz., This classification depends upon the question: are the involved variables dependent on each other or not? • If the answer is yes: We have Dependence methods. If the answer is no: We have Interdependence methods. •
  • 5.
    INTERDEPENDENCE AND DEPENDENCE •Interdependence, refers to a fundamental where we can say that the variables influence the amount of variance in each other to a varying extent. • For example in certain cases perceived ease of use influences perceived usefulness and vice versa. Therefore there is a mutual interaction between these two variables and this is called as interdependence. • Dependence, refers to a fundamental way we can say that the variables can be categorised into dependent and independent variables and the study tries to find the relationship or the influence of independent variables on dependent variable. • For example a simple regression analysis to find the effect of perceived usefulness, perceived ease of use, perceived risk and technology discomfort on the adoption of self-service banking is an dependence analysis.
  • 6.
    • The techniqueswhich try and find out interdependence are called as interdependence techniques. These kind of techniques are used in order to provide some sort of structure to the dataset. • For example, the factor analysis and cluster analysis are the most common interdependence techniques which are applied on metric data. • The techniques which try and find out the effect of independent variables on dependent variable are referred to as dependence techniques. • Dependence techniques further can be classified on basis of the number of dependent variables. If there is only one dependent variable and metric data then multiple regression analysis and algorithms based on regression analysis can be used. • If several dependent variables are to be analyzed and researcher can move towards Canonical correlational analysis or multivariate analysis of variance (MANOVA). If a researcher wants to study multiple relationships of dependent and independent variables then techniques like structural equation modelling can be used
  • 7.
  • 9.
    Principal Component AndCommon Factor Analysis • Principal component analysis, or PCA, is a dimensionality reduction method that is often used to reduce the dimensionality of large data sets, by transforming a large set of variables into a smaller one that still contains most of the information in the large set. • The technique basically helps to extract a common underlying factor on basis of interdependence or commonality of variance among the variables with minimal loss of information. It is important to note that whenever any sort of data condensation technique is applied there is a loss of sensitivity of the data. • It is up to the researcher to determine what is more important for this study i.e. sensitivity of the data or an in-depth analysis (which might be compromised due to large number of variables).
  • 10.
    EXAMPLE • For example,a researcher wants to study what are the various components of a print advertisement. Therefore, he collects data regarding various components present in a print advertisement i.e. brand-name, trademark, copyright, model, model details, backdrop, product, adjectives used etc. he in total has 58 such components for which he has collected data for more than 1000 advertisements. Therefore. researcher lands up with 58,000 data points. Analysis of data across 58 that components in detail is very difficult. • Therefore, for the ease of data analysis the researcher can reduce the 58 components on basis of factor analysis. Factor analysis on basis of Covarinace will cluster the components into Factors. For the present for example two factors were generated for 58 components i.e. information cues and attractiveness use. This made an in-depth analysis as well as conversion of data into information by the researcher easier.
  • 11.
    Multiple Regression Analysis •Multiple regression is a statistical technique that can be used to analyze the relationship between a single dependent variable and several independent variables. • The objective of multiple regression analysis is to use the independent variables whose values are known to predict the value of the single dependent value. Each predictor value is weighed, the weights denoting their relative contribution to the overall prediction. • Here Y is the dependent variable, and X1,…,Xn are the n independent variables. In calculating the weights, a, b1,…,bn, regression analysis ensures maximal prediction of the dependent variable from the set of independent variables. This is usually done by least squares estimation.
  • 12.
    Multiple Discriminant AnalysisAnd Logistic Regression • In order to study the effect of multiple independent variables (which are metric in nature) on one dependent variable (which is categorical in nature) then the appropriate technique would be multiple discriminant analysis. In this scenario multiple regression would not work as it assumes all data to be in metric scale. Therefore, when the total sample can be divided into groups or classes and the primary objective is to understand the group differences based on multiple independent variables than the technique used is discriminant analysis. • For example, if researcher wants to study the difference in the perception of perceived ease of use, perceived usefulness, technology discomfort and perceived risk across users and non-users of self-service banking, then discriminant analysis would be an appropriate technique to be used.
  • 13.
    Logistic Regression • Logisticregression-based algorithms and models are used to predict relationships amongst multiple independent variables and dependent variable which might be nonmetric. It is a nonparametric option to multiple regression.
  • 14.
    Canonical Correlation Analysis •A researcher might be faced with a situation where he desires to find effect of multiple independent variables on multiple dependent variables, where both are measured on a metric scale. • In such circumstances a multivariate analysis technique referred to as Canonical Correlation analysis can be used by the researcher. The principle behind this particular algorithm is to develop linear combination between the dependent and independent variables so as to maximise the correlation
  • 15.
    MANOVA • Multivariate analysisof variance, MANOVA, is a commonly used multivariate technique. MANOVA assesses the relationship between two or more dependent variables and classificatory variables or factors. It is similar to ANOVA but with the added ability to handle several dependent variables simultaneously. It uses special matrices to test for differences among groups. • The uniqueness of the algorithm is that it is used to state the relationship between those independent variables which might be categorical in nature and multiple dependent variables which are on metric. • The F ratio, generalized to a ratio of the within-group variance and total- group variance matrices, tests for equality among treatment groups.
  • 16.
    Conjoint Analysis: • Itis one of the emerging dependence multivariate analysis techniques. This is a technique which is most commonly used in the discipline of marketing as it has its applications in evaluation of objects like new products, new services or new marketing mix is developed by the organization. It is form of statistical analysis that firms use in market research to understand how customers value different components or features of their products or services. • It is typically conducted via a specialized survey that asks consumers to rank the importance of the specific features in question. This technique allows the researcher to find the relative importance of various attributes being studied. It is a technique which makes subsets of the various levels of independent variable being studied by the researcher and gives an evaluation in terms of which one of those combinations is best accepted by the customers. This is a technique which has highest applications and development of proposed marketing mix.
  • 17.
    Cluster Analysis • Clusteranalysis or clustering is the task of grouping a set of objects in such a way that objects in the same group (called a cluster) are more similar (in some sense) to each other than to those in other groups (clusters). While doing cluster analysis, we first partition the set of data into groups based on data similarity and then assign the labels to the groups. • This is one of the techniques which can be used for market segmentation. This technique is used to develop homogenous groups within the data. Therefore, the technique can be used for data reduction. This particular technique involves at least three steps. In the first step the researcher is desired to measure some form of similarity in the sample. In the second step the researcher is desired to partition the sample into groups and in the last step the researcher studies the variables to determine the composition of the groups.
  • 18.
    Multidimensional Scaling • Multidimensionalscaling is a visual representation of distances or dissimilarities between sets of objects • For example, given a matrix of perceived similarities between various brands of air fresheners, MDS plots the brands on a map such that those brands that are perceived to be very similar to each other are placed near each other on the map, and those brands that are perceived to be very different from each other are placed far away from each other on the map.
  • 19.
    Structural Equation ModellingAnd Confirmatory Factor Analysis • Confirmatory factor analysis, is a variation of factor analysis. In circumstances where the structure of the covariance, among the variables being studied, is not known to the researcher the researcher prefers to use common factor analysis it is also referred to as exploratory factor analysis. In this technique the researcher tries to explore the plausible structures, in the variables, which can be developed and then accepts the best one. However, there are certain circumstances where the researcher, based on review of literature, already knows the structure of covariance, among the variables being studied. • In this particular case applying an exploratory factor analysis might result in results which are counter-productive to a predetermined structure. In these situations, the researcher is advised to use confirmatory factor analysis, where this starting point is the structure of covariance, as defined by the researcher. Confirmatory factor analysis, is a model-based assessment of the proposed options. Structural equation modelling as a technique uses confirmatory factor analysis as an data preparation and data editing step. Only when a model has converged and passed the confirmatory factor analysis, is it ready to apply the technique of structural equation modelling.
  • 20.
    CFA • Confirmatory factoranalysis (CFA) is a multivariate statistical procedure that is used to test how well the measured variables represent the number of constructs. Confirmatory factor analysis (CFA) and exploratory factor analysis (EFA) are similar techniques, but in exploratory factor analysis (EFA), data is simply explored and provides information about the numbers of factors required to represent the data. • In exploratory factor analysis, all measured variables are related to every latent variable. But in confirmatory factor analysis (CFA), researchers can specify the number of factors required in the data and which measured variable is related to which latent variable. Confirmatory factor analysis (CFA) is a tool that is used to confirm or reject the measurement theory.
  • 21.
    SEM • Structural equationmodelling as a technique allows development of paths/relationships for each set of dependent variables. It is one of the best techniques which allows a simultaneous assessment of multiple regression equations at the same time. • It is important for the readers to know that a model in which the paths re defined in terms of covariance is referred to as confirmatory factor analysis. While the model in which the paths are defined in terms of regression is referred to as measurement model and the technique is structural equation modelling
  • 22.
    19-22 Structural Equation Modeling(SEM) Model Specification Estimation Evaluation of Fit Respecification of the Model Interpretation and Communication
  • 23.
  • 24.
    Process of ConductingMultivariate Analysis
  • 25.
    Objectives of MVA •1) Data reduction or structural simplification: This helps data to get simplified as possible without sacrificing valuable information. This will make interpretation easier. • (2) Sorting and grouping: When we have multiple variables, Groups of “similar” objects or variables are created, based upon measured characteristics. • (3) Investigation of dependence among variables: The nature of the relationships among variables is of interest. Are all the variables mutually independent or are one or more variables dependent on the others? • (4) Prediction Relationships between variables: must be determined for the purpose of predicting the values of one or more variables based on observations on the other variables. • (5) Hypothesis construction and testing. Specific statistical hypotheses, formulated in terms of the parameters of multivariate populations, are tested. This may be done to validate assumptions or to reinforce prior convictions.