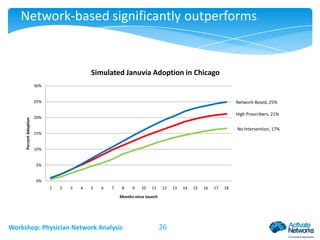
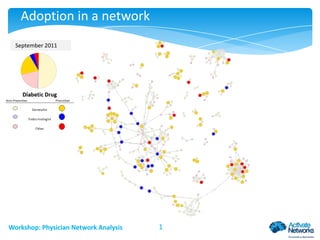
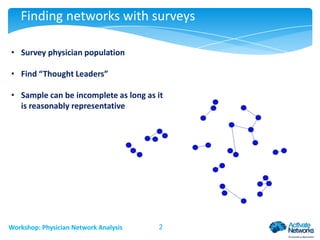
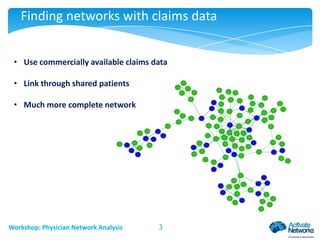
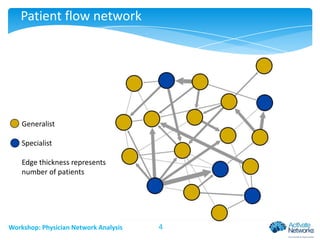
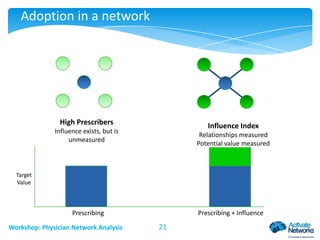
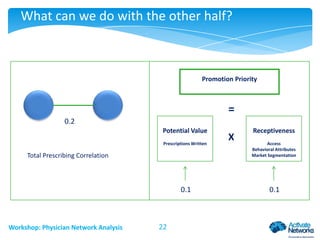
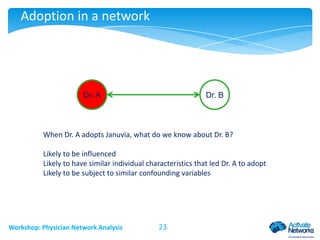
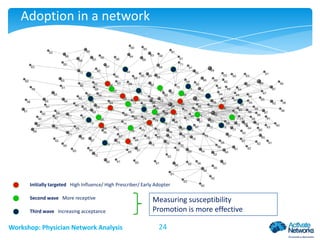
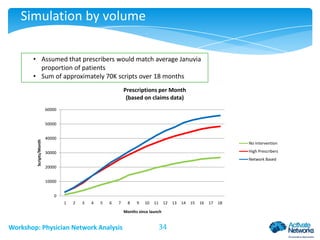
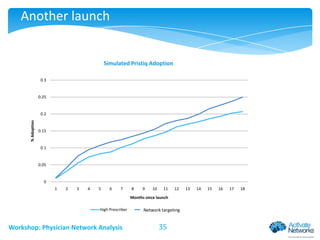
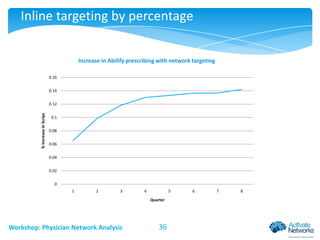
This document discusses analyzing physician networks and the adoption of new drugs. It provides examples of using claims data and surveys to map physician networks. Key topics covered include identifying influential physicians, examining how information and behaviors spread through networks, finding communities of practice, and using network analysis to predict how new drugs will diffuse. Network-based targeting of marketing is found to significantly outperform targeting based solely on prescribing volume. Network effects are shown to increase the probability that a physician will adopt a new drug.
The scientific study of methods to promote the systematic uptake of research findings and other evidence-based practices into routine practice and hence improve the quality and effectiveness of health services
OVC_HIVSTAT and Linkages to Care for Strengthened Collection, Analysis, and U...MEASURE Evaluation
This webinar focused on explaining the HIV Risk Assessment cascade and how it is related to OVC_HIVSTAT disaggregates. The presenters also provided guidance for how OVC_HIVSTAT data can be analyzed to enhance program outcomes.
Effectiveness of the current dominant approach to integrated care in the NHS:...Sarah Wilson
Jonathan Stokes of the Greater Manchester Primary Care Patient Safety Translational Research Centre presents a systematic review of case management in integrated care.
Clark NM, Friedman Milanovich AF, Lachance L, Awad DF, Stoll SC. Using outcomes of interest to plan asthma programs. American Public Health Association Annual Conference, Washington DC, November, 2007.
Noreen M. Clark, Director
Center for Managing Chronic Disease
University of Michigan
Academy Health- Annual Research Meeting - State Policy Interest Groups- 2013scherala
Title: Massachusetts Patient-Centered Medical Home Initiative (MA PCMHI): Impact on Clinical Quality at Midpoint
Authors: Judith Steinberg, Sai Cherala, Christine Johnson, Ann Lawthers.
Research Objective:
To assess the impact on clinical quality of practices’ participation in a Patient-Centered Medical Home (PCMH) demonstration. The MA PCMHI is a statewide, three-year, multi-payer demonstration of PCMH implementation in 45 primary care practices. Practices receive technical assistance including learning collaborative, coaching provided by external facilitators, and feedback of aggregated data, to support their implementation of PCMH processes. This study aims to assess the overall impact of this approach to transformation on a practice’s delivery of selected clinical services, including preventive care, care coordination and care management, and its processes and outcomes of care related to the initiative’s targeted conditions of diabetes and asthma at the midpoint of the initiative.
Research exploring clinician learning is of little value if it is not shared and leveraged broadly by those within the CME community to drive innovation and improve educational planning. This session is moderated by Jeremy C. Lundberg, MSSW, CEO of EthosCE Learning Management System and will introduce three new and emerging data sets that have been collected by Brian S. McGowan, PhD, Chief Learning Officer of ArcheMedEx.com. Dr. McGowan will structure each data set to highlight the problem, the methods of exploration, and the data or conclusion that could be drawn. These new ideas will then be put into the context of the educational planning process with the goal of allowing those within the CME community to effectively leverage these data and lessons to immediately impact their planning processes.
Evaluation of the Integrated Care and Support Pioneers ProgrammeNuffield Trust
Nick Mays of the Policy Innovation Research Unit presents some conclusions from the early evaluation of the Integrated Care and Support Pioneers Programme.
Slide Presentation from the July 9, 2013 webinar to present results of a survey of patients and clinicians assessing views on comparative effective research (CER) and engagement in research.
Presentation given at the Foundation's Jan. 26, 2011 Research and Policy Forum by David Swieskowski, MD, MBA and Kelly Taylor, RN, MSN, CCM from Mercy Clinics in Des Moines, IA.
Multispecialty Physician Networks: Improved Quality and Accountability - The ...EvidenceNetwork.ca
Multispecialty Physician Networks: Improved Quality and Accountability - The “Health Care Neighbourhood”
by Thérèse A. Stukel, Rick Glazier, Sue Schultz, Jun Guan Institute for Clinical Evaluative Sciences Toronto
Funded by: CIHR Emerging Team Grant in Applied Health Services and Policy Research
American Public Health Association- Annual Meeting 2014 Presentation scherala
Title: Using Quantitative Data to focus Medical Home Facilitation Interventions in the Massachusetts Patient Centered Medical Home Initiative (MA PCMHI)
The study explores major factors that contribute to hospital readmissions via various analysis algorithms, including decision tree, neutral network and Bayesian network.
SHARE Webinar: Why Should I Join a Clinical Trial with Dr. Hershmanbkling
Dr. Dawn L. Hershman of the Herbert Irving Comprehensive Cancer Center at Columbia University presented the basics of clinical trials and emphasized how important it is for more patients to participate in them. She also discussed trials currently available for early stage and metastatic breast cancers. The webinar was presented on June 25, 2014. To hear the webinar, visit www.sharecancersupport.org/hershman
Moving to Value Based Care – Leveraging advanced analytics to measure physici...LexisNexis Risk Solutions
Payment reform and emphasis on value-based care is forcing payers, ACOs, and Integrated Delivery Networks to look for ways through which physician performance can be evaluated and measured over time with the goal of creating highly efficient and effective physician networks. With more pressure and risk moving to physicians – they will expect fair measurement of quality against their peers. Join this webinar to understand the implications of value-based care as it relates to physician performance analysis and why the ability to effectively monitor physicians with less than acceptable cost performance and those with high-quality performance will be non-negotiable.
Slides from November 24, 2015 Webinar: Policies for Next Gen Sequencing in Oncology
Similar to CISummit 2013: Pete DeWarn, Brigham Hyde, Mark Degatano, Breakthrough KOLs Panel: Quantifying Network Structure and Contextual Expertise (20)
New Directions in Targeted Therapeutic Approaches for Older Adults With Mantl...i3 Health
i3 Health is pleased to make the speaker slides from this activity available for use as a non-accredited self-study or teaching resource.
This slide deck presented by Dr. Kami Maddocks, Professor-Clinical in the Division of Hematology and
Associate Division Director for Ambulatory Operations
The Ohio State University Comprehensive Cancer Center, will provide insight into new directions in targeted therapeutic approaches for older adults with mantle cell lymphoma.
STATEMENT OF NEED
Mantle cell lymphoma (MCL) is a rare, aggressive B-cell non-Hodgkin lymphoma (NHL) accounting for 5% to 7% of all lymphomas. Its prognosis ranges from indolent disease that does not require treatment for years to very aggressive disease, which is associated with poor survival (Silkenstedt et al, 2021). Typically, MCL is diagnosed at advanced stage and in older patients who cannot tolerate intensive therapy (NCCN, 2022). Although recent advances have slightly increased remission rates, recurrence and relapse remain very common, leading to a median overall survival between 3 and 6 years (LLS, 2021). Though there are several effective options, progress is still needed towards establishing an accepted frontline approach for MCL (Castellino et al, 2022). Treatment selection and management of MCL are complicated by the heterogeneity of prognosis, advanced age and comorbidities of patients, and lack of an established standard approach for treatment, making it vital that clinicians be familiar with the latest research and advances in this area. In this activity chaired by Michael Wang, MD, Professor in the Department of Lymphoma & Myeloma at MD Anderson Cancer Center, expert faculty will discuss prognostic factors informing treatment, the promising results of recent trials in new therapeutic approaches, and the implications of treatment resistance in therapeutic selection for MCL.
Target Audience
Hematology/oncology fellows, attending faculty, and other health care professionals involved in the treatment of patients with mantle cell lymphoma (MCL).
Learning Objectives
1.) Identify clinical and biological prognostic factors that can guide treatment decision making for older adults with MCL
2.) Evaluate emerging data on targeted therapeutic approaches for treatment-naive and relapsed/refractory MCL and their applicability to older adults
3.) Assess mechanisms of resistance to targeted therapies for MCL and their implications for treatment selection
HOT NEW PRODUCT! BIG SALES FAST SHIPPING NOW FROM CHINA!! EU KU DB BK substit...GL Anaacs
Contact us if you are interested:
Email / Skype : kefaya1771@gmail.com
Threema: PXHY5PDH
New BATCH Ku !!! MUCH IN DEMAND FAST SALE EVERY BATCH HAPPY GOOD EFFECT BIG BATCH !
Contact me on Threema or skype to start big business!!
Hot-sale products:
NEW HOT EUTYLONE WHITE CRYSTAL!!
5cl-adba precursor (semi finished )
5cl-adba raw materials
ADBB precursor (semi finished )
ADBB raw materials
APVP powder
5fadb/4f-adb
Jwh018 / Jwh210
Eutylone crystal
Protonitazene (hydrochloride) CAS: 119276-01-6
Flubrotizolam CAS: 57801-95-3
Metonitazene CAS: 14680-51-4
Payment terms: Western Union,MoneyGram,Bitcoin or USDT.
Deliver Time: Usually 7-15days
Shipping method: FedEx, TNT, DHL,UPS etc.Our deliveries are 100% safe, fast, reliable and discreet.
Samples will be sent for your evaluation!If you are interested in, please contact me, let's talk details.
We specializes in exporting high quality Research chemical, medical intermediate, Pharmaceutical chemicals and so on. Products are exported to USA, Canada, France, Korea, Japan,Russia, Southeast Asia and other countries.
micro teaching on communication m.sc nursing.pdfAnurag Sharma
Microteaching is a unique model of practice teaching. It is a viable instrument for the. desired change in the teaching behavior or the behavior potential which, in specified types of real. classroom situations, tends to facilitate the achievement of specified types of objectives.
MANAGEMENT OF ATRIOVENTRICULAR CONDUCTION BLOCK.pdfJim Jacob Roy
Cardiac conduction defects can occur due to various causes.
Atrioventricular conduction blocks ( AV blocks ) are classified into 3 types.
This document describes the acute management of AV block.
263778731218 Abortion Clinic /Pills In Harare ,sisternakatoto
263778731218 Abortion Clinic /Pills In Harare ,ABORTION WOMEN’S CLINIC +27730423979 IN women clinic we believe that every woman should be able to make choices in her pregnancy. Our job is to provide compassionate care, safety,affordable and confidential services. That’s why we have won the trust from all generations of women all over the world. we use non surgical method(Abortion pills) to terminate…Dr.LISA +27730423979women Clinic is committed to providing the highest quality of obstetrical and gynecological care to women of all ages. Our dedicated staff aim to treat each patient and her health concerns with compassion and respect.Our dedicated group ABORTION WOMEN’S CLINIC +27730423979 IN women clinic we believe that every woman should be able to make choices in her pregnancy. Our job is to provide compassionate care, safety,affordable and confidential services. That’s why we have won the trust from all generations of women all over the world. we use non surgical method(Abortion pills) to terminate…Dr.LISA +27730423979women Clinic is committed to providing the highest quality of obstetrical and gynecological care to women of all ages. Our dedicated staff aim to treat each patient and her health concerns with compassion and respect.Our dedicated group of receptionists, nurses, and physicians have worked together as a teamof receptionists, nurses, and physicians have worked together as a team wwww.lisywomensclinic.co.za/
New Drug Discovery and Development .....NEHA GUPTA
The "New Drug Discovery and Development" process involves the identification, design, testing, and manufacturing of novel pharmaceutical compounds with the aim of introducing new and improved treatments for various medical conditions. This comprehensive endeavor encompasses various stages, including target identification, preclinical studies, clinical trials, regulatory approval, and post-market surveillance. It involves multidisciplinary collaboration among scientists, researchers, clinicians, regulatory experts, and pharmaceutical companies to bring innovative therapies to market and address unmet medical needs.
Ozempic: Preoperative Management of Patients on GLP-1 Receptor Agonists Saeid Safari
Preoperative Management of Patients on GLP-1 Receptor Agonists like Ozempic and Semiglutide
ASA GUIDELINE
NYSORA Guideline
2 Case Reports of Gastric Ultrasound
These simplified slides by Dr. Sidra Arshad present an overview of the non-respiratory functions of the respiratory tract.
Learning objectives:
1. Enlist the non-respiratory functions of the respiratory tract
2. Briefly explain how these functions are carried out
3. Discuss the significance of dead space
4. Differentiate between minute ventilation and alveolar ventilation
5. Describe the cough and sneeze reflexes
Study Resources:
1. Chapter 39, Guyton and Hall Textbook of Medical Physiology, 14th edition
2. Chapter 34, Ganong’s Review of Medical Physiology, 26th edition
3. Chapter 17, Human Physiology by Lauralee Sherwood, 9th edition
4. Non-respiratory functions of the lungs https://academic.oup.com/bjaed/article/13/3/98/278874
Basavarajeeyam is an important text for ayurvedic physician belonging to andhra pradehs. It is a popular compendium in various parts of our country as well as in andhra pradesh. The content of the text was presented in sanskrit and telugu language (Bilingual). One of the most famous book in ayurvedic pharmaceutics and therapeutics. This book contains 25 chapters called as prakaranas. Many rasaoushadis were explained, pioneer of dhatu druti, nadi pareeksha, mutra pareeksha etc. Belongs to the period of 15-16 century. New diseases like upadamsha, phiranga rogas are explained.
Flu Vaccine Alert in Bangalore Karnatakaaddon Scans
As flu season approaches, health officials in Bangalore, Karnataka, are urging residents to get their flu vaccinations. The seasonal flu, while common, can lead to severe health complications, particularly for vulnerable populations such as young children, the elderly, and those with underlying health conditions.
Dr. Vidisha Kumari, a leading epidemiologist in Bangalore, emphasizes the importance of getting vaccinated. "The flu vaccine is our best defense against the influenza virus. It not only protects individuals but also helps prevent the spread of the virus in our communities," he says.
This year, the flu season is expected to coincide with a potential increase in other respiratory illnesses. The Karnataka Health Department has launched an awareness campaign highlighting the significance of flu vaccinations. They have set up multiple vaccination centers across Bangalore, making it convenient for residents to receive their shots.
To encourage widespread vaccination, the government is also collaborating with local schools, workplaces, and community centers to facilitate vaccination drives. Special attention is being given to ensuring that the vaccine is accessible to all, including marginalized communities who may have limited access to healthcare.
Residents are reminded that the flu vaccine is safe and effective. Common side effects are mild and may include soreness at the injection site, mild fever, or muscle aches. These side effects are generally short-lived and far less severe than the flu itself.
Healthcare providers are also stressing the importance of continuing COVID-19 precautions. Wearing masks, practicing good hand hygiene, and maintaining social distancing are still crucial, especially in crowded places.
Protect yourself and your loved ones by getting vaccinated. Together, we can help keep Bangalore healthy and safe this flu season. For more information on vaccination centers and schedules, residents can visit the Karnataka Health Department’s official website or follow their social media pages.
Stay informed, stay safe, and get your flu shot today!
ARTIFICIAL INTELLIGENCE IN HEALTHCARE.pdfAnujkumaranit
Artificial intelligence (AI) refers to the simulation of human intelligence processes by machines, especially computer systems. It encompasses tasks such as learning, reasoning, problem-solving, perception, and language understanding. AI technologies are revolutionizing various fields, from healthcare to finance, by enabling machines to perform tasks that typically require human intelligence.
Surat @ℂall @Girls ꧁❤8527049040❤꧂@ℂall @Girls Service Vip Top Model Safe
CISummit 2013: Pete DeWarn, Brigham Hyde, Mark Degatano, Breakthrough KOLs Panel: Quantifying Network Structure and Contextual Expertise
1. Adoption in a network
September 2010
November 2011
December 2009
February
October
January
August
March
April
June
May
July
Workshop: Physician Network Analysis
1
2. Finding networks with surveys
• Survey physician population
• Find “Thought Leaders”
• Sample can be incomplete as long as it
is reasonably representative
Workshop: Physician Network Analysis
2
3. Finding networks with claims data
• Use commercially available claims data
• Link through shared patients
• Much more complete network
Workshop: Physician Network Analysis
3
7. Bladder control in Boston
Urologist– 98 total, 3% of all ties
Generalist – 1434 total, 56.7% of all ties
Other Specialist – 1364 total, 40.3%
2896 Physicians – 4706 Ties
Workshop: Physician Network Analysis
7
8. Smoking cessation in Boston
Psychiatrist – 251 total, 7% of all ties
Cardiologist – 165 total, 5.4% of ties
Generalist – 1364 total, 58.8% of ties
Other Specialist – 875 total, 28.7% of all ties
2655 Physicians – 4264 Ties
Workshop: Physician Network Analysis
8
9. Passing information through a network
High Betweenness Centrality
• Examples of simple contagion –
Transmission of disease, ideas, or
physical objects/materials
• Effect can spread with a single
contact
• Centrality becomes analytically
important
High Closeness Centrality
Workshop: Physician Network Analysis
9
10. This is how we do it here
• Examples of complex contagion –
Changes in health habits, social
behaviors, cultural behaviors
Unclustered
• Spread of complex contagion usually
requires sustained interaction with
multiple carriers
Maintain
Behavior
• Clustering becomes analytically
important
Workshop: Physician Network Analysis
Clustered
10
Change
Behavior
11. Finding communities of practice
Community A
• Community members are more
likely to tie with each other than
with outsiders
• Our methods employ new iterative
maximizing algorithms which
dramatically increase efficiency
• Porter, Onnela & Mucha, 2009
Community B
Community C
Workshop: Physician Network Analysis
11
13. Examining diabetes in Raleigh-Durham
Selective Targeting
•Multiple practices highly
interconnected
Cluster of non-users
•Why target all these high
prescribers?
•Family Practice & Internal
Medicine
•Not group practice
•Most likely target central to
cluster
High Influence
Locations
•Cynthia M. Goodwin,
medium prescriber
Pediatrics Cluster
Not group practice
Bridge
Dr. Debra Baskett
Connects cluster of 10
with 50% users to
cluster of 9 non-users
Green – Adopters
Red – Non-Users
Pediatrics Cluster
Group practice
Workshop: Physician Network Analysis
13
14. Network predictive power in a launch
Januvia in Raleigh-Durham
Impact of having alters at geodesic distance one who have previously prescribed
Instantaneous Hazard
Cumulative Hazard
Unconnected
Unconnected
Connected
Connected
0.25
0.008
0.2
% Adoption
0.3
.01
% Adoption
0.012
0.006
0.15
0.004
0.1
0.002
0.05
0
0
1
3
5
7
9
11
13
15
17
19
21
23
25
1
Months
Workshop: Physician Network Analysis
3
5
7
9
11
13
15
Months
14
17
19
21
23
25
15. Lipitor use in Raleigh-Durham
Resistant Clusters
Top – Group of Family
Practitioners
Bottom – Cardiologists,
Family Practice, Internal
Medicine
Change Cluster
Multiple Specialties:
Cardiology, Family
Medicine
Mostly on different
floors of same building
Red – Decreasing use
Yellow – Stable use
Green – Increasing use
Key Relationship
Change Cluster
Dr. Thomas Nelson – Family
Practitioner increasing use
Group practice – Family
Medicine
Dr. Soon Kwark – Family
Practitioner decreasing use
Workshop: Physician Network Analysis
15
16. Predictive power for an inline product
Maintain
Prescribing Level
Difference model
Decrease
Prescribing Level
Predict change in proportion Lipitor of Lipitor &
Simvastatin prescriptions
Unclustered
Control for cash, Medicaid, Medicare prescribing
Control for secular decline in Lipitor usage
Control for number of dyslipidemia initiations
Clustered
Mean switching among alters
at distance 1. . . . 0.08 (4.4)
at distance 2 . . . . 0.04 (12.3)
at distance 3 . . . 0.02 (0.8)
Community switching . . . 0.15 (24.2)
Workshop: Physician Network Analysis
16
17. Introducing a priority score
Similar Positions
James Brown decile 7
Key Bridge
Paula Smith , decile 2
Chris Cole
Connects five
generalists to key
high prescribing
cardiologists
Seth Murphy &
Colin Jones
Highly Influential Position
Jean Mills
Cardiologist
232 Physicians – 320 Ties
Endocrinologist
Nephrologist
Generalist
Other Specialist
Workshop: Physician Network Analysis
17
Node size represents
physician decile
Large: 8-10
Medium: 2-7
Small: 0-1
18. Components of the influence index
• Influence Index is a weighted measure which uses:
•
•
•
•
•
•
•
The physician’s own target value
The target values of the physician’s distance one ties
The target values of the physician’s distance two ties
The target values of the physician’s distance three ties
The target values of the physician’s community
Uniqueness of influence position
Treatment directionality
Community
1st
Degree
Physician
of Interest
2nd
Degree
Workshop: Physician Network Analysis
18
3rd
Degree
19. Bladder control – community in Boston
Urologist
Generalist
Other Specialist
Node size represents
Physician decile
Large: 8-10
Medium: 2-7
Small: 0-1
1024 Physicians – 255 Ties
Workshop: Physician Network Analysis
19
20. Are we really measuring influence?
0.2
• Influence – the answer we are all looking for
• Other factors
Similar patient mix
Similar managed care environment
Similar promotional environment
• Let’s assume half influence/half other factors
• We have 0.1 correlation to work with
Workshop: Physician Network Analysis
20
21. Adoption in a network
High Prescribers
Influence Index
Influence exists, but is
unmeasured
Relationships measured
Potential value measured
Target
Value
Prescribing
Workshop: Physician Network Analysis
Prescribing + Influence
21
22. What can we do with the other half?
Promotion Priority
=
0.2
Potential Value
Prescriptions Written
Total Prescribing Correlation
0.1
Workshop: Physician Network Analysis
22
X
Receptiveness
Access
Behavioral Attributes
Market Segmentation
0.1
23. Adoption in a network
Dr. A
Dr. B
When Dr. A adopts Januvia, what do we know about Dr. B?
Likely to be influenced
Likely to have similar individual characteristics that led Dr. A to adopt
Likely to be subject to similar confounding variables
Workshop: Physician Network Analysis
23
24. Adoption in a network
Initially targeted High Influence/ High Prescriber/ Early Adopter
Second wave More receptive
Third wave Increasing acceptance
Workshop: Physician Network Analysis
Measuring susceptibility
Promotion is more effective
24
25. A simulation using contagion marketing
• Actual network from Chicago, actual network derived correlations
• Target 5% of diabetes prescribers for promotion
• Apply same promotional resources to both strategies
Three strategies
No Promotion – What would have happened absent any effort
High Prescriber – Promote to the highest prescriber not yet adopting
Network-based – Promote to highest promotion priority
Potential (with influence) times receptiveness
Workshop: Physician Network Analysis
25
27. A controlled trial
Choose targets based
on network influence
Choose targets based
on prescribing volume
Both methods have
the same:
Marketing message
Sales reps.
Number of targets
Time period
Targeted Physicians are those who
occupy influential network positions
Workshop: Physician Network Analysis
Targeted Physicians are those who
have a high prescribing volume
27
28. The results
3 Months
5 Months
3 Months
Pre-test measurement
Detailing
Post-test measurement
Market share capture is 50% greater in city A due to network targeting
Workshop: Physician Network Analysis
28
31. Adoption in a network
Januvia
2nd or 3rd line prescription in diabetes therapeutic area
Cox Proportional Hazards Model (first use, time in months)
Typical – Washington, D.C., tested in 9 other regions
Every variable set up as
Individual measure,
Alter mean at distances one to three
Community measure
Lagged and current time period
Controlled for diabetes prescribing (strongly significant effect, some combination of
opportunity to prescribe and detailing effort)
Workshop: Physician Network Analysis
31
32. Details from survival model
Relative to baseline –
Increase in probability of Januvia adoption during month
(All coefficients significant at 0.01 level)
2%
Probability of Adoption
Being an endocrinologist
Any new adopter at distance one *
Ten percent more adopters at distance one *
Ten percent increase in community adoption
Endocrinologist as network neighbor
Endocrinologist adopting at distance one * 47%
* Also significant at distances two and three
1%
Cox Proportional Hazards Model
Estimation of Baseline Hazard
10
20
Notes
All social variables are time-lagged
Diabetes initiations, other products, payment method controlled for
30
Months since Launch
Workshop: Physician Network Analysis
32
40
65%
27%
4%
5%
7%
34. Simulation by volume
• Assumed that prescribers would match average Januvia
proportion of patients
• Sum of approximately 70K scripts over 18 months
Prescriptions per Month
(based on claims data)
60000
Scripts/Month
50000
40000
No Intervention
High Prescribers
30000
Network Based
20000
10000
0
1
2
3
4
5
6
7
8
9
10
11
12
Months since launch
Workshop: Physician Network Analysis
34
13
14
15
16
17
18
36. Inline targeting by percentage
Increase in Abilify prescribing with network targeting
0.16
0.14
% Increase in Scrips
0.12
0.1
0.08
0.06
0.04
0.02
0
1
2
3
4
5
Quarter
Workshop: Physician Network Analysis
36
6
7
8
Editor's Notes
Serrano, Boguñá & Vespignani, 2009 wrote a paper which Nicholas introduced me too. A representation of the problem they are trying to solve is to show a meaningful map of the US air traffic system. Counting flights will not give a useful map, because a few airports, O’Hare, DFW, etc., will take over the map. Other thresholding methods will not keep all the airports or show their most important ties. They figured a method, called the “backbone” method, which takes only the most important relationships for each node. In other words, there is a separate threshold for each airport which takes account of its particular air traffic, rather than a universal threshold applied across all of them. I implemented this method early on.
Community boundaries are not the same as geographic boundaries.
This one slide now covers two points-In mode one before the animation build we are showing for the first time in this deck, a social network map and can discuss value of understanding structure, influence, etc then using the animation , we can discuss specific examples of how to leverage knowing doctors, community, location and influence
Initially, we can provide a lot of value in thinking better about the potential value of a target. Once the project is underway and we can see initial patterns of adoption, we can also provide information about receptiveness of a target.
We have some studies in the field, but do not yet have results that we can show. However, we can show a simulation. The social network is the actual one from Chicago, and the correlations used are the actual ones from the first eighteen months of Januvia adoption in Chicago. The primary assumption is the effect of promotion, which we cannot adequately measure retrospectively, especially since promotion was actually done in Chicago. However, because each scenario uses the exact same promotional resources, the relative ranking of the approaches should be robust under a wide variety of conditions. The exact difference would depend on the actual promotion resources used and their effectiveness. To give a baseline for the assumptions we used, we also included a simulation without any promotion. To the extent that the difference between “No Promotion” and “High Prescriber” seems realistic, the improvement from “Network-Based” targeting should follow.
This chart shows the total percentage of prescribers who have adopted Januvia at each month since launch in our simulation. The physicians included are all those who had at least five diabetes prescriptions in a three year lookback. This does not show the adoption rates for the targeted physicians – those would be substantially higher – but instead shows what happens in the entire population of diabetes prescribers when different promotional strategies are used. Again, because the promotional effectiveness is the same in both scenarios, the relative ranking of these curves would not change, although the absolute distance between them likely would.
This slide shows some of the coefficients from a hazard model predicting Januvia adoption in Chicago. The baseline hazard shows the adoption rate through time with all variables controlled for. During the first month, approximately one percent of physicians will use Januvia for the first time. This percentage rises and then enters a long decline as time passes since the introduction. The coefficients for each variable show how much more likely a physician is to prescribe than the baseline when the characteristic is true. For example, an endocrinologist is 65% more likely than a non-endocrinologist, while having a network neighbor adopt is associated with a 27% increase in probability.
This simulation shows the total number of prescriptions made in each scenario. As with the adoption rates, the actual numbers are subject to assumptions about promotional resources, but the relative rankings are robust to this. When measuring in total prescriptions, the difference between promotion and non-promotion is more pronounced, because failure to target high prescribers leads to a disproportionate loss of total market share. We had to assume that each physician would use Januvia on the average proportion of their patients as seen in the real data, which is likely a conservative assumption. As well, since this is base on claims data, it does not represent the entire market. Although we are unable to tell exactly, previous experience suggests that commercial claims data represents about 20 – 40 % of the entire market, so the absolute numbers should be multiplied by some 3-5x to better reflect the real world.