Network analytics can help improve healthcare decision making in three key ways:
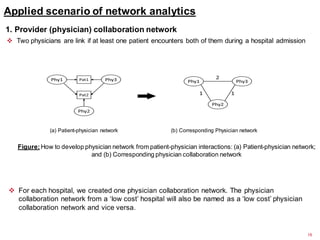
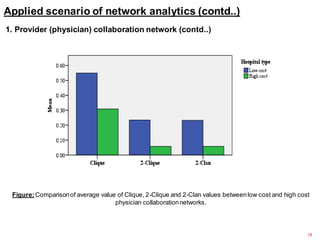
1) Analyzing physician collaboration networks found that lower-cost hospitals had physicians working in smaller groups.
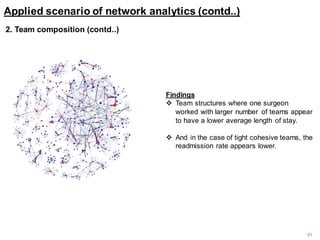
2) Examining surgical team compositions revealed that looser team structures with individual surgeons on multiple teams correlated with shorter patient lengths of stay.
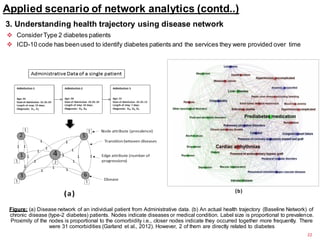
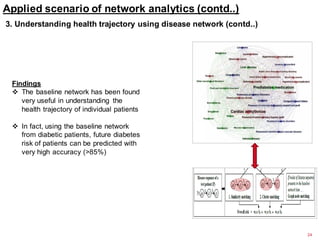
3) Modeling disease networks accurately predicted future diabetes risk for patients based on their health trajectories and comorbidities in the network.