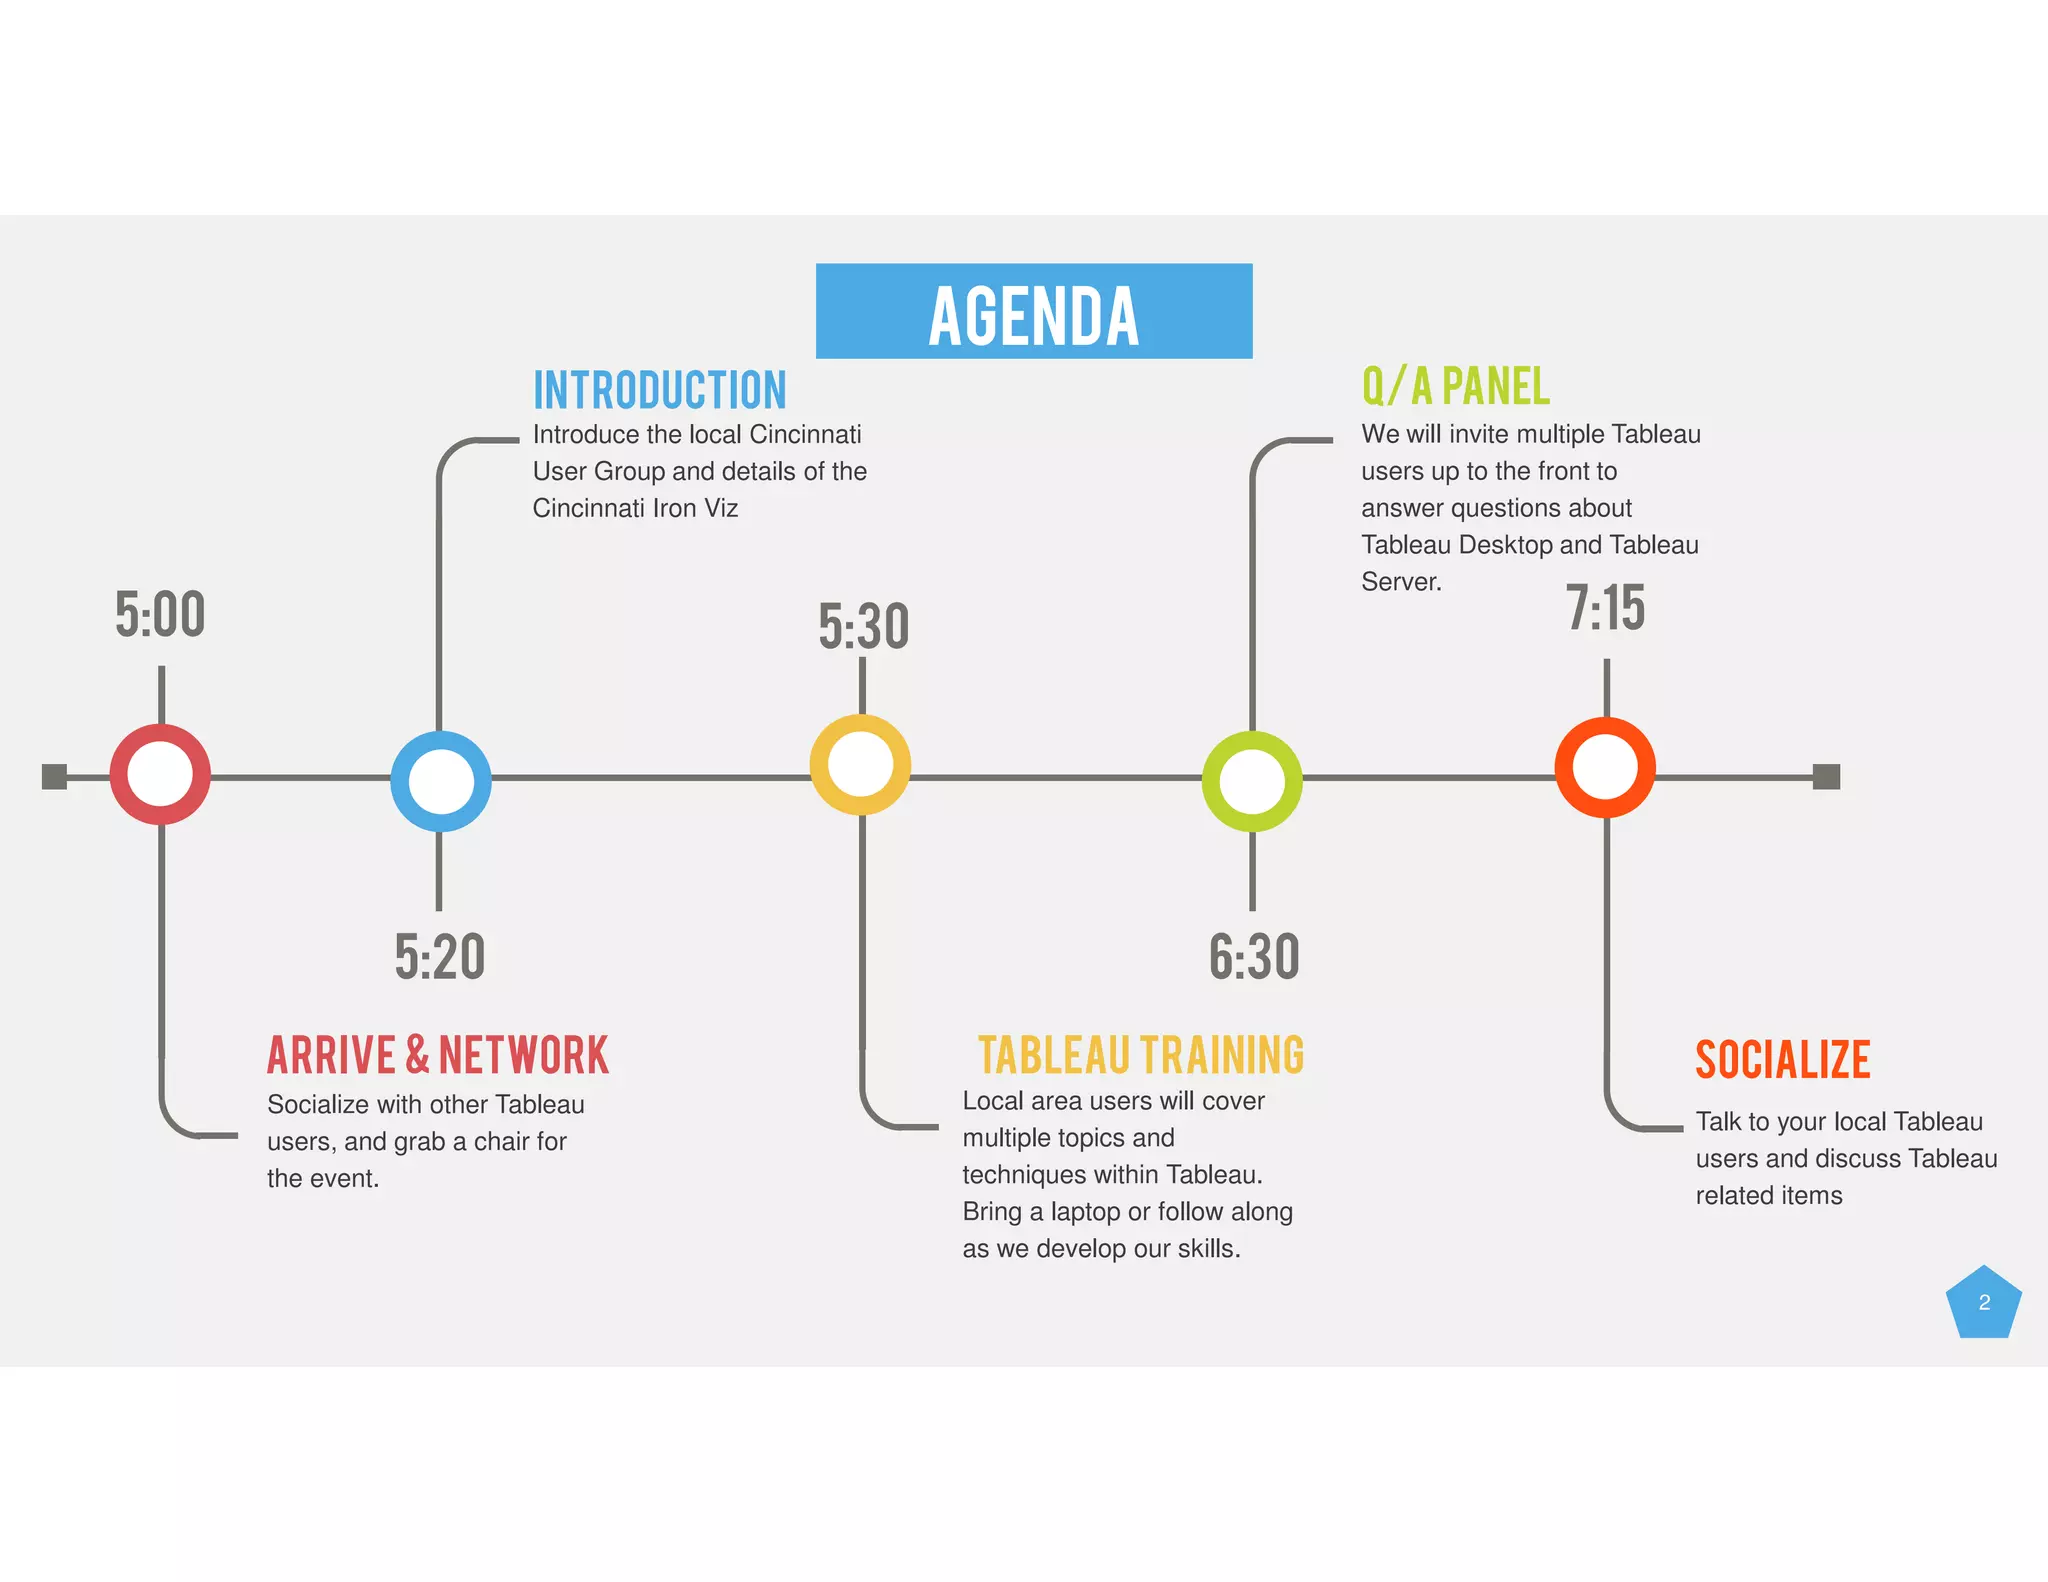
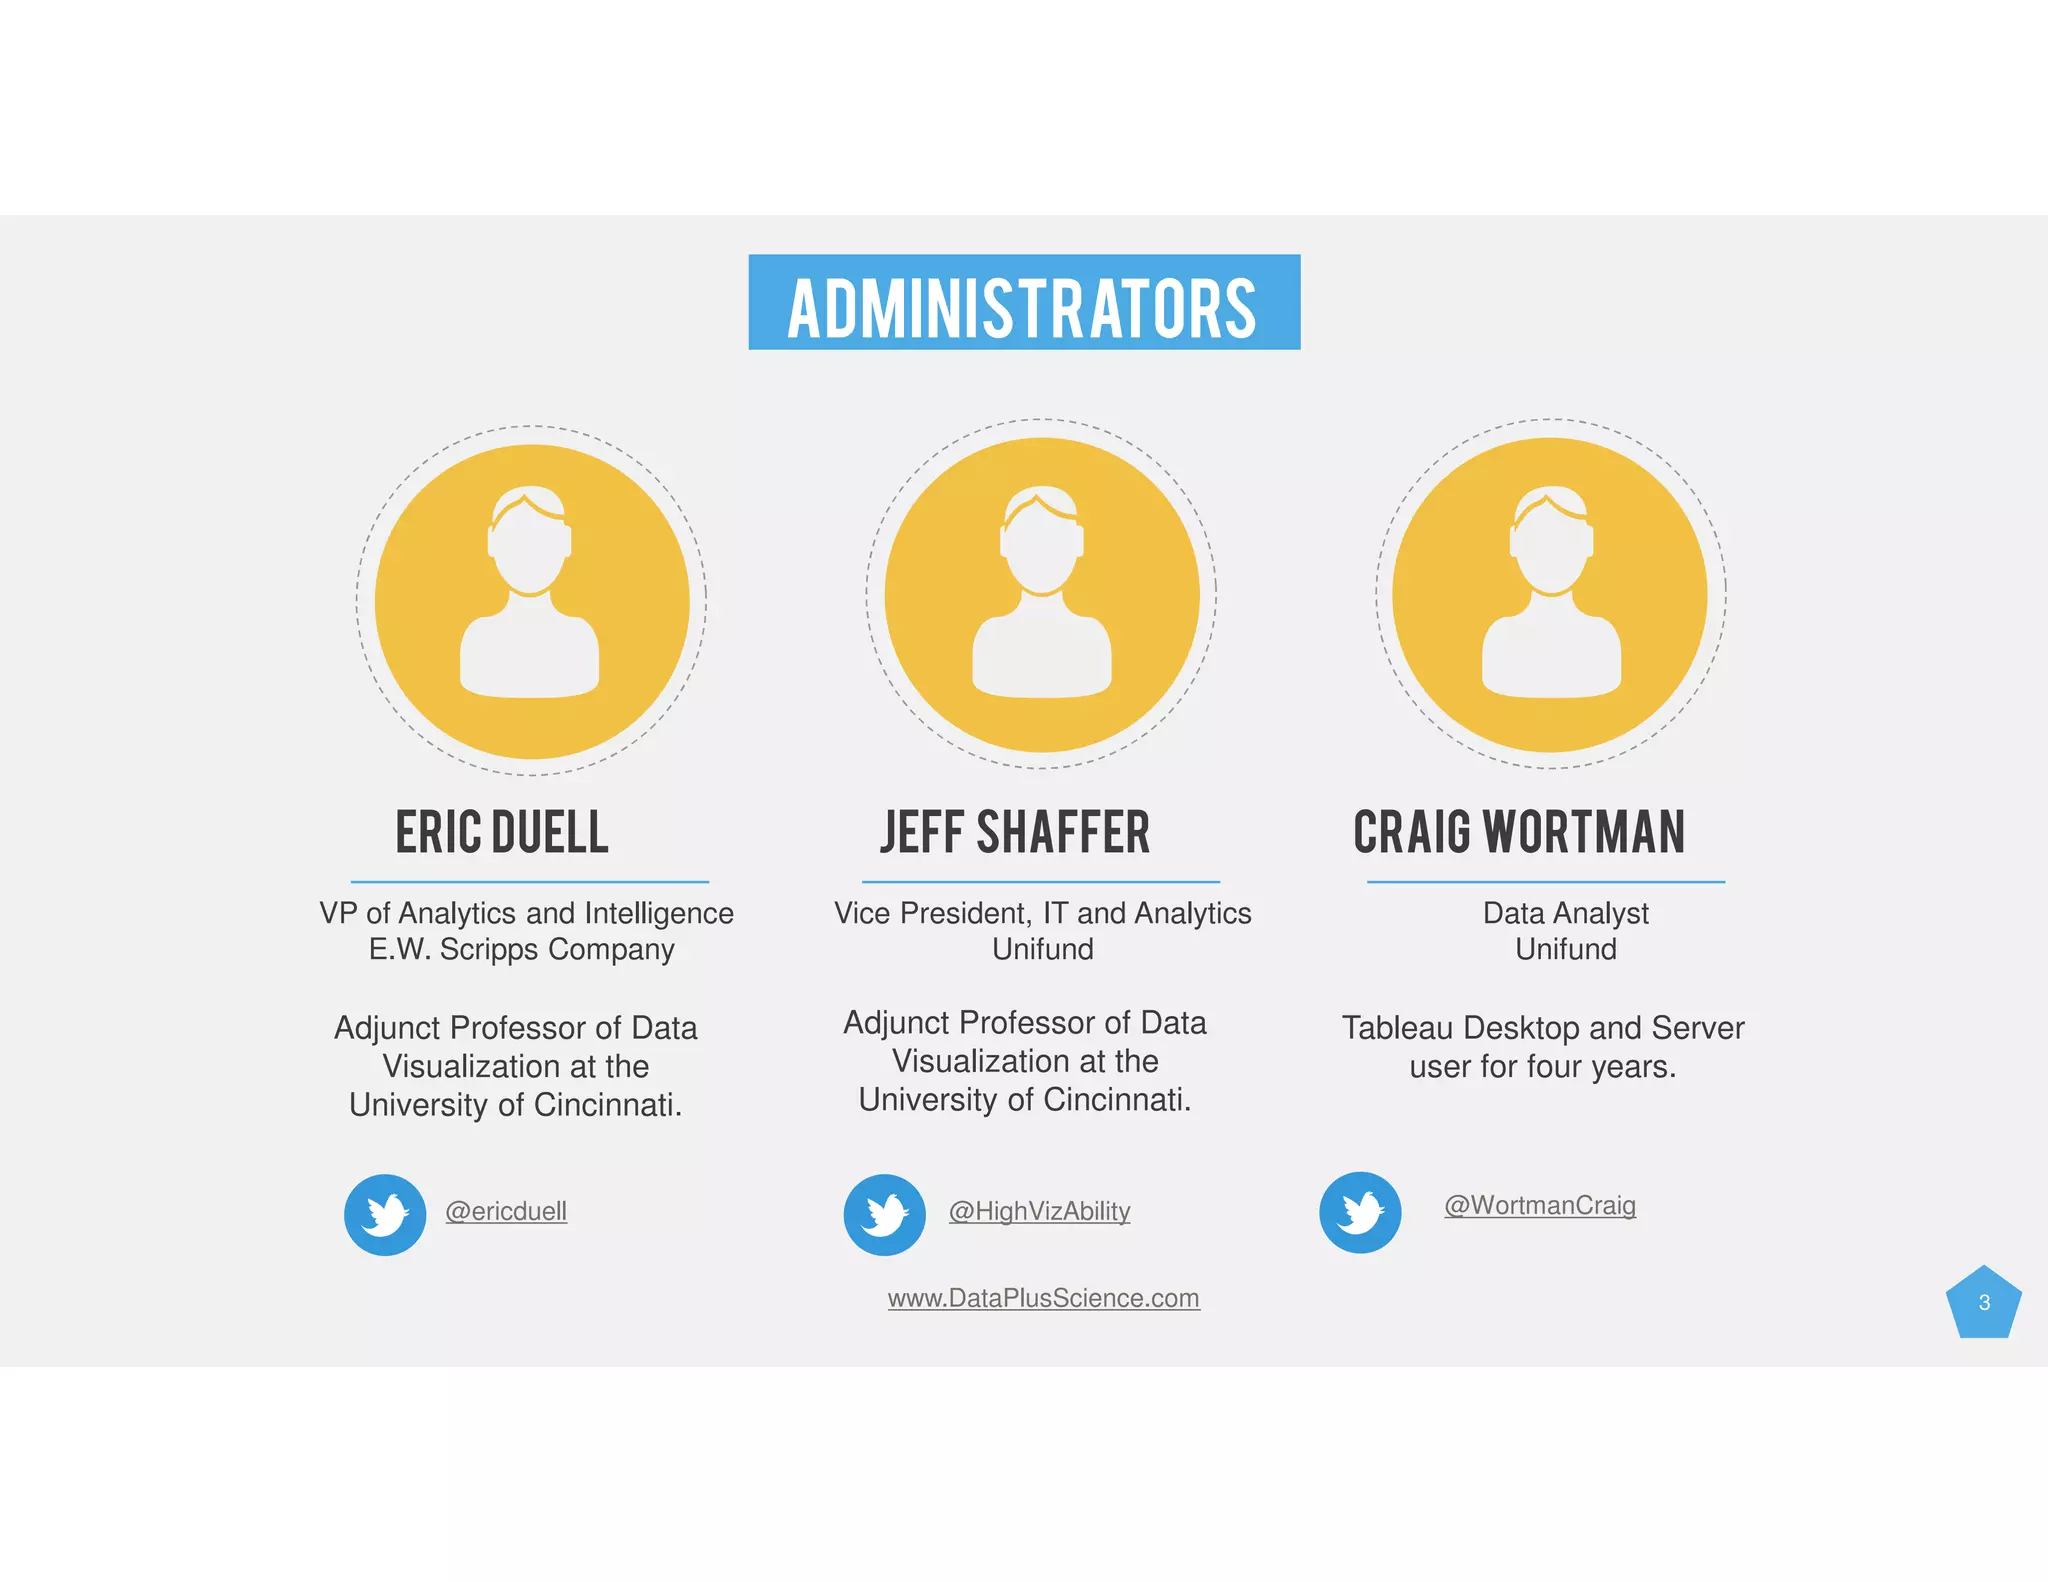
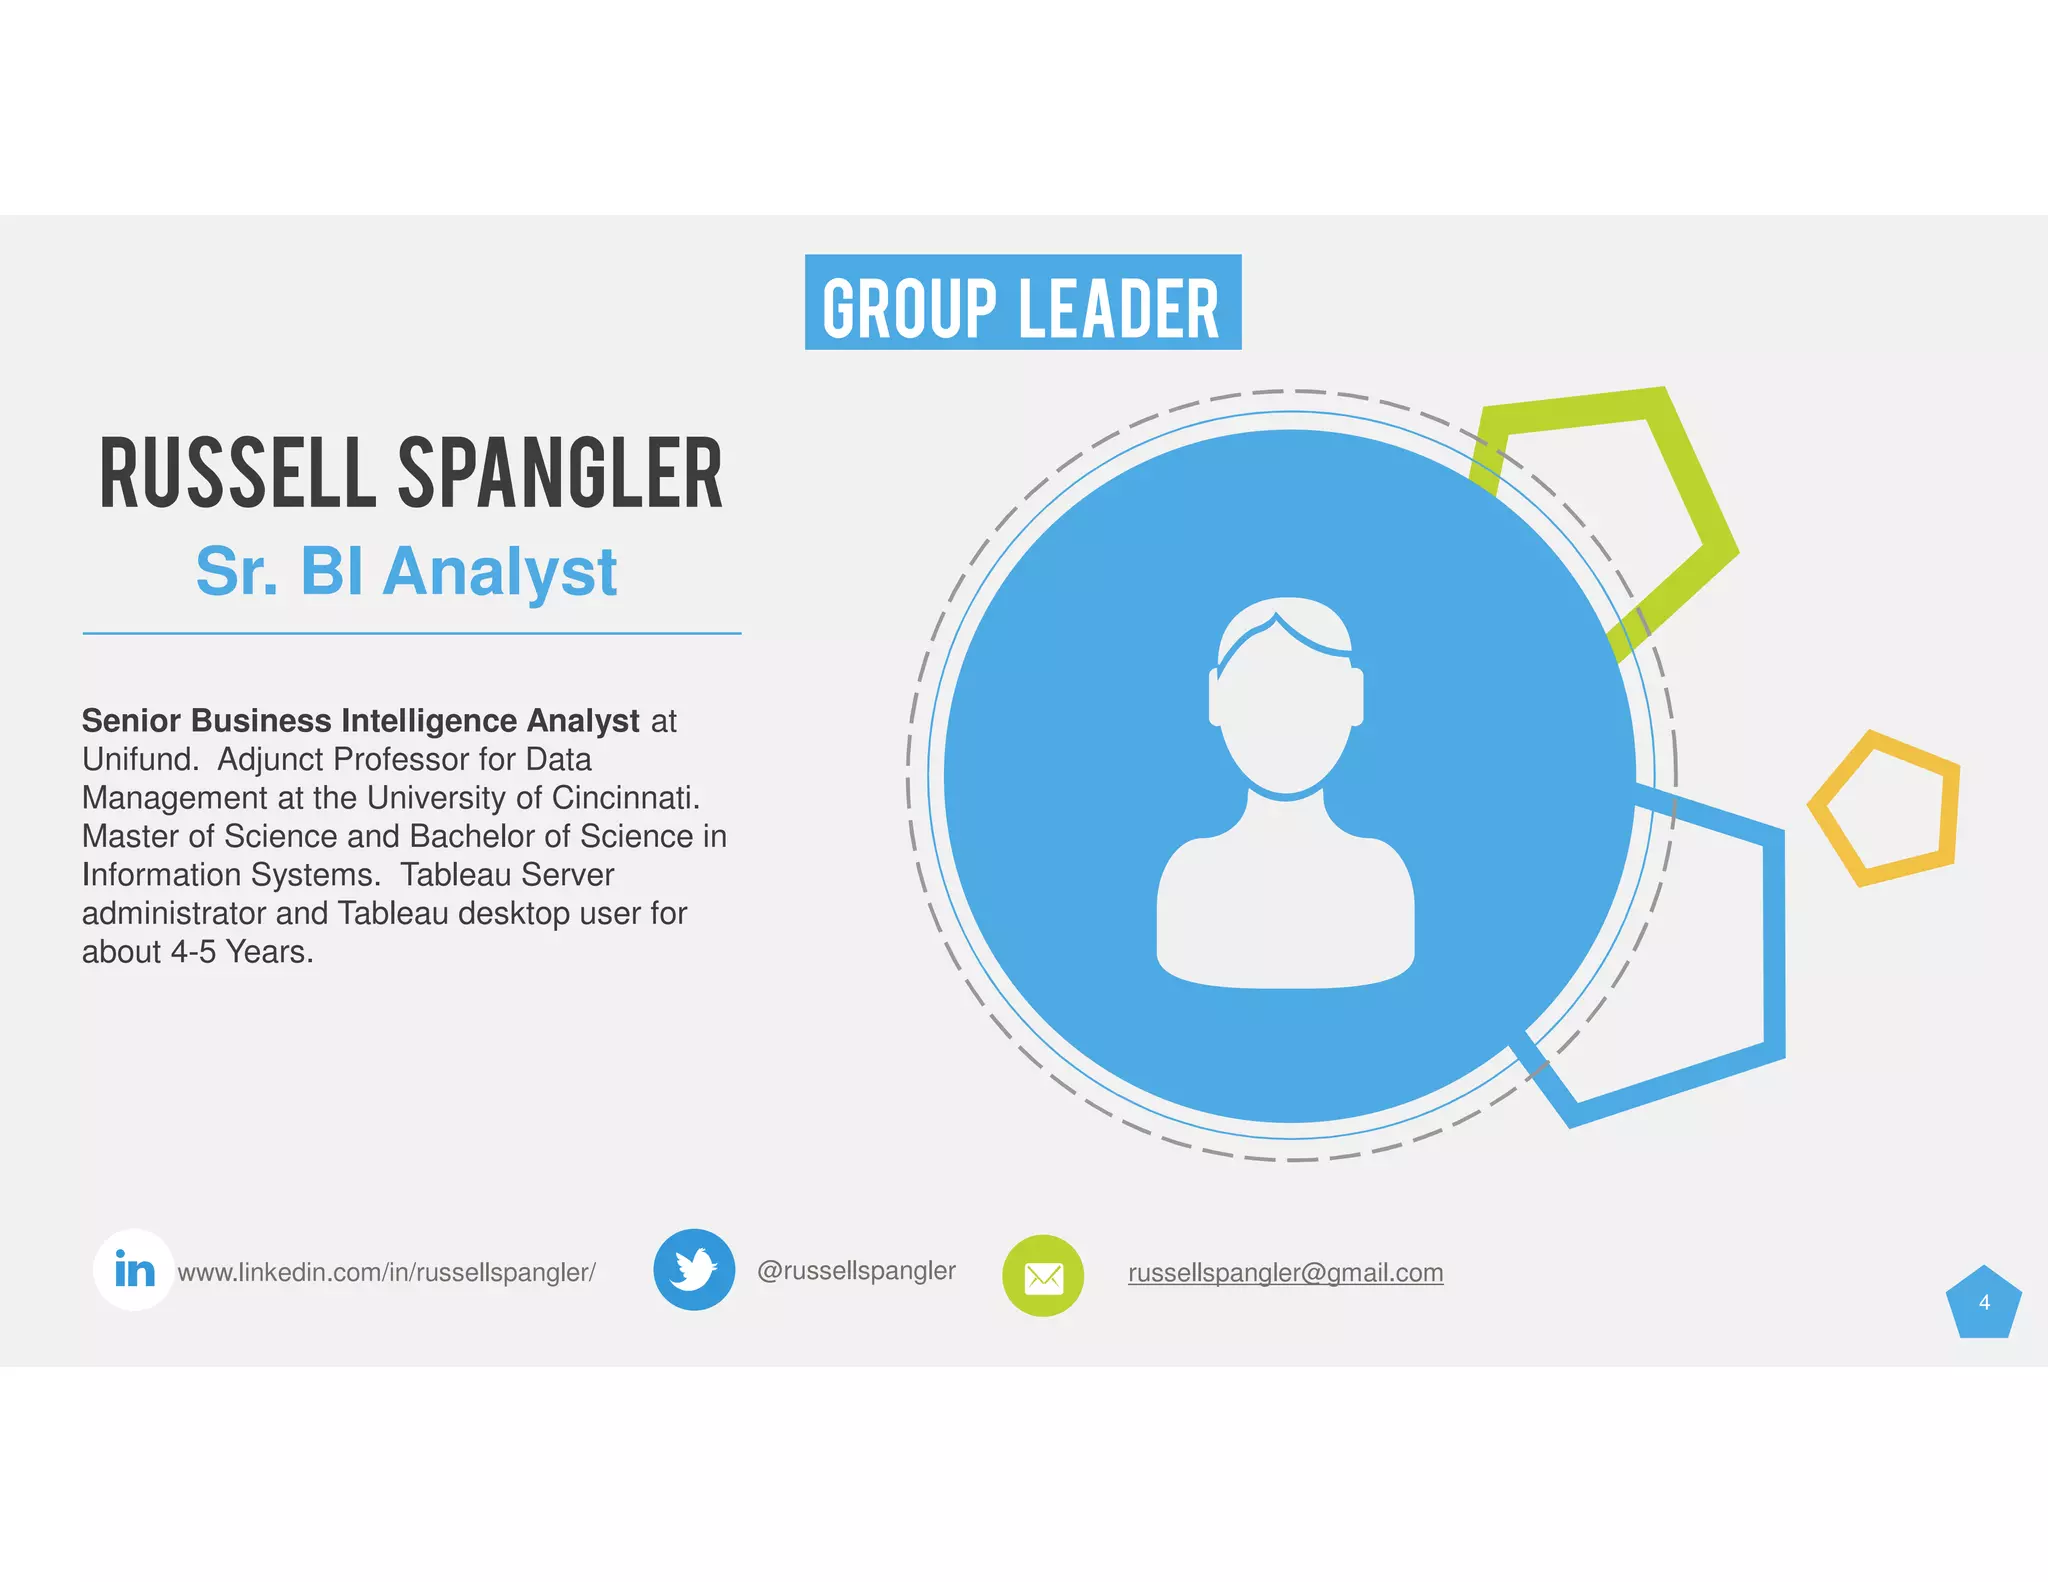
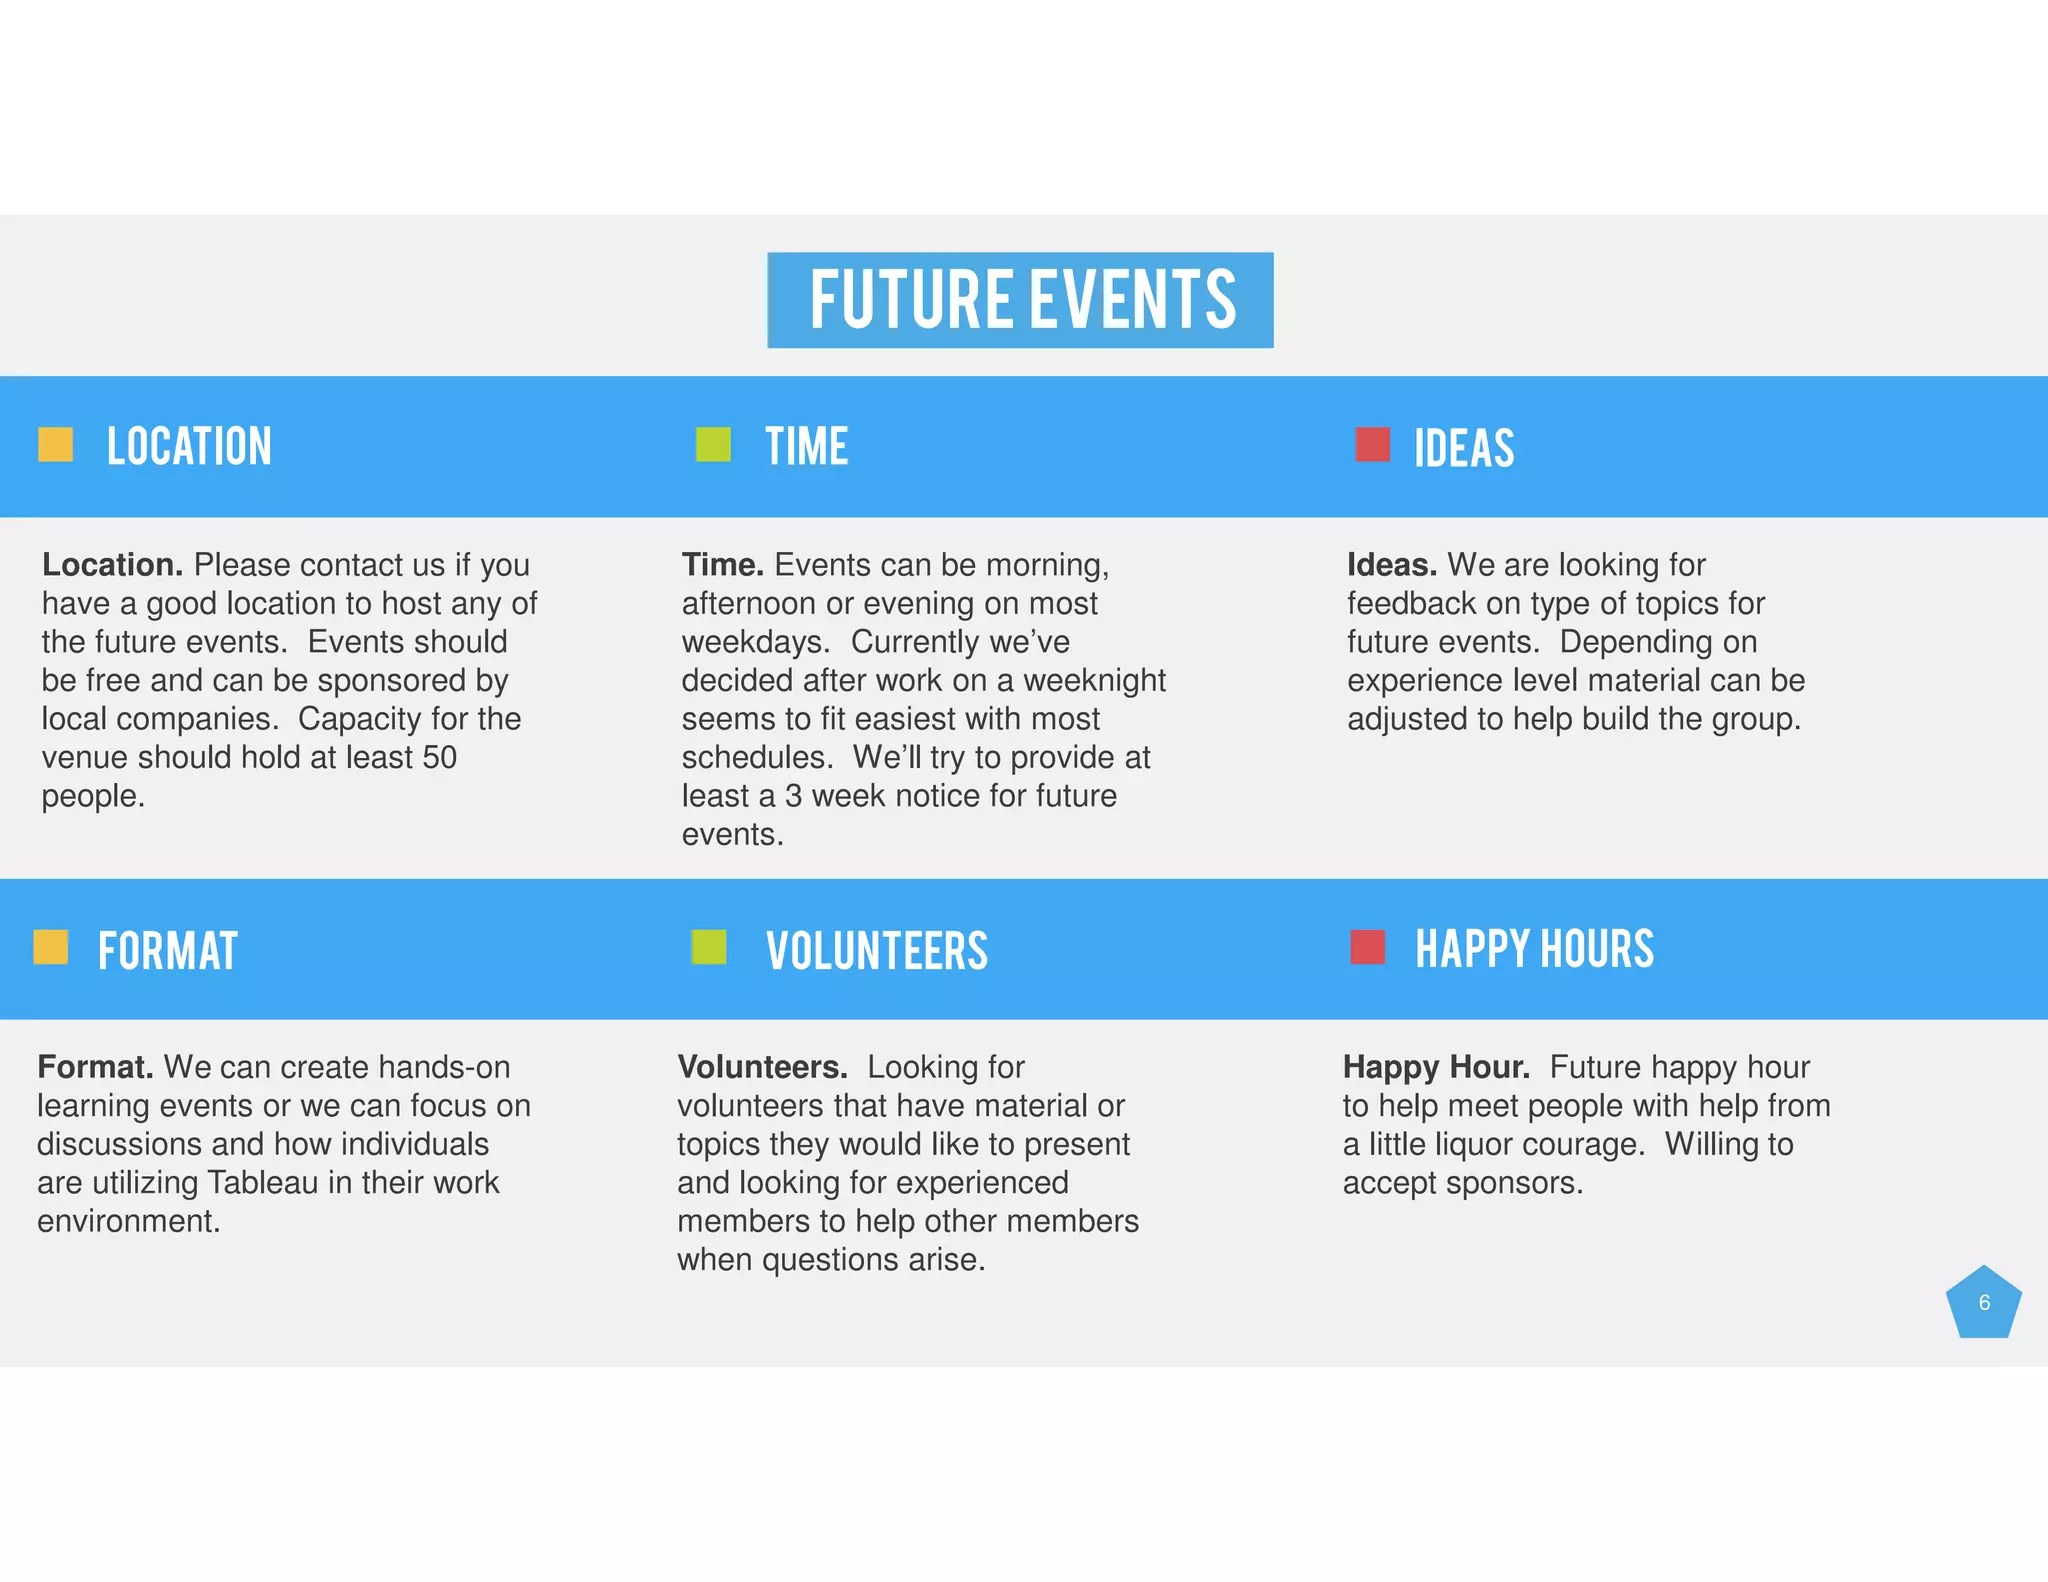
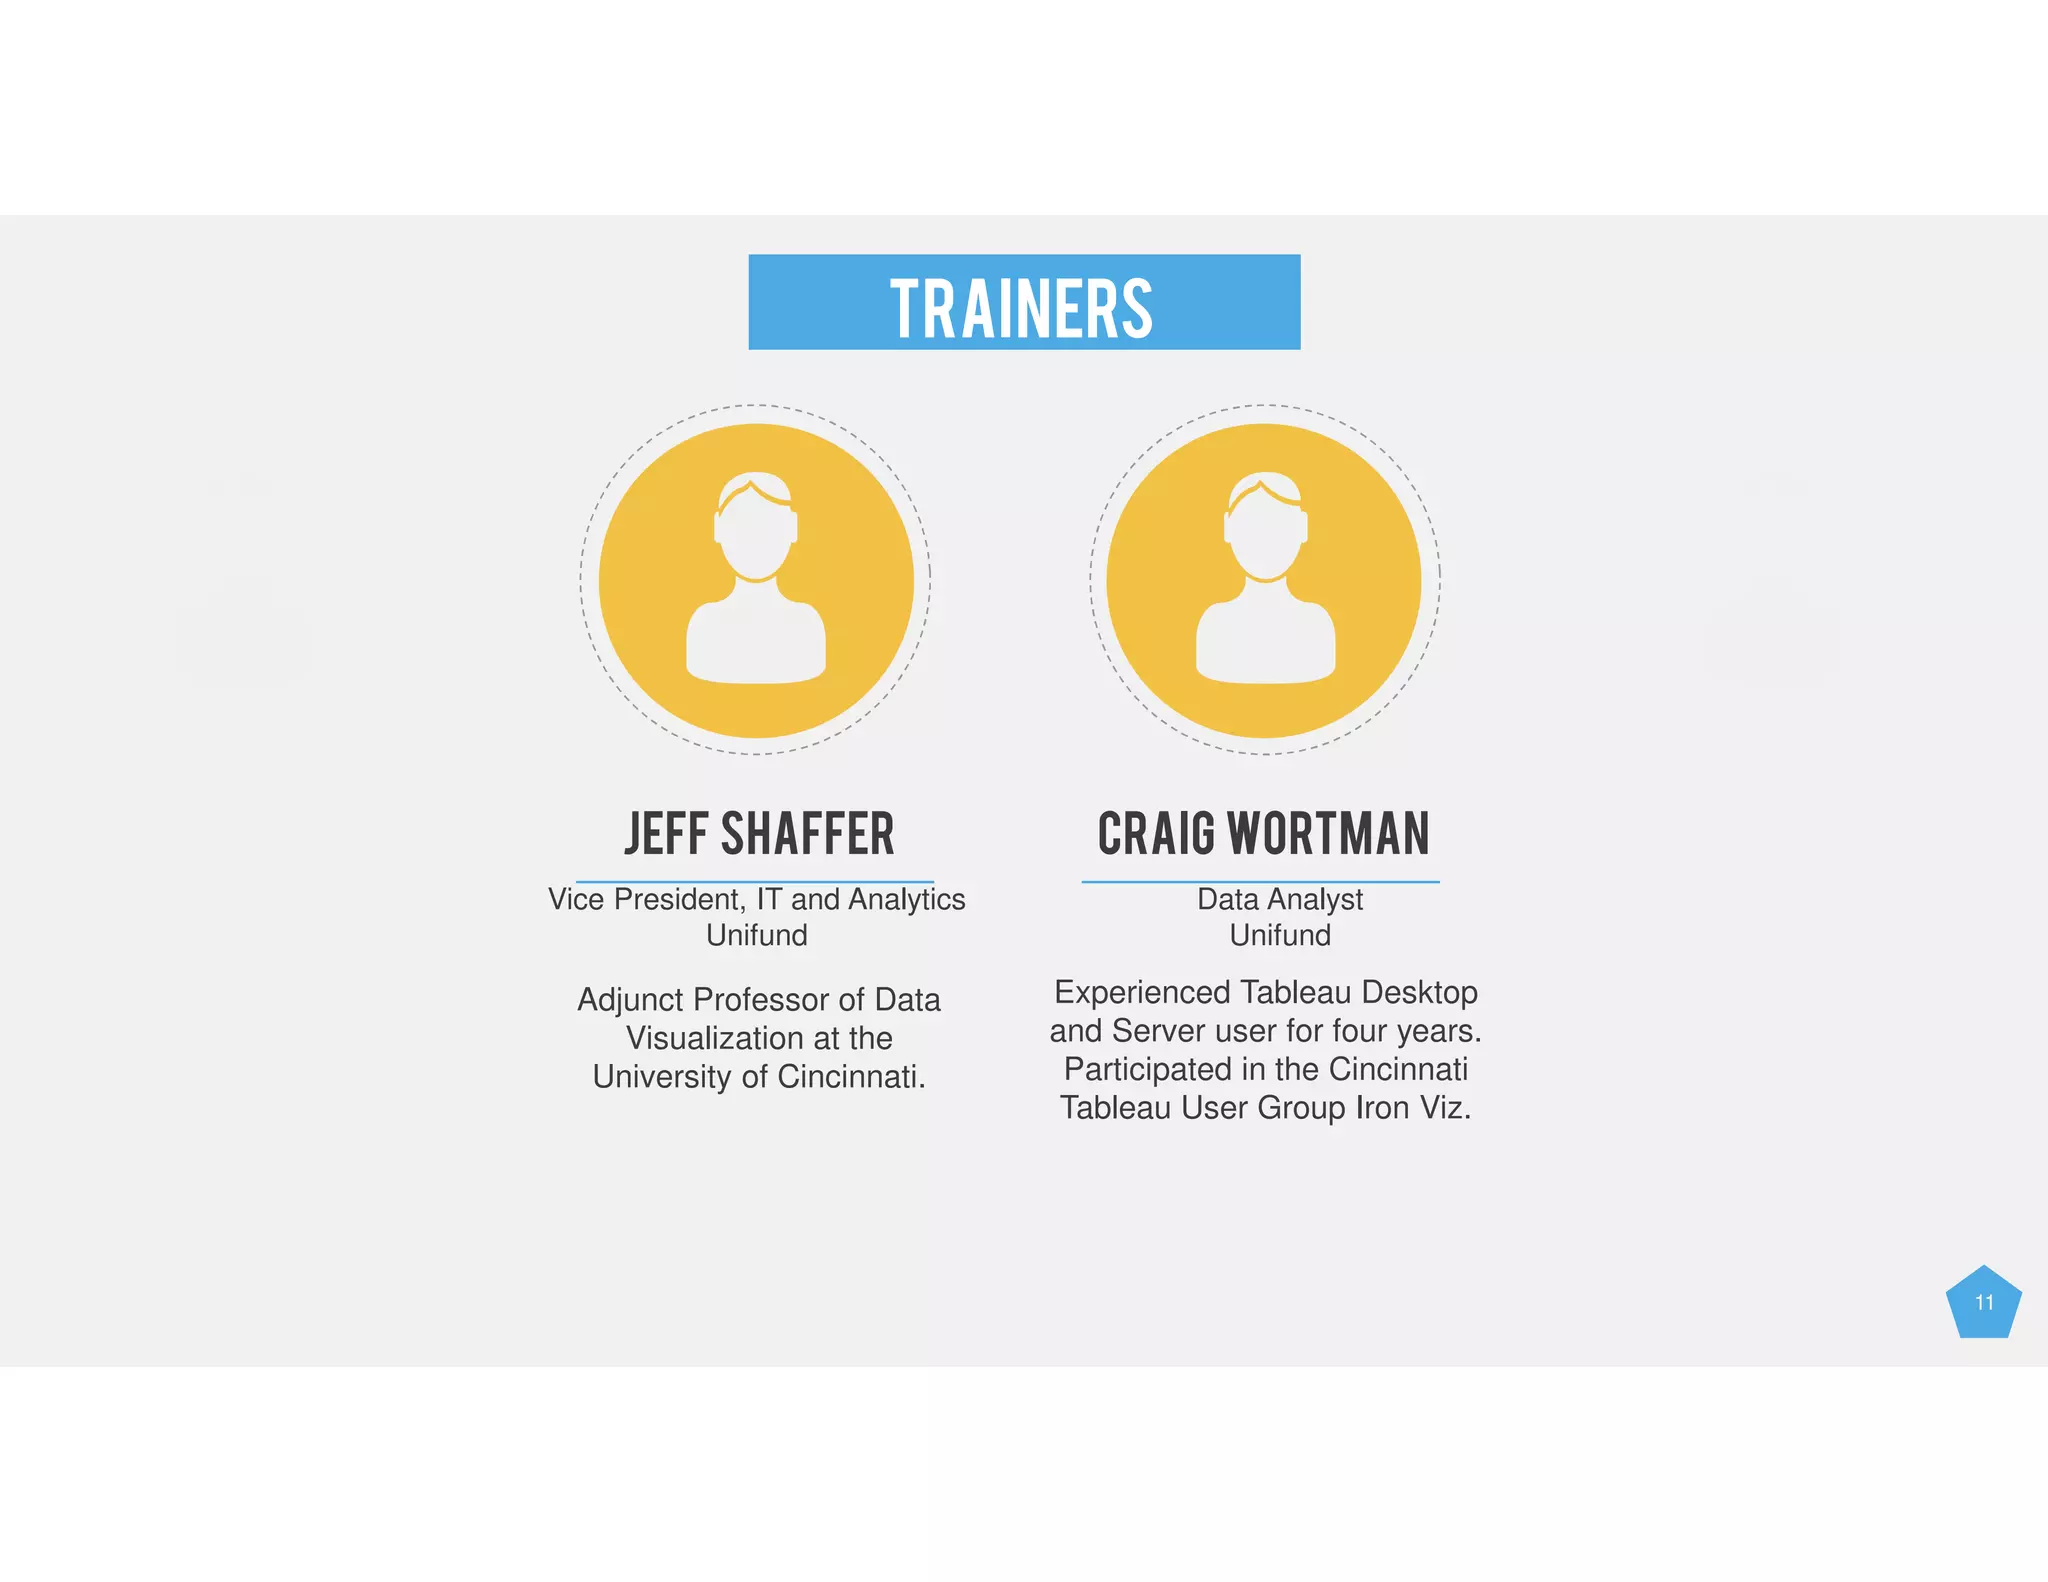
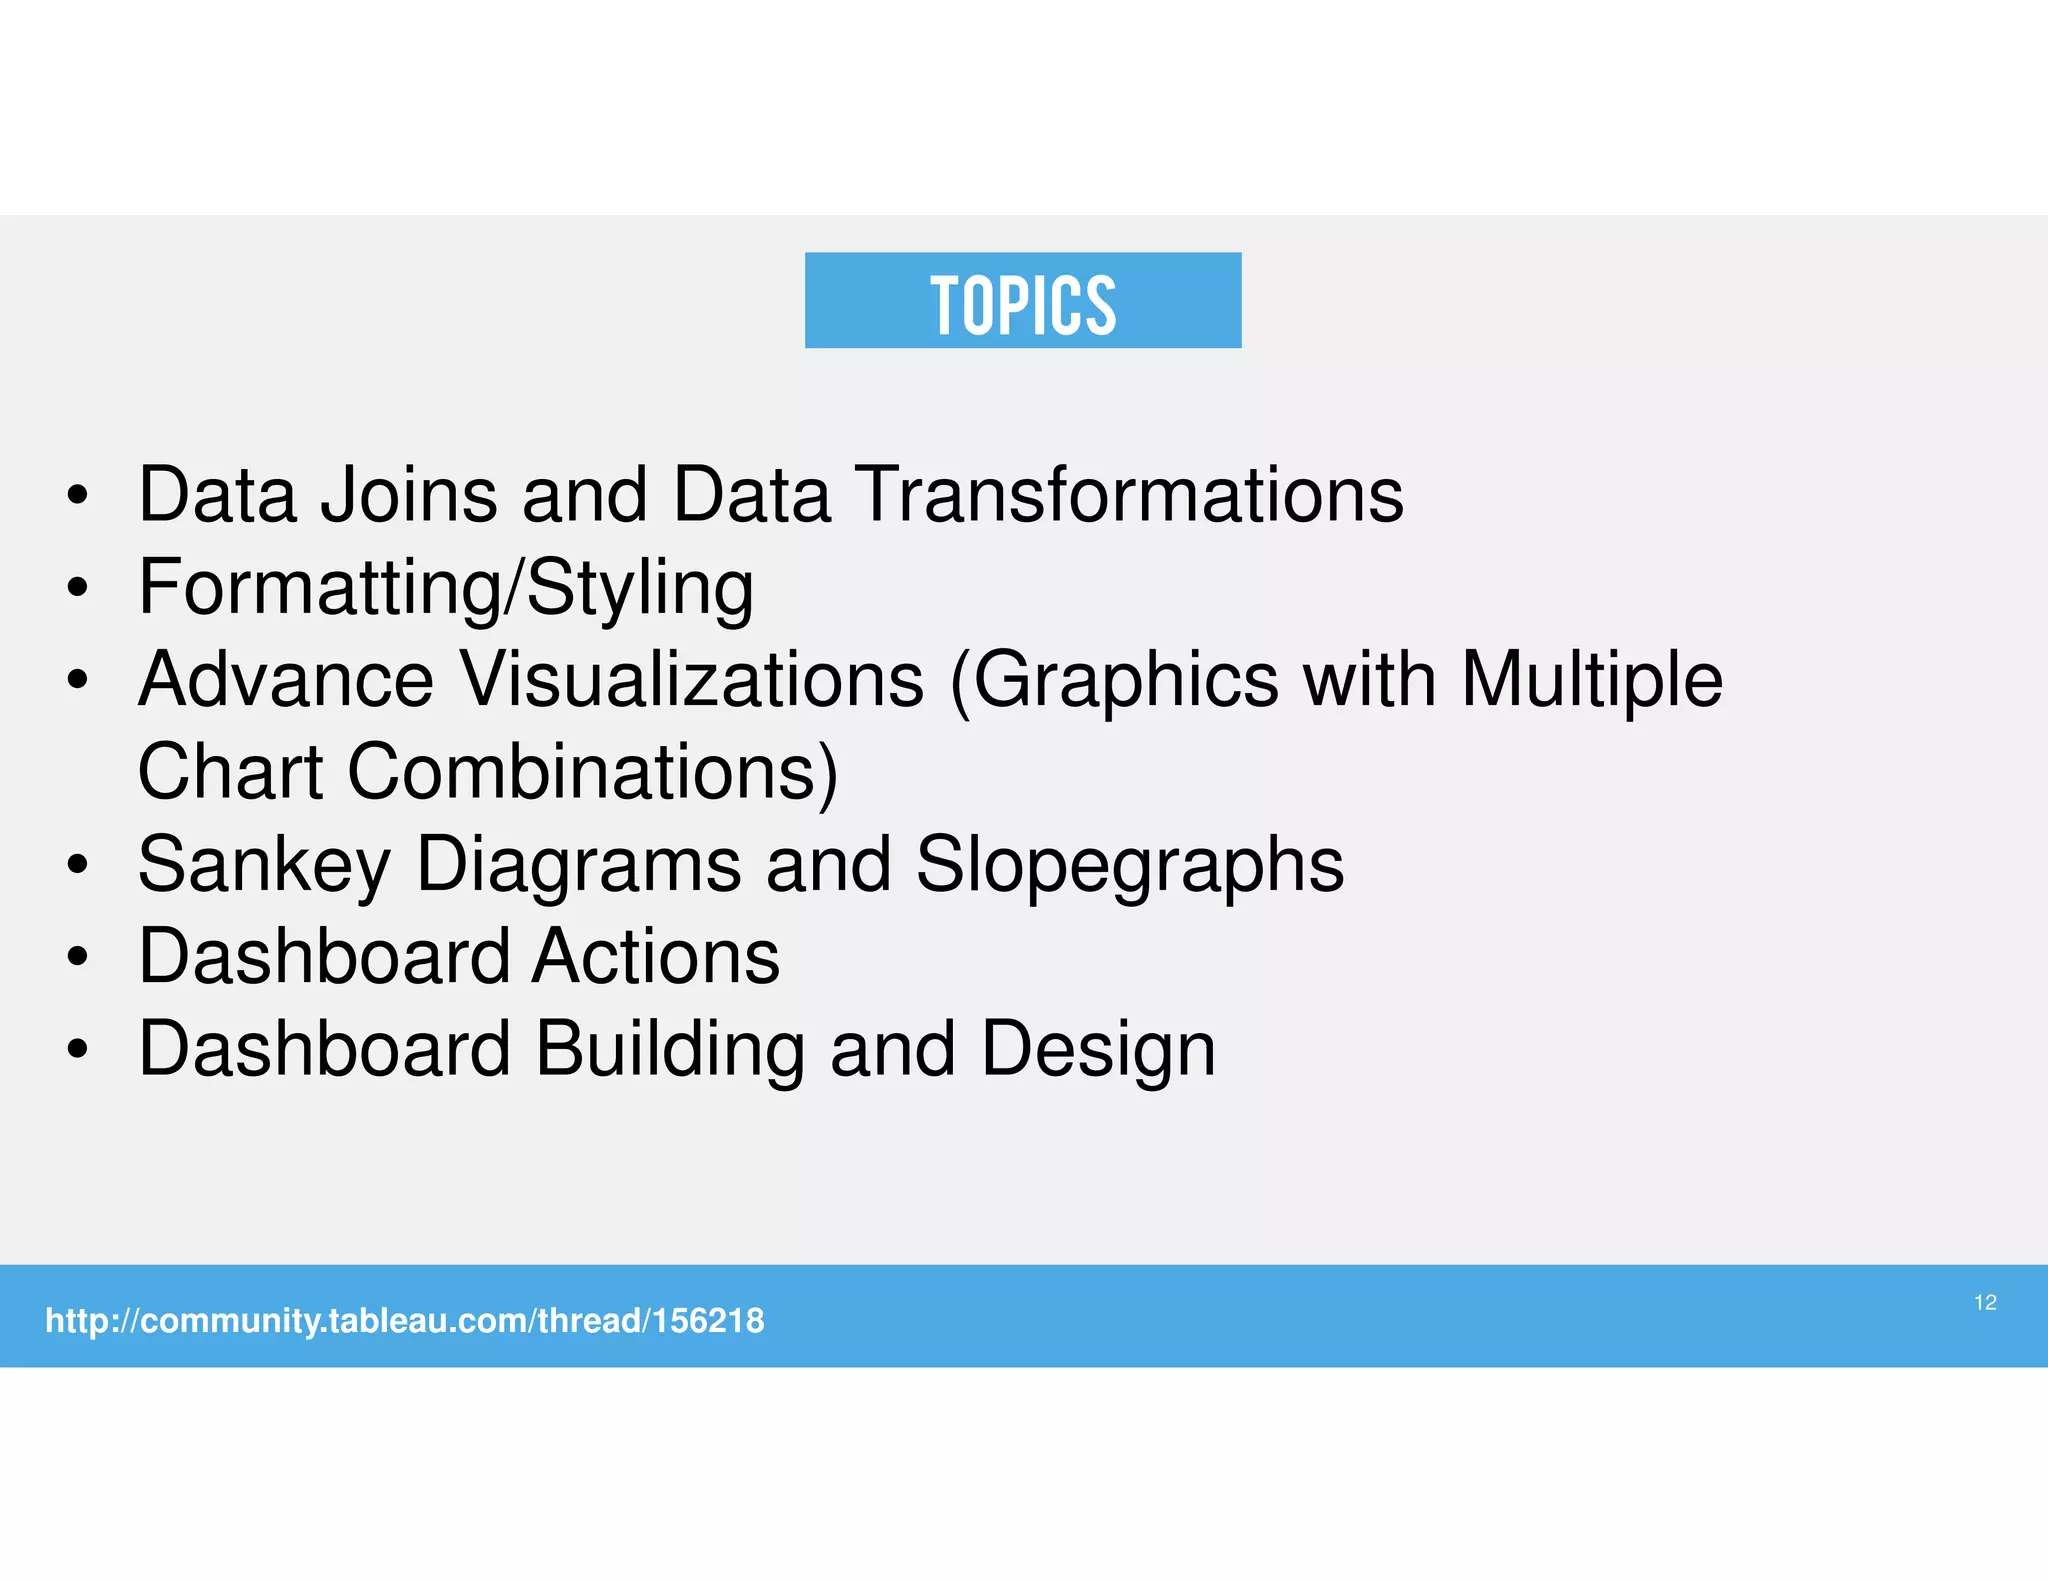
Tableau USER GROUP
CINCINNATI
Event #3 – Tableau Training & Q/A Panel
2
ARRIVE & NETWORK
Socialize with other Tableau
users, and grab a chair for
the event.
Tableau TRAINING
Local area users will cover
multiple topics and
techniques within Tableau.
Bring a laptop or follow along
as we develop our skills.
Q/A PaNEL
We will invite multiple Tableau
users up to the front to
answer questions about
Tableau Desktop and Tableau
Server.
AGENDA
5:00
Introduce the local Cincinnati
User Group and details of the
Cincinnati Iron Viz
INTRODUCTION
5:20
5:30
6:30
7:15
SOCIALIZE
Talk to your local Tableau
users and discuss Tableau
related items
3
Administrators
ERIC DUELL JEFF SHAFFER CRAIG WORTMAN
VP of Analytics and Intelligence
E.W. Scripps Company
Vice President, IT and Analytics
Unifund
Data Analyst
Unifund
Adjunct Professor of Data
Visualization at the
University of Cincinnati.
Adjunct Professor of Data
Visualization at the
University of Cincinnati.
Tableau Desktop and Server
user for four years.
@ericduell @HighVizAbility @WortmanCraig
www.DataPlusScience.com
4
GROUP LEADER
@russellspangler russellspangler@gmail.comwww.linkedin.com/in/russellspangler/
RUSSELL SPANGLER
Sr. BI Analyst
Senior Business Intelligence Analyst at
Unifund. Adjunct Professor for Data
Management at the University of Cincinnati.
Master of Science and Bachelor of Science in
Information Systems. Tableau Server
administrator and Tableau desktop user for
about 4-5 Years.
5
JOIN US
You Should Join The Cincinnati
Tableau User Group
- Beyonce
Please Join The Cincinnati
User Group Page
http://community.tableau.com/groups/midwest
Search for “Cincinnati Tableau User Group”
6
FUTURE EVENTS
Location. Please contact us if you
have a good location to host any of
the future events. Events should
be free and can be sponsored by
local companies. Capacity for the
venue should hold at least 50
people.
Time. Events can be morning,
afternoon or evening on most
weekdays. Currently we’ve
decided after work on a weeknight
seems to fit easiest with most
schedules. We’ll try to provide at
least a 3 week notice for future
events.
Ideas. We are looking for
feedback on type of topics for
future events. Depending on
experience level material can be
adjusted to help build the group.
Location TIME IDEAS
Format. We can create hands-on
learning events or we can focus on
discussions and how individuals
are utilizing Tableau in their work
environment.
Volunteers. Looking for
volunteers that have material or
topics they would like to present
and looking for experienced
members to help other members
when questions arise.
Happy Hour. Future happy hour
to help meet people with help from
a little liquor courage. Willing to
accept sponsors.
FORMAT VOLUNTEERS HAPPY HOURS
OUR HOSTS
University of Cincinnati Center for Business Analytics
• The UC Center for Business Analytics, a corporate-academic partnership, brings together best-
in-class stakeholders, and a world-class multidisciplinary group of MS Business Analytics and
Information Systems faculty and students.
• The Center promotes the use of data-driven analytical methods that improve business,
government, and organizational performance.
• Analytical research and consulting services, as well as, onsite corporate analytics training,
using actual company data, in any area of data analytics and data management.
UC Analytics Summit 2015 (May 29)
http://business.uc.edu/centers/analytics-center/events.html
7
8
9
10TaBLEAU TRAINING
11
TRAINERS
JEFF SHAFFER CraiG WORTMAN
Vice President, IT and Analytics
Unifund
Data Analyst
Unifund
Adjunct Professor of Data
Visualization at the
University of Cincinnati.
Experienced Tableau Desktop
and Server user for four years.
Participated in the Cincinnati
Tableau User Group Iron Viz.
TOPICS
• Data Joins and Data Transformations
• Formatting/Styling
• Advance Visualizations (Graphics with Multiple
Chart Combinations)
• Sankey Diagrams and Slopegraphs
• Dashboard Actions
• Dashboard Building and Design
http://community.tableau.com/thread/156218
12
13Q/A PANEL
14
ThankS
Don’t Forget to Join the
Cincinnati User Group Page
http://community.tableau.com/groups/midwest
Search for “Cincinnati Tableau User Group”

Cincinnati Tableau User Group Event #3

  • 1.
    Tableau USER GROUP CINCINNATI Event#3 – Tableau Training & Q/A Panel
  • 2.
    2 ARRIVE & NETWORK Socializewith other Tableau users, and grab a chair for the event. Tableau TRAINING Local area users will cover multiple topics and techniques within Tableau. Bring a laptop or follow along as we develop our skills. Q/A PaNEL We will invite multiple Tableau users up to the front to answer questions about Tableau Desktop and Tableau Server. AGENDA 5:00 Introduce the local Cincinnati User Group and details of the Cincinnati Iron Viz INTRODUCTION 5:20 5:30 6:30 7:15 SOCIALIZE Talk to your local Tableau users and discuss Tableau related items
  • 3.
    3 Administrators ERIC DUELL JEFFSHAFFER CRAIG WORTMAN VP of Analytics and Intelligence E.W. Scripps Company Vice President, IT and Analytics Unifund Data Analyst Unifund Adjunct Professor of Data Visualization at the University of Cincinnati. Adjunct Professor of Data Visualization at the University of Cincinnati. Tableau Desktop and Server user for four years. @ericduell @HighVizAbility @WortmanCraig www.DataPlusScience.com
  • 4.
    4 GROUP LEADER @russellspangler russellspangler@gmail.comwww.linkedin.com/in/russellspangler/ RUSSELLSPANGLER Sr. BI Analyst Senior Business Intelligence Analyst at Unifund. Adjunct Professor for Data Management at the University of Cincinnati. Master of Science and Bachelor of Science in Information Systems. Tableau Server administrator and Tableau desktop user for about 4-5 Years.
  • 5.
    5 JOIN US You ShouldJoin The Cincinnati Tableau User Group - Beyonce Please Join The Cincinnati User Group Page http://community.tableau.com/groups/midwest Search for “Cincinnati Tableau User Group”
  • 6.
    6 FUTURE EVENTS Location. Pleasecontact us if you have a good location to host any of the future events. Events should be free and can be sponsored by local companies. Capacity for the venue should hold at least 50 people. Time. Events can be morning, afternoon or evening on most weekdays. Currently we’ve decided after work on a weeknight seems to fit easiest with most schedules. We’ll try to provide at least a 3 week notice for future events. Ideas. We are looking for feedback on type of topics for future events. Depending on experience level material can be adjusted to help build the group. Location TIME IDEAS Format. We can create hands-on learning events or we can focus on discussions and how individuals are utilizing Tableau in their work environment. Volunteers. Looking for volunteers that have material or topics they would like to present and looking for experienced members to help other members when questions arise. Happy Hour. Future happy hour to help meet people with help from a little liquor courage. Willing to accept sponsors. FORMAT VOLUNTEERS HAPPY HOURS
  • 7.
    OUR HOSTS University ofCincinnati Center for Business Analytics • The UC Center for Business Analytics, a corporate-academic partnership, brings together best- in-class stakeholders, and a world-class multidisciplinary group of MS Business Analytics and Information Systems faculty and students. • The Center promotes the use of data-driven analytical methods that improve business, government, and organizational performance. • Analytical research and consulting services, as well as, onsite corporate analytics training, using actual company data, in any area of data analytics and data management. UC Analytics Summit 2015 (May 29) http://business.uc.edu/centers/analytics-center/events.html 7
  • 8.
  • 9.
  • 10.
  • 11.
    11 TRAINERS JEFF SHAFFER CraiGWORTMAN Vice President, IT and Analytics Unifund Data Analyst Unifund Adjunct Professor of Data Visualization at the University of Cincinnati. Experienced Tableau Desktop and Server user for four years. Participated in the Cincinnati Tableau User Group Iron Viz.
  • 12.
    TOPICS • Data Joinsand Data Transformations • Formatting/Styling • Advance Visualizations (Graphics with Multiple Chart Combinations) • Sankey Diagrams and Slopegraphs • Dashboard Actions • Dashboard Building and Design http://community.tableau.com/thread/156218 12
  • 13.
  • 14.
    14 ThankS Don’t Forget toJoin the Cincinnati User Group Page http://community.tableau.com/groups/midwest Search for “Cincinnati Tableau User Group”