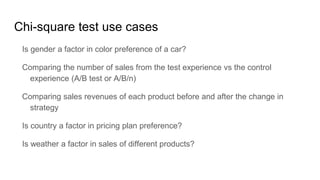
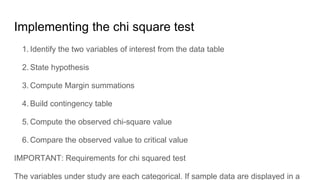
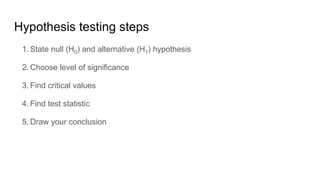
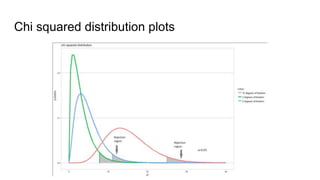
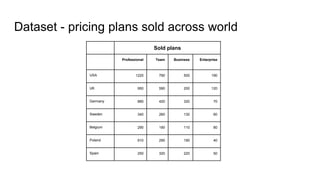
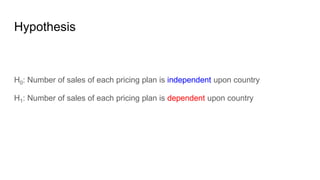
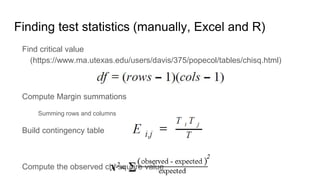
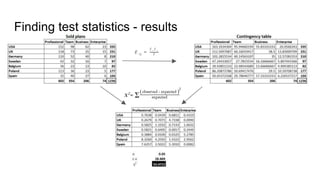
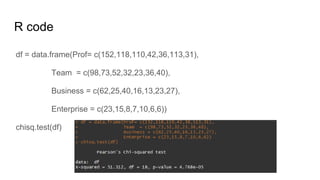
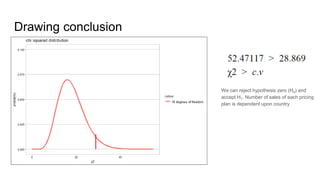
Bis 155 Exceptional Education / snaptutorial.comDavis142
For more classes visit
www.snaptutorial.com
BIS 155 Course Project Excel Project
BIS 155 Lab 1 of 7: Saddle River Marching Band
BIS 155 iLab 1 Upper Saddle
This is a Question Papers of Mumbai University for B.Sc.IT Student of Semester - V [Visual Basic – 6] (Old Syllabus). [Year - April / 2014] . . . Solution Set of this Paper is Coming soon . . .
Plan a Digital Analytics Training Strategy for an Analytics AgencyPhil Pearce
This was the 2nd draft of a plan to develop a "training curriculum" for a Digital Analytics Agency to teach:
- Digital Analytics strategy
- GA & GTM implementation
- Reporting & Analysis best practices
To clients & other agencies with various levels of expertise, who could be project manager, marketers or developers.
Morphing GA into an Affiliate Analytics MonsterPhil Pearce
How to hack GA's native campaign tracking, leverage 1st party cookie power and align GA's sessionisation logic more closely with 30 day affiliate systems.
Top 10 Google Analytics tips to save you money!Phil Pearce
I will look at 3 areas:
1. Reducing cost
2. Increasing conversions/revenue
3. Automating reducing cost & increasing revenue
Reports I will cover are:
1. Best & worse landing pages
2. Best & worse internal Site Search
3. Pages by revenue contribution
4. Broken pages by referral
5. Marketing Channels pivoted by new users
6. Simple Engagement Scoring using goal values & userId
7. 3d Motion Chart to show Revenue vs Sales vs CPA/ROI
8. Intelligent Alerts – what changed & whats broken
9. Custom Alerts – based on your business logic
10. GoogleSheets Alerts & GA embed API
Prerequisite: You will get most value from this event if you bring a laptop & have a Google Analytics account already.
Please subscribe via meet-up so I have an idea of numbers.
Thanks!
Phil.
07723012727
https://uk.linkedin.com/in/philpearce
https://twitter.com/philpearce
-----------------------------------------------------
Note: I`ll add upload the slides after then event
http://www.slideshare.net/phildpearce/lean-analytics-workshop
Phil.
My Measurecamp slides from my presentation.
Will also be writing up a blog post covering this in more details and will post updates here and in the g+ community
User-Centric Analytics (MeasureCamp Talk)Taste Medio
Why and how to focus on users, not cookies. How to identify and track users across multiple devices and data sources. Why GA User-Id sucks and how to handle that. Using tools like Identity Aggregator. Slides from MeasureCamp London 2015 talk.
How to Become a Thought Leader in Your NicheLeslie Samuel
Are bloggers thought leaders? Here are some tips on how you can become one. Provide great value, put awesome content out there on a regular basis, and help others.
At Beloved Brands, we make brands stronger and we make brand leaders smarter. We can build a Brand Management Training Program, to unleash the full potential of your team.
1. Strategic Thinking
2, Creating a Beloved Brand
3. Consumer Centricity
4. Brand Positioning
5. Brand Plans
6. Creative Briefs
7. Brand Analytics and the business review
8. Marketing Execution
9. Strategic Media Plans
10. Winning the Purchase Moment
The SlideShare 101 is a quick start guide if you want to walk through the main features that the platform offers. This will keep getting updated as new features are launched.
The SlideShare 101 replaces the earlier "SlideShare Quick Tour".
Web Analytics Project Brief: How to MOBILIZE and ENERGIZE your analytics teamRachelle Maisner
Originally presented at the eMertics Summit in Boston 2014. Download for slide notes.
In the advertising biz, nothing is more sacred than a well-written project brief. For years, great project briefs have enabled creative departments to develop award winning and effective advertising. But the brief isn’t just for creatives, or even just for agencies. Rachelle (@5ftdynamite) shows how to leverage this agency artifact for your analytics team to inspire creative, out-of-the-box analytical thinking while also driving your projects forward on-time and on-budget.
Convenience shoppingSTAT-S301Fall 2019Question Set 1.docxbobbywlane695641
Convenience shopping
STAT-S301
Fall 2019
Question Set 1
1. Get to know your scientific question (Chapter 1)
(a) Identify the variable of interest.
(b) Identify the population(s) and sample(s).
(c) Identify the parameter(s) and statistic(s).
(d) What is the scientific question? Is this Descriptive Statistics or Inferential Statistics?
2. Get to know your data (Chapter 1)
(a) Identify the types of your data: nominal data, ordinal data or quantitative data.
(b) Identify the types of your data: time series data or cross-sectional data.
(c) Identify the source of your data: primary data or secondary data. Do you think the data is
reliable? Are there possible issues with your data?
3. Calculate descriptive statistics in Excel (Chapter 3)
(a) Calculate the statistics for your variable of interest, such as sample mean (x̄), median, mode,
variance (s2), and standard deviation (s).
(b) Identify two different groups based on the qualitative data. Calculate the above statistics for
each group to compare.
4. Display your data with charts and graphs in Excel (Chapter 2)
(a) Construct displays that best describe your qualitative variable (e.g. bar chart, pie chart); and
describe the distribution.
(b) Construct displays that best describe your variable of interest and describe its distribution. (Use:
Frequency distribution tables, histograms and/or the empirical rule to discuss normality, symmetry
and skewness)
(c) Construct displays that best describe the relationship/association between two quantitative
variables (the variable of interest as the dependent variable, y, and another quantitative
variable as the independent variable, x); and describe the relationship.
5. Distributions (Chapters 5-6)
(a) Consider the distribution of your quantitative data in 4(b). Would it be appropriate to use the
Binomial or Normal distribution to model your data? Why or why not? Hint: The binomial
distribution models success/failure discrete data while the normal distribution is for bell-
shaped continuous data.
1
Question Set 2
1. Construct a confidence interval for a population mean (Chapter 8)
(a) Do you need to make assumptions in order to perform the procedure of constructing a
confidence interval? If so, what assumptions need to be made? If not, why?
(b) Construct a confidence interval for the average sales .
i. Should you use a z-interval or a t-interval? Why?
ii. Compute the necessary sample statistics for constructing a confidence interval.
iii. Find the margin of error of the confidence interval at confidence levels of 92% and 95%,
respectively.
iv. Calculate these two confidence intervals.
(c) Someone believes that the average sales is 2421 Dollars. Does the sample support the claim?
Explain if you have different conclusions using the above two confidence intervals. (You must
discuss in terms of accuracy and precision.)
2. Conduct a hypothesis test for a population mean (Chapter 9)
(a) Do you need to make assumptions in order to p.
Week 2 iLab TCO 2 — Given a simple problem, design a solutio.docxmelbruce90096
Week 2 iLab
TCO 2 — Given a simple problem, design a solution algorithm that uses arithmetic expressions and built-in functions.
Scenario
Your goal is to solve the following simple programming exercise. You have been contracted by a local antique store to design an algorithm determining the total purchases and sales tax. According to the store owner, the user will need to see the subtotal, the sales tax amount, and the total purchase amount. A customer is purchasing four items from the antique store. Design an algorithm where the user will enter the price of each of the four items. The algorithm will determine the subtotal, the sales tax, and the total purchase amount. Assume the sales tax is 7%.
Be sure to think about the logic and design first (input-process-output (IPO) chart, flowchart, and pseudocode). Display all output using currency formatting.
Advanced (optional): Use a constant for the 7% sales tax.
Rubric
Point distribution for this activity:
iLab Activity
Document
Points possible
Points received
Variable list
10
IPO chart
10
Flowchart
10
Pseudocode/C# code
10
Desk-check
10
Total Points
50
Name:_________________
(1) Variable List With Data Type
List all the variables you will use (use valid variable names). Indicate whether the data type is string, integer, or double, and so on.
(2) IPO Model
List the inputs, any processes, calculations, and outputs. Use the same valid variable names you used in Step 1.
Inputs
Process (calculations)
Outputs
(3) Flowchart
Use MS Visio to create a flowchart. Paste the flowchart here, or attach as separate document. Use the same valid variable names you used in Step 1.
(4) Pseudocode or C# Code
Describe your solution using pseudocode or actual C# code. Use the same valid variable names you selected in Step 1.
(5) Desk-Check
Desk-check your solution by selecting appropriate test data.
Test data: List the values for your test data.
Expected output: What is the expected output of your program?
Step
Variables (write variable names in first line below)
Output
Enter step numbers
1
2
3
Week 2 Activity—Game Seating Charges
TCO 2—Given a simple problem, design a solution algorithm that uses arithmetic expressions and built-in functions.
Assignment
Your goal is to solve the following simple programming exercise. You have been contracted by a local stadium to design an algorithm determining the total seating charges for any game held at the stadium. Lower-level seats cost $25 per seat, mid-level seats cost $15 per seat, and upper-level seats cost $10 per seat. The algorithm should ask the user for the number of seats being purchased in each seating level. Then, the algorithm will determine the total for each level and a grand total for the enti.
1. (TCO 1) Which of the following sets of SQL clauses represent the minimum combination of clauses to make a working SQL statement? (Points : 5)
SELECT, WHERE
FROM, WHERE
SELECT, FROM
FROM, ORDER BY
DEC215 Statistics Class work
Cover Sheet
Student Name: ……………………..………………………………………………
Student Identification Number ………………………………………………….
Course code: DEC215
Week 8 - 9: Business Decision project
Instructions:
· Complete the following report, using the results of your statistics and calculations to make business decisions.
· Use Excel to calculate the required statistical formulas.
· Submit both this paper, respective Report in the form of a Word document and the Excel file by Friday night 05/06/2020, 22h00 on E learning. Please ensure you meet this deadline as extensions will not be given.
Scenario
You have recently been employed in a large hotel chain operating in Europe. Your company own and manage a number of hotels over different classes (Economy, mid-scale, up-scale and upper upscale). You should choose a name for the hotel chain – either use an existing one that does not yet operate in Switzerland or make up your own.
The board has decided to expand into Switzerland and has tasked you with a number of assignments. Your main objective is to do some research to help them decide what type of hotel and where in Geneva to open.
In order for them to make an informed, well researched decision, you have obained data from hotels that will be in operating in the same area and possibly the same market as you. The company is wealthy and is doing well across the board but has never operated in Switzerland.
Instructions:
In all the questions you need to keep in mind your report will be read by management, so should be well organised, neat and understandable.
Collect the Excel file: Geneva Industry Stats from ELearning week 8.
Save and rename it to include your name and student number. Use this saved file to complete the tasks below.
1. Displaying the Data. Investigate the market stucture and room rates charged.
· In order to enter the market with a competitive price, you would need to do analysis on the rates charged in Geneva. Use the Sheet GVA market data. For the variable ‘Average Room Rates’, create a number of charts that will give management a clear, easy to understand overview of the rates across all classes.
· You should also analyse the market situation, and determine how the market is divided which will help decided at which class to enter.
· You may decide which chart types will make this data easiest to understand.
· Write an analysis and explain the charts [10]
2. Measures of location and spread.
Use the Sheet GVA market data . In your Excel file find the measures of location and spread for the the variable ‘Room Rates’ across all hotel classes. You will use them to help you make your business decision. In an Excel sheet summarise and show for each class the Mean, Median, Mode, Standard Deviation and Quartiles. You may also use any other statistical technique you find appropraite to show the meauses of lo.
Workshop: Your first machine learning projectAlex Austin
Tutorial to help you create your first machine learning project. The goal was to make this straightforward even someone who's never written a line of code. We gave the workshop to MBA students at UC Berkeley and had a lot of fun learning together - don't be intimidated, anyone can do it!
MATH 533 Education Specialist / snaptutorial.comMcdonaldRyan97
For more classes visit
www.snaptutorial.com
MATH 533 Week 1 Homework
MATH 533 Week 1 Quiz
MATH 533 Week 2 DQ 1 Case Let's Make a Deal
MATH 533 Week 2 Homework (2 Sets)
MATH 533 Week 2 Quiz
MATH 533 Week 3 DQ 1 Ethics in Statistics Readings and Discussion
1. What is operations management Why is it important Is a good k.docxjackiewalcutt
1. What is operations management? Why is it important? Is a good knowledge of operations management more important in service or manufacturing industries? Explain your answer.
2. Discuss the use of PERT/CPM techniques for managing projects. Describe what PERT/CPM does. Discuss advantages and disadvantages of using it. What other techniques might you choose to manage your project?
3. What are economies of scale in a manufacturing plant? Do they continue forever? What are diseconomies of scale? How might you decide the optimal size of a plant?
4. What, in your opinion are the 3 most important issues in supply chain management. Discuss why you think these are the key issues.
5. Discuss why (or if) inventories are necessary. What are the benefits of inventories? What are the disadvantages of holding inventories?
Problem Questions
1. Thermostats are subjected to rigorous testing before they are shipped to air conditioning technicians around the world. Results from the last five samples are shown in the table. Draw and R Chart and an x-bar chart. Based on the charts, is the process under control? (20 Points)
Observations
Sample12345
1
73.5
70.8
72.2
73.6
71.0
2
71.3
71.0
73.1
72.7
72.2
3
70.0
72.6
71.9
72.4
73.3
4
71.1
70.6
70.3
74.2
73.6
5
70.8
70.7
70.7
73.5
71.1
Answer 1:
2. A professor records the number of students who complain each week throughout the semester. If the class size is forty students, what are 3-sigma control limits for this class? Construct a control p-chart and interpret the data. Is the process in control? (20 points)
Week number
Complaints
1
5
2
2
3
7
4
1
5
3
6
2
7
8
8
1
9
3
10
5
11
4
12
6
13
3
14
1
15
4
Answer 2:
3. A department store chain is designing a layout for a new store. The store manager wants to provide as much convenience as possible for her customers. Based on historical data, the number of trips between departments per hour is given in the following closeness matrix. A block plan showing a preliminary layout is also shown.
Closeness Factors (Trips per hour)
1/O 2/S 3/H 4/T 5/A 6/E
1. Office Supplies (O) --- 40 100 50 20 10
2. Sporting Goods (S) --- 100 80 60 80
3. Hardware (H) --- 70 100 50
4. Toys (T) --- 70 90
5. Automotive (A) --- 60
6. Electronics (E) ---
1. OFFICE SUPPLIES
2. SPORTING GOODS
3. HARDWARE
4. TOYS
5. AUTOMOTIVE
6. ELECTRONICS
Customer travel between departments is restricted to the aisles shown in the block plan as dotted lines.
CALCULATIONS TABLE:
Dept. Pair
Closeness Factor (w)
Original Distance (dO)
w dO
Revision #1 Distance (d1)
w d1
1 – 2
1 – 3
1 – 4
1 – 5
1 – 6
2 – 3
2 – 4
2 – 5
2 – 6
3 – 4
3 – 5
3 – 6
4 – 5
4 – 6
5 – 6
TOTAL
Complete the calculations and fill in the table above. Based on the table above answer the following questions.
a) What is the total expected weighted-distance score between Office Supplies and ...
MATH 533 RANK Achievement Education--math533rank.comkopiko162
FOR MORE CLASSES VISIT
www.math533rank.com
MATH 533 Week 1 Homework
MATH 533 Week 1 Quiz
MATH 533 Week 2 DQ 1 Case Let's Make a Deal
MATH 533 Week 2 Homework (2 Sets)
MATH 533 Week 2 Quiz
Similar to Chi squared test for digital analytics (20)
Adjusting OpenMP PageRank : SHORT REPORT / NOTESSubhajit Sahu
For massive graphs that fit in RAM, but not in GPU memory, it is possible to take
advantage of a shared memory system with multiple CPUs, each with multiple cores, to
accelerate pagerank computation. If the NUMA architecture of the system is properly taken
into account with good vertex partitioning, the speedup can be significant. To take steps in
this direction, experiments are conducted to implement pagerank in OpenMP using two
different approaches, uniform and hybrid. The uniform approach runs all primitives required
for pagerank in OpenMP mode (with multiple threads). On the other hand, the hybrid
approach runs certain primitives in sequential mode (i.e., sumAt, multiply).
Adjusting primitives for graph : SHORT REPORT / NOTESSubhajit Sahu
Graph algorithms, like PageRank Compressed Sparse Row (CSR) is an adjacency-list based graph representation that is
Multiply with different modes (map)
1. Performance of sequential execution based vs OpenMP based vector multiply.
2. Comparing various launch configs for CUDA based vector multiply.
Sum with different storage types (reduce)
1. Performance of vector element sum using float vs bfloat16 as the storage type.
Sum with different modes (reduce)
1. Performance of sequential execution based vs OpenMP based vector element sum.
2. Performance of memcpy vs in-place based CUDA based vector element sum.
3. Comparing various launch configs for CUDA based vector element sum (memcpy).
4. Comparing various launch configs for CUDA based vector element sum (in-place).
Sum with in-place strategies of CUDA mode (reduce)
1. Comparing various launch configs for CUDA based vector element sum (in-place).
06-04-2024 - NYC Tech Week - Discussion on Vector Databases, Unstructured Data and AI
Discussion on Vector Databases, Unstructured Data and AI
https://www.meetup.com/unstructured-data-meetup-new-york/
This meetup is for people working in unstructured data. Speakers will come present about related topics such as vector databases, LLMs, and managing data at scale. The intended audience of this group includes roles like machine learning engineers, data scientists, data engineers, software engineers, and PMs.This meetup was formerly Milvus Meetup, and is sponsored by Zilliz maintainers of Milvus.
06-04-2024 - NYC Tech Week - Discussion on Vector Databases, Unstructured Data and AI
Round table discussion of vector databases, unstructured data, ai, big data, real-time, robots and Milvus.
A lively discussion with NJ Gen AI Meetup Lead, Prasad and Procure.FYI's Co-Found
Quantitative Data AnalysisReliability Analysis (Cronbach Alpha) Common Method...2023240532
Quantitative data Analysis
Overview
Reliability Analysis (Cronbach Alpha)
Common Method Bias (Harman Single Factor Test)
Frequency Analysis (Demographic)
Descriptive Analysis
The affect of service quality and online reviews on customer loyalty in the E...
Chi squared test for digital analytics
1. Think stats: chi square test
in digital analytics
Chi-Square Test for independence FTW!!11one
Pawel Kapuscinski
pawel@databall.co
@aliendeg
2. Chi-square test use cases
Is gender a factor in color preference of a car?
Comparing the number of sales from the test experience vs the control
experience (A/B test or A/B/n)
Comparing sales revenues of each product before and after the change in
strategy
Is country a factor in pricing plan preference?
Is weather a factor in sales of different products?
3. Implementing the chi square test
1. Identify the two variables of interest from the data table
2. State hypothesis
3. Compute Margin summations
4. Build contingency table
5. Compute the observed chi-square value
6. Compare the observed value to critical value
IMPORTANT: Requirements for chi squared test
The variables under study are each categorical. If sample data are displayed in a
4. Hypothesis testing steps
1. State null (H0) and alternative (H1) hypothesis
2. Choose level of significance
3. Find critical values
4. Find test statistic
5. Draw your conclusion
6. Dataset - pricing plans sold across world
Sold plans
Professional Team Business Enterprise
USA 1220 790 500 190
UK 950 590 200 120
Germany 880 420 320 70
Sweden 340 260 130 60
Belgium 290 190 110 80
Poland 910 290 190 40
Spain 250 320 220 50
7. Hypothesis
H0: Number of sales of each pricing plan is independent upon country
H1: Number of sales of each pricing plan is dependent upon country
8. Finding test statistics (manually, Excel and R)
Find critical value
(https://www.ma.utexas.edu/users/davis/375/popecol/tables/chisq.html)
Compute Margin summations
Summing rows and columns
Build contingency table
Compute the observed chi-square value