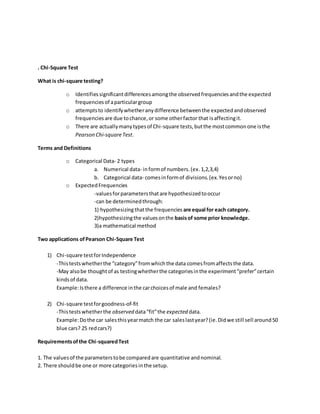
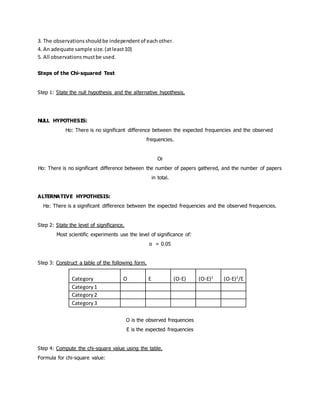
. Chi-Square Test
What is chi-square testing?
o Identifiessignificantdifferencesamongthe observedfrequenciesandthe expected
frequenciesof aparticulargroup
o attemptsto identifywhetheranydifference betweenthe expectedandobserved
frequencies are due tochance,or some otherfactor that isaffectingit.
o There are actuallymanytypesof Chi-square tests,butthe mostcommonone isthe
Pearson Chi-squareTest.
Terms and Definitions
o Categorical Data- 2 types
a. Numerical data- informof numbers.(ex.1,2,3,4)
b. Categorical data- comesinformof divisions.(ex.Yesorno)
o ExpectedFrequencies
-valuesforparametersthatare hypothesizedtooccur
-can be determinedthrough:
1) hypothesizingthatthe frequencies are equal for each category.
2)hypothesizingthe valuesonthe basisof some prior knowledge.
3)a mathematical method
Two applications ofPearson Chi-Square Test
1) Chi-square testforIndependence
-Thistestswhetherthe “category”fromwhichthe data comesfromaffectsthe data.
-May alsobe thoughtof as testingwhetherthe categoriesinthe experiment“prefer”certain
kindsof data.
Example:Isthere a difference inthe carchoicesof male and females?
2) Chi-square testforgoodness-of-fit
-Thistestswhetherthe observed data“fit”the expected data.
Example:Dothe car salesthisyearmatch the car saleslastyear?(ie.Didwe still sell around50
blue cars? 25 redcars?)
Requirementsofthe Chi-squaredTest
1. The valuesof the parameterstobe comparedare quantitative andnominal.
2. There shouldbe one or more categoriesinthe setup.
3. The observationsshouldbe independentof eachother.
4. An adequate sample size.(atleast10)
5. All observationsmustbe used.
Steps of the Chi-squared Test
Step 1: State the null hypothesis and the alternative hypothesis.
NULL HYPOTHESIS:
Ho: There is no significant difference between the expected frequencies and the observed
frequencies.
Or
Ho: There is no significant difference between the number of papers gathered, and the number of papers
in total.
ALTERNATIVE HYPOTHESIS:
Ha: There is a significant difference between the expected frequencies and the observed frequencies.
Step 2: State the level of significance.
Most scientific experiments use the level of significance of:
α = 0.05
Step 3: Construct a table of the following form.
Category O E (O-E) (O-E)2
(O-E)2
/E
Category1
Category2
Category3
O is the observed frequencies
E is the expected frequencies
Step 4: Compute the chi-square value using the table.
Formula for chi-square value:
O is the observed frequencies
E is the expected frequencies
And x2 is the chi-square value

Chi square hand out

  • 1.
    . Chi-Square Test Whatis chi-square testing? o Identifiessignificantdifferencesamongthe observedfrequenciesandthe expected frequenciesof aparticulargroup o attemptsto identifywhetheranydifference betweenthe expectedandobserved frequencies are due tochance,or some otherfactor that isaffectingit. o There are actuallymanytypesof Chi-square tests,butthe mostcommonone isthe Pearson Chi-squareTest. Terms and Definitions o Categorical Data- 2 types a. Numerical data- informof numbers.(ex.1,2,3,4) b. Categorical data- comesinformof divisions.(ex.Yesorno) o ExpectedFrequencies -valuesforparametersthatare hypothesizedtooccur -can be determinedthrough: 1) hypothesizingthatthe frequencies are equal for each category. 2)hypothesizingthe valuesonthe basisof some prior knowledge. 3)a mathematical method Two applications ofPearson Chi-Square Test 1) Chi-square testforIndependence -Thistestswhetherthe “category”fromwhichthe data comesfromaffectsthe data. -May alsobe thoughtof as testingwhetherthe categoriesinthe experiment“prefer”certain kindsof data. Example:Isthere a difference inthe carchoicesof male and females? 2) Chi-square testforgoodness-of-fit -Thistestswhetherthe observed data“fit”the expected data. Example:Dothe car salesthisyearmatch the car saleslastyear?(ie.Didwe still sell around50 blue cars? 25 redcars?) Requirementsofthe Chi-squaredTest 1. The valuesof the parameterstobe comparedare quantitative andnominal. 2. There shouldbe one or more categoriesinthe setup.
  • 2.
    3. The observationsshouldbeindependentof eachother. 4. An adequate sample size.(atleast10) 5. All observationsmustbe used. Steps of the Chi-squared Test Step 1: State the null hypothesis and the alternative hypothesis. NULL HYPOTHESIS: Ho: There is no significant difference between the expected frequencies and the observed frequencies. Or Ho: There is no significant difference between the number of papers gathered, and the number of papers in total. ALTERNATIVE HYPOTHESIS: Ha: There is a significant difference between the expected frequencies and the observed frequencies. Step 2: State the level of significance. Most scientific experiments use the level of significance of: α = 0.05 Step 3: Construct a table of the following form. Category O E (O-E) (O-E)2 (O-E)2 /E Category1 Category2 Category3 O is the observed frequencies E is the expected frequencies Step 4: Compute the chi-square value using the table. Formula for chi-square value:
  • 3.
    O is theobserved frequencies E is the expected frequencies And x2 is the chi-square value