Download to read offline

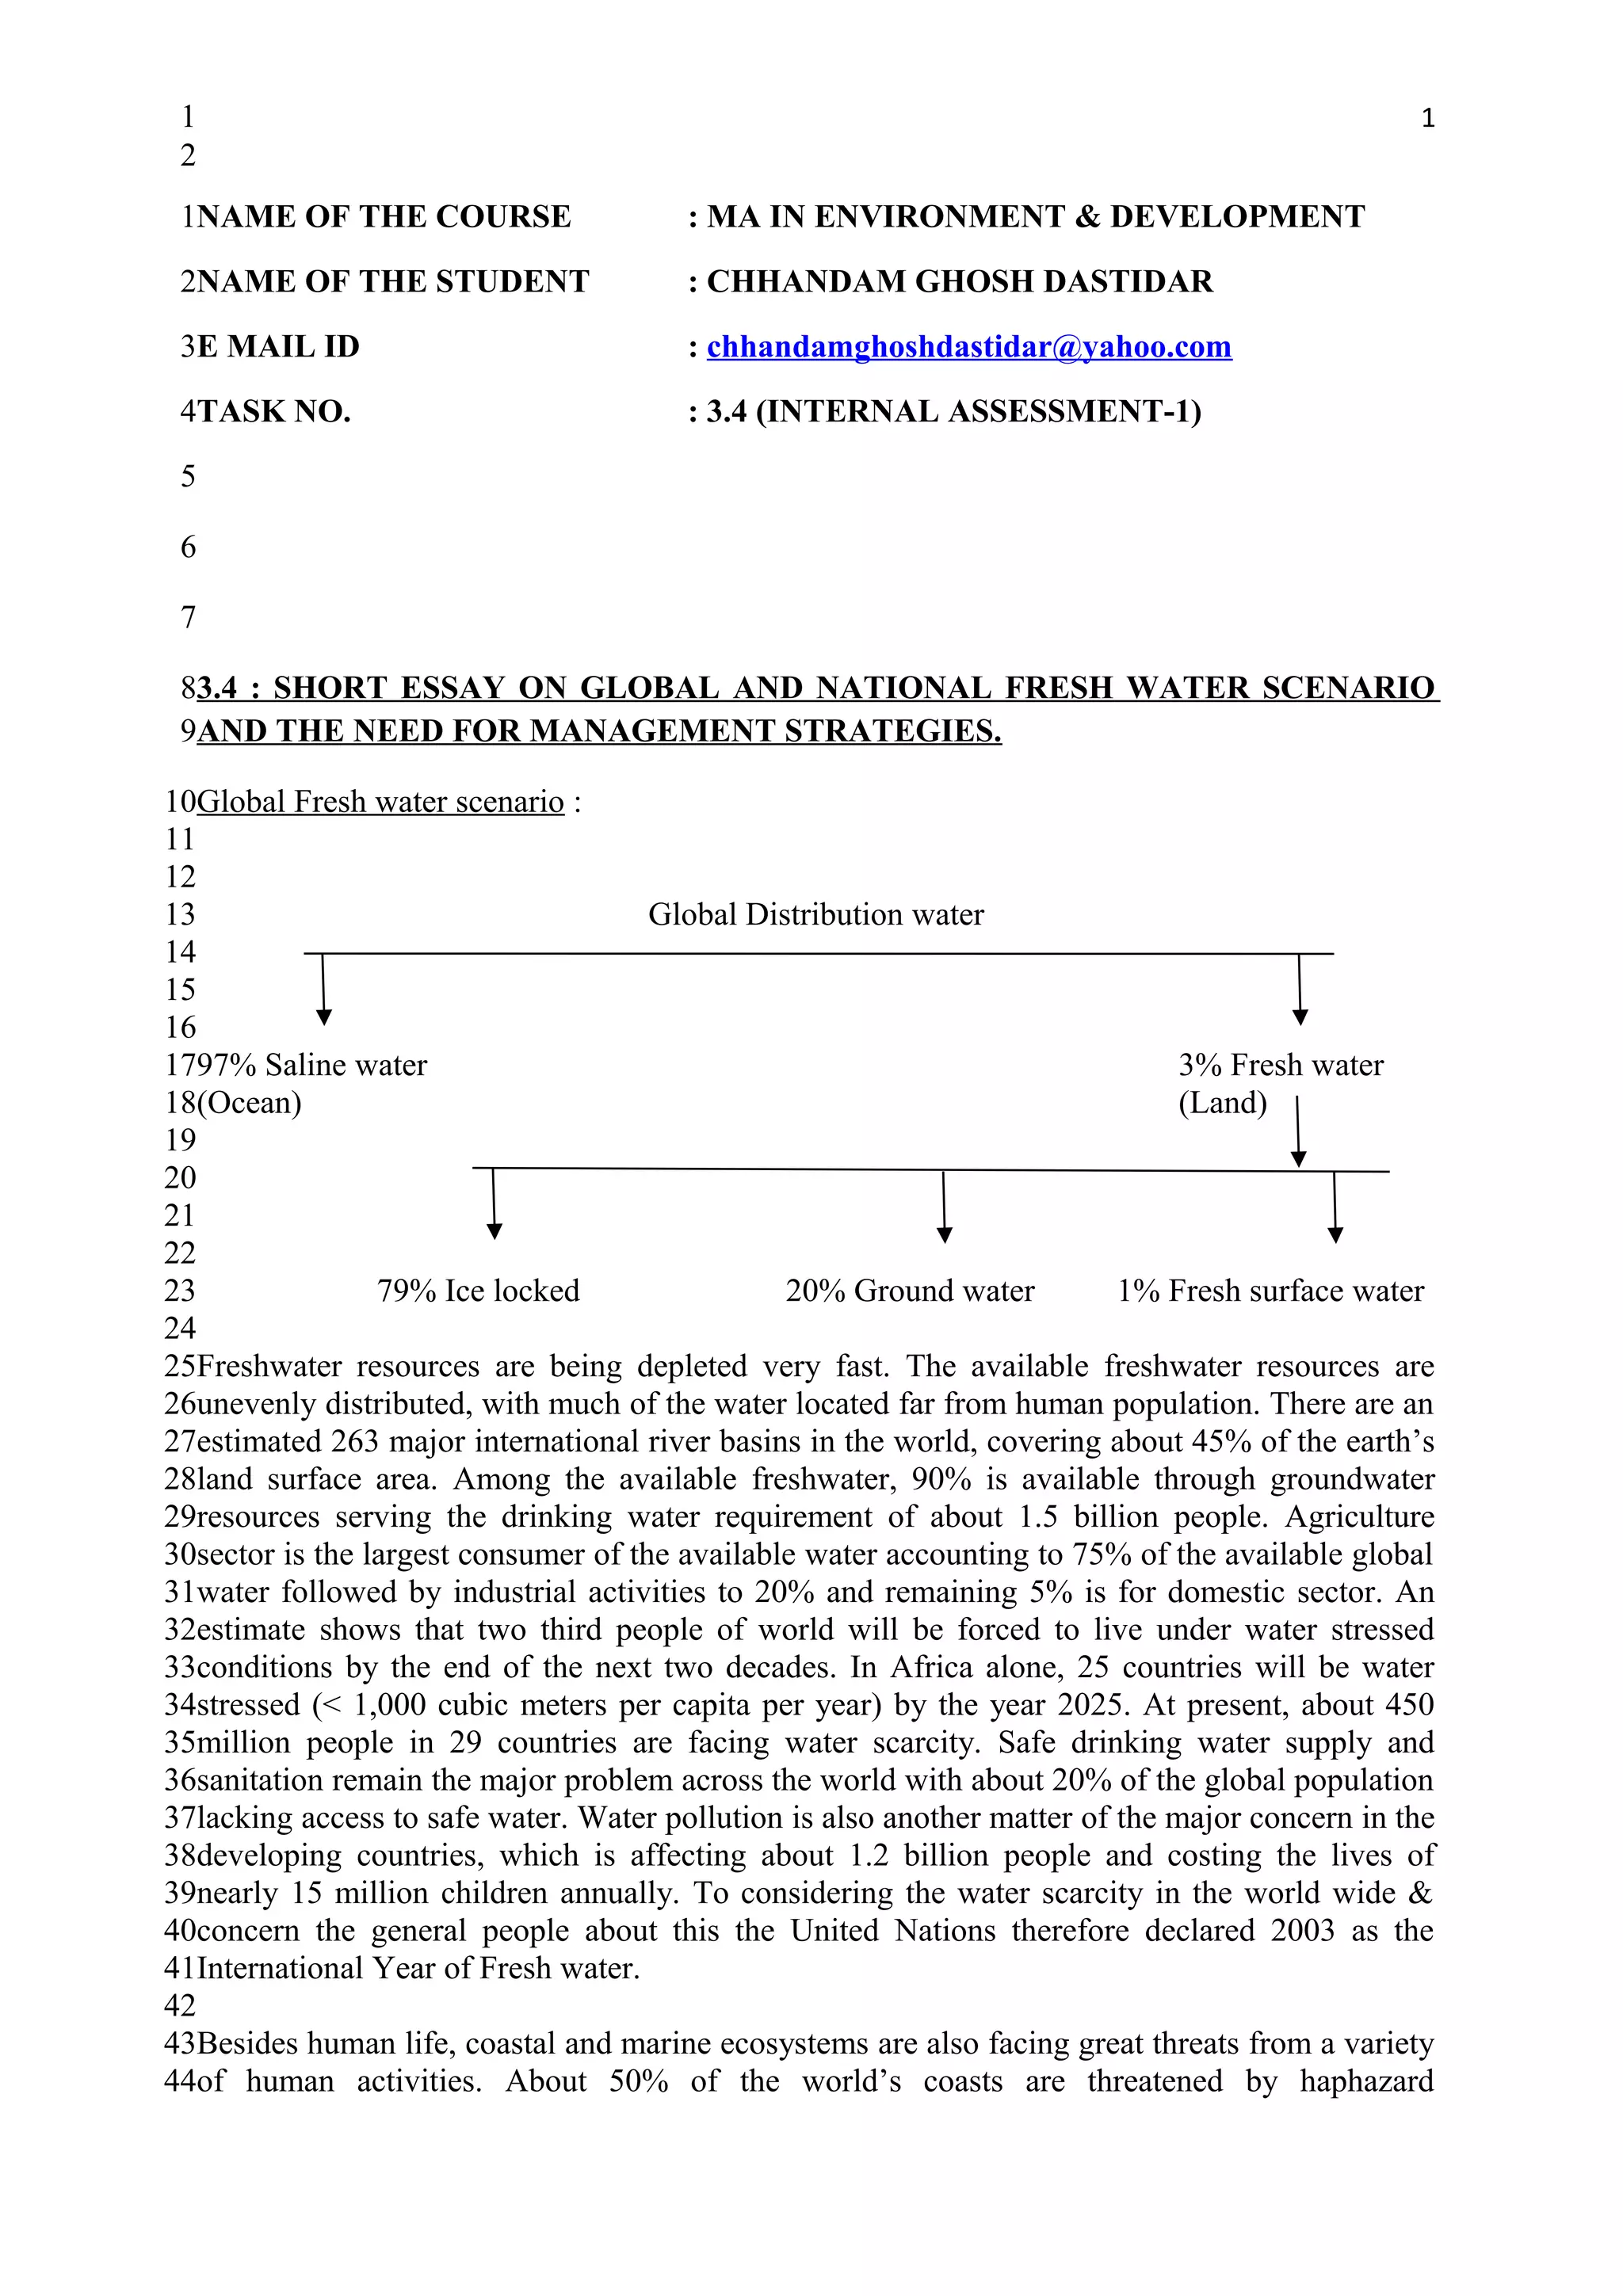
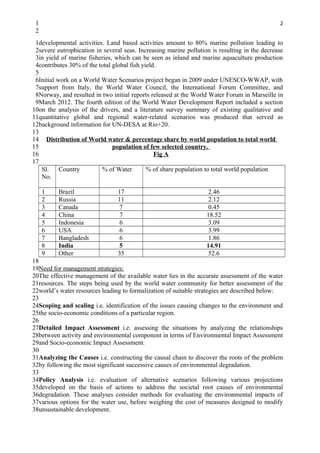
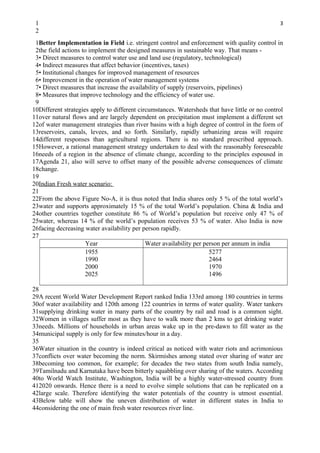
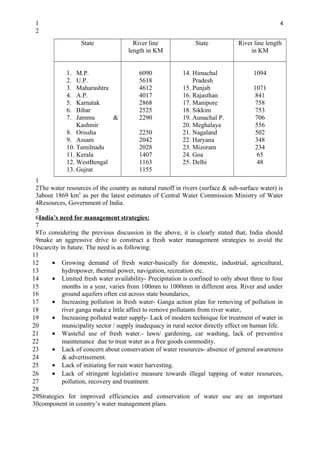


Global freshwater resources are being depleted rapidly as the available freshwater is unevenly distributed and a large portion is locked in ice or groundwater. Approximately 97% of the world's water is saline and unavailable for human use. Agriculture accounts for 75% of global water consumption while industry and domestic use account for 20% and 5% respectively. Many regions will face water stress and shortages in the coming decades if management strategies are not improved. In India, available freshwater resources are decreasing over time and unevenly distributed among states. Strategies such as water recycling, improved efficiency, conservation, and development of new sources will be needed to ensure sustainable freshwater availability.


