SlideShare a Scribd company logo
1 of 55
Download to read offline
1
Charter School Annual Report 2019
Executive Summary
North Carolina state statute requires an annual reporting of charter school performance, impact on
district schools, best practices and other factors. The North Carolina State Board of Education
(SBE), Charter Schools Advisory Board (CSAB), and Office of Charter Schools (OCS) welcome this
opportunity to reflect on the successes and challenges encountered in the charter sector over the
past year, and to chart a path towards high academic outcomes for all students as embodied in the
first two purposes of the charter legislation.
The demand for charter schools continues to grow, as evidenced by the growth in charter
enrollment. More than 110,000 North Carolina students are enrolled in charter schools, totaling
7.6% of the total public school population. Self-reported data from the state’s charter schools
indicate that 65,000 students were on waitlists for charter school admission.*
This report gives updates on charter school enrollment, academic performance, best practices, and
the impact of charter school on districts. It also highlights the benefits of our State receiving the
competitive Federal Charter School Program Grant of $26 million, and a further supplemental grant
of $10 million, over 5 years.
As the charter school movement in North Carolina continues to grow it is important to do further
analysis on the counties’ financial savings as counties do not pay for any facility costs. Charter
schools continually operate with less per pupil government funding than district schools, with capital
expenditures accounting for much of the disparity in funding. Charter school facility investments
funded outside of the county tax base is conservatively estimated at over $1 billion. Relatedly, as
district per pupil funding varies across the state, the amount of local funding per charter school
student also varies.
The North Carolina State Board of Education and the North Carolina General Assembly have each
provided critical supports to ensure accountability, oversight, and autonomy in the state’s 196
charter schools. We look forward to continued partnership to high-quality expanded choices in the
charter sector as charter schools meet measurable student achievement results through its
performance based accountability systems.
*Figure may include duplicates, as students are often waitlisted at multiple charter schools.
Deleted: 2020
Deleted: ¶
*Insert Official Title Page Here*¶
Deleted: traditional public
Deleted: This report highlights areas for charter school growth
and improvement, and provides examples of best practices
resulting from charter school operations. ¶
Deleted: Charter schools will need continued support, both in
curriculum and instruction as well as financial resources (i.e.
state transportation funding), as they work to eliminate barriers
to enrollment and to provide high-quality academic
opportunities for all students. With the funds available through
the 23.4 million federal CSP grant in conjunction with the
additional $10 million in supplemental funding offered, OCS is
confident that the number of high-quality charter schools
serving economically disadvantaged students will increase.¶
2
Table of Contents
Legislation and Historical Background................................................................................. 3
Charter School Oversight in North Carolina.......................................................................... 5
Charter School Student Enrollment....................................................................................... 8
2019 Charter Sector Growth and Sustainability.....................................................................12
2019 Legislative Updates ......................................................................................................16
Office of Charter School Updates .........................................................................................17
Charter School Academic Performance ................................................................................19
Charter School Impact on Local Districts ............................................................................46
Ensuring Autonomy and Accountability ..............................................................................50
Best Practices Resulting from Charter School Operations ...................................................52
Charter Schools Receiving Special Awards and Recognition................................................54
Appendices...........................................................................................................................55
Deleted: 11
Deleted: 15
Deleted: 16
Deleted: 18
Deleted: 44
Deleted: 48
Deleted: 50
Deleted: 52
Deleted: 53
3
Tables and Figures
Table 1. 2019 Charter School Advisory Board Members
Table 2. Office of Charter School Workflows/Responsibilities
Table 3. Charter School Student Demographics
Table 4. Charter Schools Requesting to Implement Weighted Lotteries
Table 5. Charter Schools Approved in 2018 Application Cycle
Table 6. 2019 Charter Renewals
Table 7. 2018-19 School Grades for Charter and Non-Charter Schools
Table 8. 2018-2019 Charter School Performance Grade Trends
Table 9. School Performance Grade Trends: Schools Earning a C or Higher
Table 10. School Performance Grade Trends: Charter Schools Earning a D or F
Table 11. 2018-19 Charter and Non-Charter Growth Comparison
Table 12. Number and Percentage of Schools At or Above 60% Grade Level Proficient and
College/Career Ready
Table 13. Low-Performing/Continually Low-Performing Charter School Trends
Table 14. Number of Charters Approved, Opened, Closed and Total State Funds Allotted
Table 15. LEAs with at Least 13% of Students Enrolled in Charter Schools
Table 16. SBE Districts/Regions and Total Charter Membership
Figure A. School Performance Grade Trends: Number of A & B Charter Schools Since 2014-2015
Figure B. Bar Graph of School Performance Grade Trends of Charter Schools Earning a C or
Higher Over Past Five Years
Figure C. School Performance Grade Trends: Charter Schools Earning a D or F
Figure D. School Performance Grades and the Percentage of ED Students Tested
Figure E. School Performance Grades and the Length of Time in Operation
Figure F. Charter School Growth Trends Over Past Five Years
Figure G. 2018-2019 Charter/District School Growth Status and Percentage of ED Students Tested
Figure H. Academic Growth with Economically Disadvantaged Students
Figure I. Academic Growth with English Learners
Figure J. Academic Growth with Students with Disabilities
Figure K. Academic Growth with Students of Color
Figure L. Charter School Growth Status and Length of Time in Operation
Figure M. Total Number of LP/CLP Charter Schools - Three Year Trend
Figure N. Percent of Students Scoring a Level 3 or Above on ELA EOC/EOG
Figure O. Percent of Students Scoring a Level 3 or Above on English Language Arts EOG
Figure P. Percent of Students Scoring a Level 3 or Above on English/Language Arts EOG
Figure Q. Percent of Students Scoring a Level 3 or Above on English/Language Arts EOC
Figure R. Percent of Students Scoring a Level 3 or Above on Math EOC/EOG
Figure S. Elementary School Subgroup Comparison
Figure T. Middle School Subgroup Comparison
Figure U. High School Subgroup Comparison
Figure V. Percent of Students Scoring a Level 3 or Above on Science EOC/EOG
Figure W. Elementary School Subgroup Comparison
Figure X. Middle School Subgroup Performance
Figure Y. High School Subgroup Performance
Figure Z. Percent of Students Meeting UNC 2017 ACT Benchmark
Figure AA. Percentage of Public School Students in Membership at Charter Schools
Figure AB. North Carolina State Board of Education Districts
4
Legislation and Historical Background
In 1996, the North Carolina General Assembly passed the Charter School Act, thereby authorizing
the establishment of “a system of charter schools to provide opportunities for teachers, parents,
pupils, and community members to establish and maintain schools that operate independently of
existing schools, as a method to accomplish all of the following:
1. Improve student learning;
2. Increase learning opportunities for all students, with special emphasis on expanded learning
experiences for students who are identified as at-risk of academic failure or academically
gifted;
3. Encourage the use of different and innovative teaching methods;
4. Create new professional opportunities for teachers, including the opportunity to be
responsible for the learning at the school site;
5. Provide parents and students with expanded choices in the types of educational
opportunities that are available within the public school system;
6. Hold the schools established under this Part accountable for meeting measurable student
achievement results and provide the schools with a method to change from rule-based to
performance-based accountability systems.”
Current statute sets the parameters for how the system of charter schools must operate. The law
includes the following sections:
§ Purpose of charter schools; establishment of North Carolina Charter Schools Advisory
Board and North Carolina Office of Charter Schools
§ Eligible applicants; contents of applications; submission of applications for approval
§ Opportunity to correct applications; opportunity to address Advisory Board
§ Fast-track replication of high-quality charter schools
§ Final approval of applications for charter schools
§ Review and renewal of charters
§ Material revisions of charters
§ Nonmaterial revisions of charters
§ Charter school exemptions
§ Charter school operation
§ Civil liability and insurance requirements
§ Open meetings and public records
§ Accountability; reporting requirements to State Board of Education
§ Charter school facilities
§ Charter school transportation
§ Admission requirements
§ Charter school nonsectarian
§ Nondiscrimination in charter schools
§ Student discipline
§ Driving eligibility certificates
§ General operating requirements
§ Display of the United States and North Carolina flags and the recitation of the Pledge of
Allegiance
§ Course of study requirements
§ Employment requirements
5
§ Identification of low-performing and continually low-performing schools
§ Causes for nonrenewal or termination; disputes
§ Dissolution of a charter school
§ State and local funds for a charter school
§ Notice of the charter school process; review of charter schools
§ Operation of NC Pre-K programs
Finally, G.S. 115C-218.110 directs that the State Board “shall report no annually no later than
February 15 to the Joint Legislative Education Oversight Committee on the following:
1) The current and projected impact of charter schools on the delivery of services by the public
schools.
2) Student academic progress in charter schools as measures, where available, against the
academic year immediately preceding the first academic year of the charter schools’
operation.
3) Best practices resulting from charter school operations.
4) Other information the State Board considers appropriate.”
This report addresses this legislated reporting requirement.
Charter School Oversight in North Carolina
North Carolina State Board of Education
Codified in NC General Statute as Article 14A of Chapter 115C (115C-218, et al,) the charter schools
law assigns the State Board of Education the sole authority of charter school oversight in North
Carolina, including but not limited to the approval of charter applications, the approval of material
revisions to the charter agreement, and the renewal of charter agreements.
North Carolina Charter Schools Advisory Board
In 2013, the North Carolina Charter Schools Advisory Board (CSAB) was created in statute, with
four expressed powers and duties:
A. To make recommendations to the State Board of Education on the adoption of rules
regarding all aspects of charter school operation, including timelines, standards, and criteria
for acceptance and approval of applications, monitoring of charter schools, and grounds for
revocation of charters.
B. To review applications and make recommendations to the State Board for final approval of
charter applications.
C. To make recommendations to the State Board on actions regarding a charter school,
including renewals of charters, nonrenewals of charters, and revocations of charters.
D. To undertake any other duties and responsibilities as assigned by the State Board.
The CSAB is comprised of 11 voting members; four appointed by the North Carolina Senate, four
appointed by the North Carolina House of Representatives, two appointed by the State Board of
Education, and the Lieutenant Governor or the Lieutenant Governor’s designee. The
Superintendent of Public Instruction or the Superintendent’s designee, serves as the secretary of the
board and a nonvoting member. Appointed members serve four-year terms, and are limited to
serving no more than eight consecutive years. In 2019, three new members were appointed to the
6
CSAB to fill vacant positions: Jeannette Butterworth, Joel Ford, and Rita Haire. The entire slate of
CSAB members, their date of appointment, and their term is below.
Table 1. 2019 Charter School Advisory Board Members
Appointed By
First
Name
Last Name County
Start
Date of
Current
Term
End Date
of Current
Term
Appointment
State Board of
Education Cheryl Turner Mecklenburg 2019
June 30,
2023 June 2019 SBE
State Board of
Education Alex Quigley Durham 2017
June 30,
2021 July 2017 SBE
Superintendent
- (Non-Voting) Joe Maimone Wake 2017
June 30,
2020 Superintendent
Lt. Governor Steven Walker Wake 2017
December
31, 2020
Lt. Governor
House Bruce Friend Wake 2017
June 30,
2021 SL 2018-139
House Lindalyn Kakadelis Mecklenburg 2017
June 30,
2021 SL 2017-75
House Lynn Kroeger Union 2017
June 30,
2021 SL 2017-75
House Heather Vuncannon Randolph 2019
June 30,
2023 SL 2019-122
Senate Sherry Reeves Pamlico 2017
June 30,
2021 SL 2017-75
Senate Jeannette Butterworth* Henderson 2019
June 30,
2021 SL 2018-139
Senate Rita Haire* Davidson 2017
June 30,
2021 SL 2019-233
Senate Joel Ford* Mecklenburg 2017
June 30,
2021 SL 2019-122
*Indicates board members who were appointed to fill unexpired term vacancies in 2019. Their terms
will expire in 2021.
Office of Charter Schools
N.C. General Statute 115C-218(c) stipulates the establishment of the NC Office of Charter Schools,
staffed by an executive director and additional personnel to carry out necessary duties. Pursuant to
state statute, the Office of Charter Schools has the following powers and duties:
A. Serve as staff to the Advisory Board and fulfill any tasks and duties assigned to it by the
Advisory Board.
B. Provide technical assistance and guidance to charter schools operating within the State.
C. Provide technical assistance and guidance to nonprofit corporations seeking to operate
charter schools within the State.
D. Provide or arrange for training for charter schools that have received preliminary approval
from the State Board.
Deleted: 1
7
E. Assist approved charter schools and charter schools seeking approval from the State Board
in coordinating services within the Department of Public Instruction.
1. Assist certain charter schools seeking to participate in the NC
prekindergarten program in accordance with G.S. 115C-218.115.
F. Other duties as assigned by the State Board.
The Office of Charter Schools is currently staffed by six consultants, a program assistant, and an
executive director, with office responsibilities divided into multiple workflows, each managed by an
individual consultant. The current division of workflows within the office is as follows (listed
alphabetically):
Table 2. Office of Charter School Workflows/Responsibilities
Workflow Responsibilities
1. Amendments/Risk Assessment/CSAB
Planning
Facilitates process of obtaining approval for
any modifications to a school’s charter
agreement, manages grievances and complaints
from stakeholders, conducts site visits to
schools falling out of academic, operational, or
financial compliance, and organizes CSAB and
SBE meetings.
2. Applications Facilitates the new school application process,
provides training to applicants, hires and trains
external evaluators, provides updates to CSAB
members.
3. Communications Manages all internal and external
communication between the Office of Charter
Schools and the general public.
4. Performance Framework Facilitates the yearly collection and audit of
documents from schools to ensure compliance
with NC statute, SBE policy, and the Charter
Agreement.
5. Planning Year/Ready-to-Open Process Provides training to newly approved schools
prior to opening, reviews documentation to
ensure compliance with statute, policy, and the
Charter Agreement, provides CSAB with
progress newly approved schools make towards
a successful open.
6. Professional Development Plans and provides ongoing in-person and
virtual training to currently operating schools.
7. Renewals Facilitates the charter renewal process.
In addition, OCS consultants provide general guidance and technical support to each charter school
in the state. Best practices indicate that in order to provide the highest quality oversight and support,
the ratio of charter office staff to schools should be approximately one consultant to eight schools.
North Carolina currently has 196 charter schools in operation, and the Office of Charter Schools is
staffed by six consultants, which results in a ratio of one consultant providing support to
approximately 33 schools.
8
Charter School Student Enrollment
State statute originally capped at 100 the number of charter schools that could operate in the state in
a given school year, but the N.C. General Assembly removed that ceiling in August 2011. Since then,
the number of charter schools in the state has grown from 100 to 196 (as of September 2019). 194
are brick-and-mortar charter schools operating in 67 different local education agencies, and two are
virtual charter schools. Both virtual charter schools have brick-and-mortar headquarters in Durham
county.
According to the second month Average Daily Membership (ADM) figures certified in November
2019, 116,316 students are now being served by charter schools. This represents 7.6% of the total
public school population (1,526,144).
Table 3. Charter School Student Demographics
2018-2019 School Year
Charter Traditional All
Race/Ethnicity/Gender # % # % # %
Total White 59,703 54.0% 671,727 47.3% 731,430 47.8%
Total Black 28,676 26.0% 355,201 25.0% 383,877 25.1%
Total Hispanic 11,845 10.7% 262,894 18.5% 274,739 17.9%
Other 10,240 9.3% 131,459 9.2% 141,699 9.3%
Male 55,189 50.0% 730,619 51.4% 785,808 51.3%
Female 55,275 50.0% 690,662 48.6% 745,937 48.7%
Total Enrollment 110,464 100.0% 1,421,281 100.0% 1,531,745 100.0%
A Closer Look at Racial/Ethnic Diversity in Charter Schools
N.C. General Statute 115C-218.45(e) states, “within one year after the charter school begins
operation, the charter school shall make efforts for the population of the school to reasonably
reflect the racial and ethnic composition of the general population residing within the local school
administrative unit in which the school is located or the racial and ethnic composition of the special
population that the school seeks to serve residing within the local school administrative unit in
which the school is located.”
To give appropriate insight on the extent to which charter schools reasonably reflect the areas in
which they are located, significant research would need to be conducted to disaggregate the racial
and ethnic breakdown of traditional schools and charter schools serving diverse communities within
all LEAs in the state.
Special Population Student Enrollment
Students with Disabilities
In the 2018-19 school year, charter schools enrolled 11,455 students with disabilities, which
represented 10.34% of the total charter school enrollment at that time. During the same period,
Deleted: To gain insight on the extent to which charter
schools reasonably reflect the areas in which they are located,
charter school racial demographics were compared first to the
racial demographics of the school district in which they are
located, and secondly to the racial demographics of the general
population of the county in which they are located. Because the
virtual charter schools enroll students from across the state,
they were compared to the state of North Carolina
demographics, instead of the county in which they are
headquartered. District demographic data was collected from
the Statistical Profile Online database, and geographic county
data was collected from the 2017 U.S. Census Bureau
American Community Survey. Charter schools whose
demographics were +/- 10 points of the district or county
were considered to “reasonably reflect” the comparison group.¶
¶
Charter/District Comparisons¶
White Student Enrollment¶
Out of 185 schools that were in operation last year, 47 schools
(25%) had a White student enrollment within 10% points of
the White student enrollment of the district in which the
school is located.¶
¶
When comparing White student enrollment to the non-
Hispanic White demographics of the general population, the
percentage of charter schools with an enrollment within 10%
points of the general population is 36.8% (68 schools).¶
¶
Black Student Enrollment¶
Seventy-nine schools (43%) had a Black student enrollment
within 10% points of the Black student enrollment of the local
district. ¶
¶
Seventy-seven schools (42%) had a Black, non-Hispanic
student enrollment within 10% points of the general
population of their geographic county.¶
9
district schools enrolled 176,837 students with disabilities, which represented 12.53% of total district
school enrollment (not including enrollment at DOJ, NC HHS, and NC DJJ schools).
English Learners
Based on the October 1, 2018 headcount, charter schools enrolled 3,612 English Learners, and
LEAs enrolled 112, 745 English Learners.
Economically Disadvantaged Students
It is important to note that the ED student data (collected through NCDPI Testing and
Accountability Services) is self-reported by charter schools. While charter schools do certify to
NCDPI that the numbers they report are accurate, some schools have expressed concern that since
they must ask families to self-report income information to verify ED status, the figures may
underrepresent the true ED population in a given school and across all charter schools. Charter
schools that do not participate in the National School Lunch Program, and therefore do not have
that participation rate to use as a proxy for ED status, may be most likely to report figures that
underrepresent the true ED population at their schools. Improvements to this data collection are
being implemented through the Direct Certification System.
At its December meeting, the CSAB dedicated a significant amount of time to discussing the
challenges of defining economically disadvantaged, identifying economically disadvantaged students
enrolled in charter schools, and the solutions other states have implemented to solve this issue. A
DPI official led the discussion and began by clarifying that free- and reduced-price lunch eligibility is
no longer the definition of economically disadvantaged. In terms of federal or state reporting,
economically disadvantaged is a subcategory and individual-level data is required to report this
figure. If schools are not participating in a Community Eligibility Program (CEP) or participating in
the NSLP, then they will not have that data. Even if schools ask parents to self-report that
information, self-reported data cannot be validated by DPI, which is a requirement for federal
reporting and auditing. DPI has applied for a grant for a longitudinal data study to figure out how to
calculate the economically disadvantaged population. OCS, CSAB, and DPI continue to work
together to more accurately capture the percentage of economically disadvantaged students enrolled
in charter schools, particularly those charter schools that do not participate in the National School
Lunch Program.
As of November 2019, charter schools enrolled 22,069 economically disadvantaged students, which
represents 18.8% of total charter school enrollment.
Eliminating Barriers to Access
Weighted Lotteries
The ability to conduct a weighted lottery is codified in G.S. 115C-218.45(g1). Charter schools may
not discriminate in their admissions process on the basis of race, creed, national origin, religion, or
ancestry; however, they are allowed to utilize additional controls to enroll underserved populations,
if supported by the school’s mission.
In 2018, North Carolina was awarded a federal Charter Schools Program grant to increase
educationally disadvantaged student access to high quality charter schools in the state. One
stipulation that North Carolina wrote into the grant application is that subgrantees would agree to
Deleted: traditional public
Commented [AD1]: EL headcount report only included raw
numbers – did not include total enrollment so the
percentage could not be calculated.
Moved (insertion) [1]
Deleted: Traditional public schools enrolled XX economically
disadvantaged students, which represents XX% of total
traditional public school enrollment.
Deleted: ¶
Moved up [1]: It is important to note that the ED student
data (collected through NCDPI Testing and Accountability
Services) is self-reported by charter schools. While charter
schools do certify to NCDPI that the numbers they report are
accurate, some schools have expressed concern that since they
must ask families to self-report income information to verify
ED status, the figures may underrepresent the true ED
population in a given school and across all charter schools.
Charter schools that do not participate in the National School
Lunch Program, and therefore do not have that participation
rate to use as a proxy for ED status, may be most likely to
report figures that underrepresent the true ED population at
their schools. Improvements to this data collection are being
implemented through the Direct Certification System.¶
Moved (insertion) [2]
Commented [DT3]: IMO the CSP grant context is important
here rt?
10
implement a weighted lottery. In 2019, the Office of Charter Schools saw a marked increase in the
number of schools asking to amend their charter to include the use of a weighted lottery. Prior to
2019, six charter schools requested and received permission to implement a weighted lottery. In
2019, that number increased to 21, with nine schools being approved to amend their charter to
include a weighted lottery, and six schools receiving approval to use weighted lotteries after
requesting permission in their original charter applications.
There has also been a marked increase in the number of schools including a weighted lottery in their
initial charter application. In 2017, 14 applications were approved, and only one requested the use of
a weighted lottery. In 2018, 11 applications were approved, and none requested the use of a
weighted lottery. In 2019, the first year that grant funds were available to newly approved charter
schools, fifteen applications were approved, and five schools requested the use of a weighted lottery
in the initial charter application.
The full list of schools with approval to implement weighted lotteries is below.
Table 4. Charter Schools Requesting to Implement Weighted Lotteries
School Name
Amendment/Policy
Approval
Original App or
Amendment?
Central Park School for Children Jan-13 Amendment
Community School of Davidson Mar-16 Amendment
Charlotte Lab School Jan-17 Amendment
GLOW Academy Jan-17 Amendment
Raleigh Oak Charter School Jul-18 Original App
The Exploris School Oct-18 Amendment
Moore Montessori Community School Jan-19 Amendment
Movement East Charter School May-19 Amendment
IC Imagine May-19 Amendment
Willow Oak Montessori Jul-19 Amendment
MINA Charter School of Lee County Jul-19 Amendment
Evergreen Community Charter Jul-19 Amendment
Pocosin Innovative Charter Jul-19 Amendment
Alamance Community School Oct-19 Original App
Tillery Charter Academy Nov-19 Amendment
Wake Preparatory Academy Nov-19 Amendment
East Voyager Academy Nov-19 Amendment
Hobgood Charter School Original App
North Raleigh Charter Academy Original App
Wendell Falls Charter Original App
Wilmington School of the Arts Original App
Transportation
Deleted: ¶
¶
11
N.C. General Statute 115C-218.40 states that a charter school “may provide transportation enrolled
at the school. The charter school shall develop a transportation plan so that transportation is not a
barrier to any student who resides in the local school administrative unit in which the school is
located.”
In 2017, S.L. 2017-57 appropriated $2.5 million to the Charter School Transportation Grant. Grant
awards were available to schools where 50% or more of the student population was economically
disadvantaged. These grant funds were not renewed for the following year. Providing transportation
is a costly endeavor for charter schools, and those providing transportation receive minimal financial
resources to do so. The charter schools providing transportation are often the schools with the most
racially and socioeconomically diverse student populations. The dearth of transportation funds
provided to charter schools often forces schools to make significant financial trade-offs. Adequate
transportation funding is critical to ensuring that charter schools are accessible to all students,
regardless of their ability to provide their own transportation to and from school.
As of November 2019, 98 charter schools (50% of all charter schools in the state) indicated that they
provide bus transportation for students.
61% of schools that have been open for 1-5 years provide bus transportation.
41% of schools that have been open for 6-10 years provide bus transportation.
50% of schools that have been open for 11-15 years provide bus transportation.
33% of schools that have been open for 16-20 years provide transportation.
58% of schools that have been open for 21+ years provide bus transportation.
Child Nutrition
Charter schools in North Carolina are not required to participate in the National School Lunch
Program, however, similar to the transportation plan provision, they are required to have a plan that
ensures that every child who needs lunch provided will receive a meal. During the application
interview process, the CSAB asked detailed questions about how the school will provide lunch for
all students who need it.
As of November 2019, 61 charter schools (31% of all charter schools) are participants in the
National School Lunch Program, and the remainder have alternative plans to provide lunch. Often
times, smaller charter schools find the amount of paperwork required to participate in the NSLP
prohibitive, and opt to provide lunch for students through other means.
The Francine Delaney New School for Children has been lauded for its innovative approach to
providing lunch for its students. The school has partnered with local grocers and provides a monthly
voucher to the parents of students qualifying for free or reduced priced lunch. The vouchers are
then used to buy lunch for students to bring to school.
Formatted: Font:
Deleted: .¶
¶
12
2019 Charter Sector Growth and Sustainability
2018 Charter Application Updates
During the 2018 application cycle, thirty-five applications were submitted for new charter schools-
sixteen applications were submitted for Fast-Track Replication or Acceleration. The Office of
Charter Schools screened each application for completeness, and the applicant groups with
incomplete applications were given five days to submit or clarify incomplete items. Of the thirty-five
applications submitted, six applications were withdrawn prior to receiving a recommendation from
the CSAB. Of the remaining 29 applications, fifteen received favorable recommendations from the
CSAB and were approved by the State Board of Education. Three of the fifteen schools requested
and received approval to open on an accelerated timeline. Each of the approved schools is listed
below.
Table 5. Charter Schools Approved in 2018 Application Cycle
School Name County Approved Special Request
Alamance Community School Alamance N/A
Achievement Charter Academy Harnett N/A
CE Academy Wake N/A
CFA Community Public Charter Gaston Acceleration
Doral Academy of North Carolina Wake Replication
Elaine Riddick Charter Perquimans N/A
Hobgood Charter Academy Halifax Acceleration
MINA Charter School of Lee County Lee N/A
North Raleigh Charter Academy Wake Replication
Pocosin Innovative Charter School Washington Acceleration
Revolution Academy Guilford N/A
Robert J. Brown Leadership Academy Guilford N/A
Wake Preparatory Academy Wake Replication
Wendell Falls Charter Academy Wake Replication
Wilmington School of the Arts New Hanover N/A
The three schools approved to open on an accelerated timeline successfully opened in
August/September 2019, and 11 of the 12 approved schools are in their planning year. One school,
Robert J. Brown Leadership Academy, elected to relinquish their charter prior to beginning the
planning year process.
2019 Charter Application Updates
Prior to the 2019 charter application cycle, the CSAB recommended a number of changes to the
application timeline and process to the State Board of Education. Among them, a separate, earlier
deadline for Fast-Track and Acceleration applications, and a stipulation that applications requesting
Fast-Track or Acceleration only be considered for opening on an accelerated timeline, as opposed to
being considered to open on a traditional timeline, should they not meet the requirements for Fast-
Track Replication or Acceleration. The State Board of Education approved the recommended
changes to the charter application timeline and process at its April 2019 meeting.
During the 2019 application cycle, five applications were submitted for Fast-Track Replication or
Acceleration, and fourteen applications were submitted for the Traditional timeline. Of the five
Moved up [2]: Weighted Lotteries¶
The ability to conduct a weighted lottery is codified in G.S.
115C-218.45(g1). Charter schools may not discriminate in their
admissions process on the basis of race, creed, national origin,
religion, or ancestry; however, they are allowed to utilize
additional controls to enroll underserved populations, if
supported by the school’s mission. ¶
In 2018, North Carolina was awarded a federal Charter Schools
Program grant to increase educationally disadvantaged student
access to high quality charter schools in the state. One
stipulation that North Carolina wrote into the grant application
is that subgrantees would agree to implement a weighted
lottery. In 2019, the Office of Charter Schools saw a marked
increase in the number of schools asking to amend their
charter to include the use of a weighted lottery. Prior to 2019,
six charter schools requested and received permission to
implement a weighted lottery. In 2019, that number increased
to 21, with nine schools being approved to amend their charter
to include a weighted lottery, and six schools receiving
approval to use weighted lotteries after requesting permission
in their original charter applications. The full list of schools
with approval to implement weighted lotteries is below.¶
¶
¶
¶
Table 4. Charter Schools Requesting to Implement
Weighted Lotteries¶
School Name
Deleted: ¶
¶
¶
13
applications submitted to open on an accelerated timeline, one received approval from the State
Board of Education. The CSAB has conducted a preliminary review of the fourteen applications
submitted for the Traditional timeline, and nine were invited for full interviews. The CSAB will
conduct full interviews and forward their recommendations to the SBE by their April meeting, per
SBE policy CHTR-012. The SBE will make final decisions regarding approval by August 15.
Eleven of the nineteen applications were for schools in urban districts and surrounding areas:
§ Mecklenburg County (6 applicants)
§ Wake County (2 applicants)
§ Guilford County (2 applicants)
§ Durham County (1 applicants)
Charter Application Approval Rate Trends
The charter application approval rate over the past five years has increased from 14% of applications
being approved in 2014 to 43% percent of applications being approved in 2019.
2014: 71 applications submitted; 10 approved (14% approval rate)
2015: 40 applications submitted; 14 approved (35% approval rate)
2016: 28 applications submitted; 8 approved (29% approval rate)
2017: 38 applications submitted; 14 approved (37% approval rate)
2018: 29 applications submitted; 11 approved (38% approval rate)
2019: 35 applications submitted: 15 approved (43% approval rate)
The 2019-2020 application cycle interview phase will conclude in January 2020, and the CSAB’s
preliminary recommendations will be forwarded to the SBE thereafter.
2019 Ready-to-Open Updates
In 2018-19, 16 schools participated in the Planning Year process. Two of the sixteen schools
requested a one-year delay, and were approved delay their opening until 2020. Fourteen schools
completed the Planning Year process and were deemed Ready-to-Open. These schools opened in
the fall of 2019. Of the fourteen schools that opened, ten opened with fewer than 75% of their
approved ADM. The chart contained in Appendix A outlines each of the fourteen schools that
opened, the approved year 1 maximum enrollment, the initial year 1 enrollment requested in the
charter application, the self-reported enrollment as of September 2019, the school’s breakeven
enrollment number, their actual month 1 funded ADM, and the funded percentage of the school’s
approved or amended maximum enrollment.
2019 Charter Renewal Updates
Thirty-two schools were considered for renewal in 2019. The SBE-approved renewal policy is in
Appendix B. Of the 32 schools considered for renewal, the CSAB recommended a ten-year renewal
for 21 schools, a seven-year renewal for two schools, a five-year renewal for one school, a three-year
renewal for 7 schools, and non-renewal for one school. With the exception of two schools, the SBE
accepted all of the CSAB’s recommendations. The two ALS alternative high schools were
recommended to receive 10-year renewals but were approved for 7-year renewals by the NC State
Board of Education, with the stipulation that the OCS develop a framework for evaluating the
success of schools with alternative status.
Deleted: X
Deleted: ¶
Deleted: X
14
Table 6. 2019 Charter Renewals
SBE-Approved Renewal Term School Name
10 Years American Renaissance School
Anderson Creek Academy
Cardinal Charter
Envision Science Academy
Evergreen Community
Forsyth Academy
Greensboro Academy
Invest Collegiate - Imagine
Quest Academy
Raleigh Charter High School
Research Triangle Charter
South Brunswick Charter
The Franklin School of Innovation
The Mountain Community School
Thomas Jefferson Classical Academy
Vance Charter School
Wake Forest Charter School
Wayne Preparatory Academy
Wilson Preparatory Academy
7 Years Bradford Preparatory School
Commonwealth High School (Alternative High School)
Pioneer Springs Community School
Stewart Creek High School (Alternative High School)
5 Years The Capitol Encore Academy
3 Years A.C.E. Academy
Carter Community Charter
Dillard Academy
Haliwa-Saponi Tribal School
Lakeside Charter Academy
Reaching All Minds Academy
United Community Charter
Non-Renewal Charlotte Learning Academy
2020 Charter Renewal Updates
Nineteen schools are being considered for renewal in 2020. The CSAB voted on renewal
recommendations for each school in December 2019, and their recommendations will be forwarded
to the SBE in January 2020.
Charter School Closure and Relinquishment Updates
Due to low academic performance, Charlotte Learning Academy was recommended for a
nonrenewal of its charter and closed effective June 30, 2019.
The non-profit board operating Hope Charter Academy voted to relinquish their charter effective
June 30, 2019.
15
Anson Charter requested a second delay and was denied by the CSAB. The school’s governing
board subsequently voted to relinquish their charter, and the SBE approved the relinquishment at its
April 2019 meeting.
16
2019 Legislative Updates
S.L. 2019-51: Created a term “public school unit” in Chapter 115C to include all types of public
schools in the state, including charter schools.
S.L. 2019-82: Amended G.S. 115C-218.85(a) and now requires charter schools to provide financial
literacy instruction as required by the State Board of Education, including required professional
development for teachers of the financial literacy course.
S.L. 2019-122: Appointed Joel Ford to the Charter School Advisory Board to fill the unexpired term
of Alan Hawkes, and re-appointed Heather Vuncannon for another full term.
S.L. 2019-165: Made various changes to laws related to education. Officially changed the reporting
date for the annual charter school report to February 15.
S.L. 2019-222: Appropriated funds for school safety. School resource officer grants are to be made
available to qualifying school units – including charter schools – to improve school safety.
S.L. 2019-71: Modified teacher licensure requirements.
S.L. 2019-154: Adopted a 15-point scale in the determination of school performance grades.
17
Office of Charter School Updates
NC ACCESS Grant
In 2018, the North Carolina Department of Public Instruction (NCDPI) was awarded a Public
Charter Schools Program (CSP) grant from the U.S. Department of Education (USDOE) of
approximately $26,600,000. The CSP grant is currently being used to implement the North Carolina
Advancing Charter Collaboration and Excellence for Student Success (NC ACCESS) Program to:
1. Increase the number of educationally disadvantaged students attending high-quality charter
schools and expand the number of high-quality charter schools available to educationally
disadvantaged students;
2. Develop a cohort of one hundred (100) charter school leaders who can develop and
demonstrate best practices in serving educationally disadvantaged students; and
3. Broadly disseminate best practices in serving educationally disadvantaged students and foster
collaboration in the charter school community and between charter schools and district
schools.
NC ACCESS Progress to Date:
1. ACCESS team has been fully staffed and consists of a Grant Administrator, Program
Coordinator, Technical Assistance Specialist, and Finance Administrator.
2. Nine subgrants, totaling $3.4 million, were awarded in the first application cycle. This
includes three Planning and Implementation subgrants, four Implementation subgrants, and
one Expansion subgrant.
3. ACCESS Fellowship was launched. Four workshops have been held; three in-person and
one virtual. Topics covered include school culture and design, parent and community
engagement, leadership and empowering teacher leaders, intentional marketing and
recruitment, and addressing adverse childhood experiences and the socioemotional learning
needs of students.
4. ACCESS team applied for and received $10 million supplemental grant to further expand
the reach of the program, and to support low-performing charter schools across the state.
Team will now be able to award 10 additional subgrants (60 instead of 50) over the life of
the CSP grant.
5. ACCESS team is piloting a Visiting Fellows program for leaders of low-performing schools.
These leaders will participate in the ACCESS fellowship and have access to all resources and
support provided through that initiative.
6. ACCESS team received approval to expand the eligibility criteria to better serve schools and
to expand the reach of the program.
Epicenter
S.L. 2017-57 mandated that funds be used to support the purchase of a Web-based
electronic records and data management system to automate and streamline reporting and
accountability requirements to assist the Office of Charter Schools in complying with annual
reporting obligations. OCS has adopted Epicenter for this purpose and has worked with
representatives from the National Charter Schools Institute to train school leaders on the use of the
platform. Over the past year, each workflow within OCS has transitioned to the Epicenter platform.
All charter-related documents are now submitted or collected via the Epicenter portal. OCS
Deleted: traditional public
18
consultants are working with multiple divisions within NCDPI that have expressed interest in also
collecting and reviewing documentation through Epicenter.
Professional Development
The Office of Charter Schools continues to welcome feedback in order to better serve the
professional learning needs of the charter school community and its stakeholders. Some of the
opportunities this year included:
• Office of Charter Schools Huddle West, July 2019 at Gray Stone Day School;
• Office of Charter Schools Charter School Leadership Institute, October 17 & 18, 2019, at
Envision Science Academy;
• Leading & Learning Day (formerly known as LP/CLP training), September 26, 2019, at
Healthy Start Academy, Durham;
• For Counselors By Counselors: A network of support and professional learning for NC charter
school counselors. This collaborative cohort works to unify knowledge and offer superior
counselor support to students in our charter network;
• Quick Takes: 15 minute pre-recorded webinars in topics of interest to the charter community;
• Online professional development and renewal newsletters, through S’more have been very
well received and widely read;
• Increased collaboration and professional learning within and across NC DPI divisions;
• Number of Twitter/Social Media followers has increased and professional learning is
actively promoted on our Twitter feed;
• Epicenter is now being used as a resource for professional learning as well through an
application called OCS Professional Learning Resource Center, which will serve as a ‘library’ of
professional learning resources;
• Charter School Teacher of the Year is Ms. Ashley Bailey of Roxboro Community School;
• NCCAT inaugural Beginning Teacher of the Year award had three (3) charter school
teachers in the running for Beginning Teacher of the Year.
19
Charter School Academic Performance
The sixth legislative purpose of charter schools outlined in G.S. 225C-218 is to “hold schools
established under this Part accountable for meeting measurable student achievement results and
provide the schools with a method to change from rule-based to performance-based accountability
systems.” This section of the Annual Report examines the student achievement results of North
Carolina’s charter schools. Please note that this reporting includes data from North Carolina’s two
virtual charter schools, which are both currently in pilot status.
With the exception of schools operating under an alternative status, all public schools are assigned
School Performance Grades (A-F) based on test scores, and for high schools, additional indicators
that measure college and career readiness. School Performance Grades are based on student
proficiency (80%) and growth (20%).
Table 7. 2018-19 School Grades for Charter and Non-Charter Schools
Charter Non-Charter All
Grade # % # % # %
A 20 11% 183 7% 203 8%
B 59 32% 686 28% 745 29%
C 53 29% 991 40% 1044 41%
D 34 18% 426 17% 459 18%
F 12 7% 79 3% 89 4%
I 2 1% 12 1% 14 1%
N/A 0 N/A 3 .1% 3 .1%
Alternative 4 2% 90 4% 94 4%
Total A-F 178 97% 2362 96% 2540
Total A
and B
79 44% 869 37% 948 37%
Total D
and F
46 26% 502 21% 548 22%
Total
Schools
184 2467 2651
A “Closer Look” at Charter School Academic Proficiency and Growth
The chart below depicts trends in charter school SPGs over the past five years. The percentage of
charter schools earning Ds and Fs increased slightly from 2017-18 to 2018-19. The percentage of
charter schools earning As and Bs also increased over the past year.
20
Table 8. 2018-2019 Charter School Performance Grade Trends
2014 – 15 2015 – 16 2016 – 17 2017 - 18 2018-19
Grade # % # % # % # % # %
A+NG
12 8.5% 12 7.7% 11 6.7%
A 7 4.9% 5 3.2% 5 3.1% 15 8.9% 20 11%
B 50 35.2% 45 29.0% 55 33.7% 55 32.7% 59 32%
C 31 21.8% 50 32.3% 51 31.3% 60 35.7% 53 29%
D 24 16.9% 29 18.7% 28 17.2% 29 17.4% 34 18%
F 18 12.7% 14 9.0% 13 8.0% 8 4.8% 12 7%
Total 142 155 163 167 178
Figure A below depicts the charter school performance grade trends since 2014-2015. Table 9
presents the trends in charter schools earning a grade of C or higher over the past five years. This
percentage was on the rise from 2014-15 until the most recent year, when the percentage of charter
schools earning a C or higher decreased 6.1 percentage points. Figure B visually depicts the trends of
charter schools earning a C or higher over the past five years. Table 10 contains the percentages of
charter schools earning grades of D or F over the past five years, and Figure C visually depicts this
trend.
Formatted: Keep with next, Keep lines together
21
Figure A. School Performance Grade Trends: Number of A & B Charter Schools Since 2014-
2015
Table 9. School Performance Grade Trends: Schools Earning a C or Higher
2014 – 15 2015 – 16 2016 – 17 2017 – 18 2018-19
Percentage of C or
Better Charter Schools
70.4% 72.3% 74.8% 77.8% 71.7%
7
5 5
15
20
50
45
55 55
59
14-15 15-16 16-17 17-18 18-19A B
Formatted: Keep with next, Keep lines together
22
Figure B. Bar Graph of School Performance Grade Trends of Charter Schools
Earning a C or Higher Over Past Five Years
Table 10. School Performance Grade Trends: Charter Schools Earning a D or F
2014 – 15 2015 – 16 2016 – 17 2017 – 18 2018-19
Percentage of D and
F Charter Schools
29.6% 27.7% 25.2% 22.2% 25%
Figure C. School Performance Grade Trends: Charter Schools Earning a D or F
70.4
72.3
74.8
77.8
71.7
14-15 15-16 16-17 17-18 18-19
29.6
27.7
25.2
22.2
25
14-15 15-16 16-17 17-18 18-19
23
Additional Context for Charter School Performance Grades
As discussed previously, school performance grades are based on a formula of 80% proficiency and
20% growth. To provide additional context around charter school performance, the next several
graphs describe the percentage of economically disadvantaged students tested at charter schools
earning school performance grades, as well as the average length of time charter schools earning
school performance grades have been in operation.
School Performance Grades and Economically Disadvantaged Students
Figure D depicts the total number of charter schools receiving A-F letter grades. Within each bar,
color-coded sections indicate the percentage of economically disadvantaged students tested at each
school earning a particular letter grade. At the bottom of the graph is a key outlining the percentage
of ED students each color represents.
Figure D. School Performance Grades and the Percentage of ED Students Tested
Of the 20 charter schools earning an A in 2018-2019, 19 (95%) served 20% or fewer economically
disadvantaged students. Within this 19 schools, thirteen served student populations that were fewer
than 5% EDS. Southeastern Academy served the largest percentage of ED students of all charter
schools earning an A, at 39.3% EDS.
9%
0%
51%
1%
78%
9%
95%
39%
17%
15%
3%
21%
11%
17%
41%
5%
36%
33%
16%
29%
30%
6%
50%
3%
38%
22%
42%
56%
35%
51%
21%
35%
2%
11%
3%
8%
28%
12%
15%
2%
4%
1%
0% 10% 20% 30% 40% 50% 60% 70% 80% 90% 100%
F (CS)
F (DS)
D (CS)
D (DS)
C (CS)
C (DS)
B (CS)
B (DS)
A (CS)
A (DS)
Percentage of Schools
SchoolPerformanceGradeReceived
0-20% EDS 20.1-40% EDS 40.1-60% EDS 60.1-80% EDS 80.1-100% EDS
Deleted:
19
46
1
10
2
1
0%
10%
20%
30%
40%
50%
60%
70%
80%
90%
100%
A B
PercentageofSchools
School Perfo
0-20% EDS 21-40% EDS
24
Of the 183 district schools earning an A in 2018-2019, 72 (39%) served 20% or fewer economically
disadvantaged students; 65 (36%) served 20.1-40% EDS; 40 (22%) served 40.1-60% EDS; 5 (3%)
served 60.1-80% EDS; and 1 (.5%) served greater than 80% EDS.
Of the 59 charter schools earning a B, 46 (or approximately 78%) served student populations that
were 20% or fewer EDS. Ten of the 59 schools served between 20.1 – 40% EDS, and three served
greater than 40% EDS (Alpha Academy – 49.3%, Bethel Hill Charter – 44%, and Sallie B. Howard –
61.1%).
Of the 686 district schools earning a B, 64 (9%) served 20% or fewer EDS; 282 (41%) served 20.1-
40% EDS; 262 (38%) served 40.1-60% EDS; and 78 (11%) served 60.1-80% EDS.
Of the 53 charter schools earning a C, 27 (51%) served 20% or fewer EDS. Eleven schools (21%)
served between 20.1 – 40% EDS, 3 (6%) served between 40.1 – 60% EDS, and 11 (21%) served
between 60.1 – 80% EDS. One school, Maureen Joy Charter, served greater than 80% ED students,
with an ED population of at least 95%.
Of the 991 district schools earning a C, 6 (.6%) served 20% or fewer EDS; 107 (11%) served 20.1-
40% EDS; 491 (50%) served 40.1-60% EDS; 345 (35%) served 60.1-80% EDS; and 42 (4%) served
greater than 80% EDS.
Of the 34 charter schools earning a D, three (10%) served 20% or fewer EDS. Five schools (15%)
served between 20.1 – 40% EDS, and ten (29%) served between 40.1 – 60% EDS. Twelve schools
(35%) served between 60.1 – 80% EDS, and four schools (12%) served greater than 80% EDS.
Of the 426 district schools earning a D; 2 (.5%) served 20% or fewer EDS; 14 (3%) served 20.1 –
40% EDS; 129 (30%) served 40.1 – 60% EDS; 218 (51%) served 60.1 – 80% EDS; and 63 (15%)
served greater than 80% EDS.
Of the twelve charter schools earning an F, two (17%) schools served 20.1 – 40% EDS, four
schools (33%) served 40.1 – 60% EDS, five schools tested 61 – 80% EDS, and one school (8%)
served greater than 80% EDS.
Of the 79 district schools earning an F, 13 (16%) served 40.1 – 60% EDS; 44 (56%) served 60.1 –
80% EDS; and 22 (28%) served greater than 80% EDS.
School Performance Grades and Length of Time in Operation
The bar graph in Figure E depicts the number of schools earning grades A-F and contains color-
coding to identify the length of time schools earning each particular grade have been in operation.
Deleted: Twenty charter schools earned an A in 2018-2019, as
shown in the first column in the graph above. Of those twenty
schools, nineteen (95%) tested between 0-20% economically
disadvantaged students. For example, School A earned an A
letter grade, and is one of the 19 schools that tested between 0-
20% economically disadvantaged students. If School A tested
100 students, between 0-20 of the tested students were
identified as economically disadvantaged. ¶
¶
Within the 0-20% EDS category of schools earning an A,
thirteen of the nineteen schools tested student populations that
were fewer than 5% EDS. Southeastern Academy tested the
largest percentage of ED students of all schools earning an A,
at 39.3% EDS.¶
¶
Of the 59 charter schools earning a B, 46 (or approximately
78%) tested student populations that were between 0 – 20%
EDS. Ten of the 59 schools tested between 20.5 – 40% EDS,
and three tested greater than 40% EDS (Alpha Academy –
49.3%, Bethel Hill Charter – 44%, and Sallie B. Howard –
61.1%).¶
¶
Of the 53 charter schools earning a C, 27 (51%) tested between
0 – 20% EDS. Eleven schools (21%) tested between 20.5 –
40% EDS, four tested between 40.5 – 60% EDS, and ten
tested between 60.5 – 80% EDS. One school, Maureen Joy
Charter, tested greater than 80% ED students, with an ED
population of at least 95%.¶
¶
Of the 34 charter schools earning a D, three (10%) tested
between 0 – 20% EDS. Five schools tested between 20.5 –
40% EDS, and ten (29%) tested between 40.5 – 60% EDS.
Four schools (12%) tested greater than 80% EDS, and twelve
schools (35%) served between 60.5 – 80% EDS.¶
¶
¶
On the far right of the chart is the bar depicting the number of
schools that earned an F letter grade. Of the twelve schools
earning an F, none of them tested between 0-20% EDS. Two
schools tested 21-40% EDS, four schools tested 41-60% EDS,
five schools tested 61-80% EDS, and one school tested 80-
100% EDS.¶
¶
Formatted: Font:
25
Figure E. School Performance Grades and the Length of Time in Operation
Of the twenty schools earning an A, four (20%) have been in operation for 1-5 years, four (20%)
have been in operation for 6-10 years, and twelve (65%) have been in operation for 11 years or
more.
Of the 59 schools earning a B, 37 schools (64%) have been in operation for 11 years or more. Eight
of the 59 (3%) have been in operation for 1-5 years, and 14 of the 59 (32% have been in operation
for 6-10 years.
Of the 53 schools earning a C, 26 (49) have been in operation for 1-5 years, six (11%) have been in
operation for 6-10 years, four (8%) have been in operation for 11-15 years, 11 (21%) have been in
operation for 16-20 years, and 6 (11%) have been in operation for 21 years or more.
Of the 34 schools earning a D, sixteen (47%) have been in operation for 1-5 years. Six (18%)
schools earning a D have been in operation for 6-10 years, two (6%) have been in operation for 11-
15 years, seven (21%) have been in operation for 16-20 years, and 3 (9%) have been in operation for
21 years or more.
Of the 12 schools earning an F, 6 (50%) have been open for 1-5 years, 3 (25%) have been open 6-10
years, and 3 (25%) have been open for 21 years or more.
2018-2019 Charter School Academic Growth
The section below examines charter school growth compared to non-charter schools, charter school
growth trends over the past five years, the demographics of charter schools compared to their
growth scores, and growth scores in comparison to the length of time schools have been in
operation.
4
8
26
16
6
4
14
6
6
32
7
4
2
0
8
24 11
7
0
2
6
6
3
3
0
10
20
30
40
50
60
A B C D F
NumberofSchools
School Performance Grade Received
1-5 Years 6-10 Years 11-15 Years 16-20 Years 21+ Years
Formatted: Keep with next, Keep lines together
26
In a comparison of charter and non-charter academic growth, more non-charters met and exceeded
growth in 2018-2019 than did charters. 69.4% of charter schools met or exceeded growth whereas
73.6% of district schools met or exceeded growth. A higher percentage of charters failed to meet
growth (30.2%) compared to non-charter schools (26.5%). However, as Figure F shows, the
percentage of charter schools meeting or exceeding growth increased from 2017-18 to 2018-19,
breaking a four-year slide in growth scores.
Table 11. 2018-19 Charter and Non-Charter Growth Comparison
Charter Non-Charter All
Growth
Status
# % # % # %
Exceeded 48 26.8% 647 27.4% 695 27.3%
Met 77 43% 1095 46.2% 1172 46%
Not Met 54 30.2% 627 26.5% 681 26.7%
*May not equal 184. Alternative schools and those with insufficient data did not receive a growth
score.
Figure F. Charter School Growth Trends Over Past Five Years
School Growth Status Compared to Percentage of ED Students Tested
Figure G illustrates the growth status achieved by North Carolina’s charter schools and the
percentage of economically disadvantaged students tested at each school.
73.40%
70.40% 70.10%
68.50%
70%
66.00%
68.00%
70.00%
72.00%
74.00%
2014-15 2015-16 2016-17 2017-18 2018-19
Percent Meeting or Exceeding Growth
Deleted: traditional public
Deleted: 4
Commented [DA5]: Question for Ashley – the percentage
of charters meeting/exceeding growth in the table above
doesn’t match the figures in this graph. Can you confirm
that the 70% is correct?
27
Figure G. 2018-2019 Charter/District School Growth Status and Percentage of ED Students
Served
Of the 54 charter schools that did not meet growth, 30 schools (56%) served 20% or fewer EDS;
eight (15%) served between 21-40% EDS; six (11%) served between 41-60% EDS, seven (13%)
served between 61-80% EDS, and three (6%) served greater than 80% EDS.
Of the 627 district schools that did not meet growth, 28 (4%) served fewer than 20% EDS; 87
(14%) served 20.1-40% EDS; 243 (39%) served 40.1-60% EDS; 216 (34%) served 60.1-80% EDS;
and 53 (8%) served greater than 80% EDS.
Of the 77 charter schools that met growth, 34 schools (44%) served 20% or fewer EDS; 19 (25%)
served 21-40% EDS; nine (12%) served 41-60% EDS; 12 (16%) served 61-80% EDS; and three
(4%) served greater than 80% EDS.
Of the 1095 district schools that met growth, 57 (5%) served 20% or fewer EDS; 218 (20%) served
20.1-40% EDS; 436 (40%) served 40.1-60% EDS; 330 (30%) served 60.1-80% EDS; and 54 (5%)
served greater than 80% EDS.
Of the 48 charter schools that exceeded growth, 31 schools (65%) served 20% or fewer EDS; 3
(6%) served 21-40% EDS; 3 (6%) served 41-60% EDS; and 11 (23%) served 61-80% EDS.
Of the 647 district schools that exceeded growth, 56 (9%) served 20% or fewer EDS; 155 (24%)
served 20.1-40% EDS; 251 (39%) served 40.1-60% EDS; 156 (34%) served 60.1-80% EDS; and 29
(22.1%) served greater than 80% EDS.
9%
65%
5%
44%
4%
56%
24%
6%
20%
25%
14%
15%
39%
6%
40%
12%
39%
11%
24%
23%
30%
16%
34%
13%
4%
0%
5%
4%
8%
6%
0% 10% 20% 30% 40% 50% 60% 70% 80% 90% 100%
Exceeded (District)
Exceeded (Charter)
Met (District)
Met (Charter)
Not Met (District)
Not Met (Charter)
Percent EDS
0-20% 20.1-40% 40.1-60% 60.1-80% 80.1-100%
Formatted: Keep with next, Keep lines together
Deleted:
Deleted: Tested
Deleted:
31
3
4
10
0
10
20
30
40
50
60
70
80
Exceeded
0-20% 21-40%
28
High Academic Growth with Disadvantaged Student Populations
One of the six legislative purposes of charter schools in North Carolina is to increase
learning opportunities for all students, particularly those who are identified as at-risk of academic
failure. One measure of excellence for charter schools is achieving high academic growth with a
student population that is economically disadvantaged. The figure below illustrates the growth index
achieved by each school compared to the percentage of economically disadvantaged students who
were assessed in EOC or EOG assessments in 2018-2019.
It is important to note that the ED% in the chart below is reflective of the percentage of
economically disadvantaged students in tested grades only as opposed to the school as a whole.
Further, because charter schools are not required to participate in the National School Lunch
Program, there is no standard manner in which to accurately capture the EE student population
enrolled in charter schools. This may result in ED populations being largely underreported amongst
charter schools.
Figure H. Academic Growth with Economically Disadvantaged Students
Based on this data, five schools had an ED population (in tested grades) of at least 70% and
exceeded growth by achieving an EVAAS growth score of greater than +2:
• Wilmington Preparatory Academy (81.01% ED in tested grades; +2.66 growth score)
• Sugar Creek Charter (79.31% ED in tested grades; +3.29 growth score)
• CIS Academy (76.67% ED in tested grades; +3.75 growth score)
• PreEminent Charter (74.36% ED in tested grades; +8.38 growth score)
• Healthy Start Academy (71.03% ED in tested grades; +5.6 growth score)
Deleted: Of the 48 schools that exceeded growth, 31 schools
(65%) tested fewer than 20% EDS; 3 (6%) tested 21-40%
EDS; 4 (8%) tested 41-60% EDS; and ten (21%) tested 61-
80% EDS.¶
Of the 73 that met growth, 32 schools (44%) tested between 0
– 20% EDS; 18 (25%) tested 21-40% EDS; nine (12%) tested
41-60% EDS; 11 (15%) tested 61-80% EDS; and three (4%)
tested greater than 80% EDS. ¶
¶
Of the 54 schools that did not meet growth, 30 schools (56%)
tested between 0 – 20% EDS; eight (15%) tested between 21-
40% EDS; six (11%) tested between 41-60% EDS, seven
(13%) tested between 61-80% EDS, and three (6%) tested
greater than 80% EDS.¶
¶
¶
Formatted: Keep with next, Keep lines together
29
KIPP Durham College Preparatory nearly met the 70% ED and +2 growth score threshold; the
school had 69.9% ED students in tested grades and earned a +3.9 growth score.
Academic Growth with English Learners
The figure below illustrates the growth index achieved by each school compared to the percentage
of English Learners who were assessed in EOG or EOC assessments in 2018-2019.
Based on this data, four schools had a tested EL population of at least 25% and exceeded growth by
achieving an EVAAS score of greater than +2:
• KIPP Durham College Preparatory (38.6% EL tested population; +3.9 growth score)
• Torchlight Academy (31.02% EL tested population; +5.14 growth score)
• Healthy Start Academy (28.17% EL tested population; +5.6 growth score)
• Sallie B. Howard School of the Arts (25.82% EL tested population; +4.55 growth score)
Figure I. Academic Growth with English Learners
Academic Growth with Students with Disabilities
The figure below illustrates the growth index achieved by each school compared to the percentage
of students with disabilities who were assessed in EOG or EOC assessments in 2018-2019.
Based on this data, eight schools had a tested SWD population of at least 15% and exceeded growth
by achieving an EVAAS score of greater than +2:
• Arapahoe Charter School (18.02% SWD tested population; +3.56 growth score)
• CIS Academy (16.67% SWD tested population; +3.75 growth score)
• Island Montessori Charter School (20.29% SWD tested population; +3.59 growth score)
Formatted: Left
Deleted: ¶
¶
¶
¶
¶
¶
30
• Magellan Charter (15.21% SWD tested population; +2.14 growth score)
• Mountain Discovery Charter (15.38% SWD tested population; +2.32 growth score)
• PreEminent Charter (17.95% SWD tested population; +8.38 growth score)
• Quest Academy (17.02% SWD tested population; +2.02 growth score)
• United Community School (18.8% SWD tested population; +4.83 growth score)
Figure J. Academic Growth with Students with Disabilities
Academic Growth with Students of Color
The figure below illustrates the growth index achieved by each school compared to the percentage
of students of color who were assessed in EOC or EOG assessments in 2018-2019.
Based on this data, eleven schools had a tested student of color population of at least 70% and
exceeded growth by achieving an EVAAS score of greater than +2:
• Alpha Academy (86.3%; +2.53)
• CIS Academy (95%; +3.75)
• Guilford Preparatory Academy (95%; +2.39)
• Healthy Start Academy (95%; +5.6)
• Henderson Collegiate (94.74%; +2.72)
• KIPP Durham College Preparatory (95%; +3.9)
• PreEminent Charter (95%; +8.38)
• Quality Education Academy (95%; +2.84)
• Research Triangle Charter (95%; +5.44)
• Sugar Creek Charter (95%; +3.29)
• Torchlight Academy (95%; +5.14)
Deleted: ¶
¶
31
Figure K. Academic Growth with Students of Color
Charter Academic Growth And Length of Time in Operation
Figure L depicts the number of charter schools not meeting, meeting, and exceeding growth, and the
length of time that schools have been in operation.
32
Figure L. Charter School Growth Status and Length of Time in Operation
Of the 48 schools that exceeded growth, nine (19%) have been in operation for 1-5 years; 8 (17%)
have been in operation for 6-10 years; three (6%) have been in operation for 11-15 years; 21 (44%)
have been in operation for 16-20 years; and seven (15%) have been in operation for 21 years or
more.
Of the 73 schools meeting growth, 21 (29%) have been in operation for 1-5 years; 15 (21%) have
been in operation for 6-10 years; seven (10%) have been in operation for 11-15 years; 21 (29%) have
been in operation for 16-20 years; and nine (12%) have been in operation for more than 20 years.
Of the 54 schools not meeting growth, 29 (54%) have been in operation for five years or fewer; 9
(17%) have been in operation for 6-10 years; five (9%) have been in operation for 11-15 years; eight
(15%) have been in operation for 16-20 years; and five (9%) have been in operation for greater than
20 years.
9
21
298
15
9
3
7 5
21
21
8
7
9
5
0
10
20
30
40
50
60
70
80
Exceeded Met Not Met
NumberofSchools
Growth Status
1-5 Years 6-10 Years 11-15 Years 16-20 Years 20+ Years
Formatted: Keep with next, Keep lines together
33
Table 12. Number and Percentage of Schools At or Above 60% Grade Level Proficient and
College/Career Ready
Charter Non-Charter All
# % # % # %
Schools
At/Above
60% GLP
(Level 3, 4,
or 5)
104 56% 1068 44% 1172 45%
Schools
At/Above
60% CCR
(Level 4 or
5)
46 25% 350 15% 396 15%
Academic Performance: Low-Performing and Continually Low-Performing Schools
S.L. 2016-79 defines Low-Performing and Continually Low-Performing Charter Schools as the
following:
1. Low-Performing charter schools are those that receive a school performance grade of D or
F and a school growth score of “met expected growth” or “not met expected growth.”
2. Continually Low-Performing charter schools are those that have been designated by the
State Board as Low-Performing for at least two of the last three years.
In 2018-19, 47 total schools were identified as either Low-Performing or Continually Low-
Performing. Thirty-eight schools were identified as Continually Low-Performing, and forty-two
schools were identified as Low-Performing. There was considerable overlap between the Low-
Performing and Continually Low-Performing lists. Of the 42 Low-Performing schools, 31 were also
Continually Low-Performing. Two of these schools were closed at the end of the 2018-19 school
year. Of the 38 Continually Low-Performing Schools, five were not identified as Low-Performing
because they received a grade higher than a D and either met or exceeded growth in 2018-19.
The number of LP/CLP charter schools increased from 34 in 2017-18 to 47 in 2018-19.
Formatted: Keep with next, Keep lines together
Commented [DA7]: Get denominators from Swetha
34
Table 13. Low-Performing/Continually Low-Performing Charter School Trends
2016-17 2017-18 2018-19
LP Schools 37 (22.6%) 28 (16.8%) 42 (23.6%)
CLP Schools 20 (12.3%) 28 (16.8%) 38 (21.3%)
CLP Charter Schools 38 (22.8%)
Recurring LP District
Schools
423 (18.5%)
Table 14. Total Low-Performing/Continually Low-Performing Charter School Trends
2016-17 2017-18 2018-19
Total LP/CLP
Schools
37 34 47
Formatted: Keep with next, Keep lines together
Formatted Table
Formatted: Keep with next, Keep lines together
Deleted: (22.7%)
Deleted: 4 (19.8%)
Deleted: (26.4%)
Deleted: ¶
¶
35
Figure M. Total Number of LP/CLP Charter Schools - Three Year Trend
In order to hold charter schools accountable for student achievement results, the CSAB
requires every school on the Low-Performing or Continually Low-Performing list to appear before
them and present a plan for school improvement. CSAB members ask pointed questions about the
efficacy of school plans and often encourage schools to establish student achievement goals that are
feasible and ambitious. Every school identified as Low-Performing or Continually Low-Performing
receives a site visit from the OCS Risk Assessment team. Schools consistently appearing on the
Low-Performing monitoring list are also at risk of possible charter termination or non-renewal.
Additional information on OCS-provided supports for Low-Performing and Continually Low-
Performing Schools is located in Appendix C.
37
34
47
16-17 17-18 18-19
Total LP/CLP Schools
Deleted: ¶
Formatted: Keep with next, Keep lines together
36
Academic Performance: Grade Level Proficiency Across Subject Areas and Subgroups
The next several charts depict charter school student proficiency in English/Language Arts,
Math, Science, and the ACT, both overall and within specific subgroups. The number of students
captured within each subgroup score is located in Appendix D.
English Language Arts
Charter Schools and Non-Charter Schools
All Students Comparisons 2019
Figure N. Percent of Students Scoring a Level 3 or Above on English/ELA EOC/EOG
English Language Arts
Charter Schools and Non-Charter Schools
Elementary Subgroup Comparison
64.7% 68.7%
71.0%
55.5% 57.2% 59.1%
0.0%
10.0%
20.0%
30.0%
40.0%
50.0%
60.0%
70.0%
80.0%
Elementary Middle High
Charter Non-Charter
Deleted: X
37
Figure O. Percent of Students Scoring a Level 3 or Above on English Language Arts EOG
Middle School Subgroup Comparison
Figure P. Percent of Students Scoring a Level 3 or Above on English/Language Arts EOG
64.7%
75.0%
44.9%
54.7%
44.7%
35.2%
29.4%
55.5%
69.4%
38.7%
42.1% 41.7%
24.3%
20.9%
0.0%
10.0%
20.0%
30.0%
40.0%
50.0%
60.0%
70.0%
80.0%
All White Black Hispanic EDS ELS SWD
Charter ELA 3-5 Non-Charter ELA 3-5
68.7%
77.2%
51.7%
61.4%
50.7%
25.5%
28.1%
57.2%
70.2%
40.0%
45.3%
42.6%
10.3%
17.5%
0.0%
10.0%
20.0%
30.0%
40.0%
50.0%
60.0%
70.0%
80.0%
90.0%
All White Black Hispanic EDS ELS SWD
Charter ELA 6-8 Non-Charter ELA 6-8
Formatted: Keep with next, Keep lines together
Deleted: ¶
¶
¶
Formatted: Left
38
High School Subgroup Comparison
Figure Q. Percent of Students Scoring a Level 3 or Above on English/Language Arts EOC
71.0%
78.4%
50.5%
63.7%
48.2%
12.5%
27.0%
59.1%
71.0%
41.0%
47.9%
42.9%
9.4%
17.0%
0.0%
10.0%
20.0%
30.0%
40.0%
50.0%
60.0%
70.0%
80.0%
90.0%
All White Black Hispanic EDS ELS SWD
Charter 9-12 Non-Charter 9-12
39
Mathematics Performance
Mathematics
Charter Schools and Non-Charter Schools
All Students Comparisons 2019
Figure R. Percent of Students Scoring a Level 3 or Above on Math EOC/EOG
Mathematics
Charter and Non-Charter Schools
Percent of Students Scoring a Level 3 or Above on Math EOC/EOG
63.4%
63.6%
44.6%
60.3%
56.0%
40.9%
0.0%
10.0%
20.0%
30.0%
40.0%
50.0%
60.0%
70.0%
Elementary Middle High
Charter Non-Charter
40
Figure S. Elementary School Subgroup Comparison
Figure T. Middle School Subgroup Comparison
63.4%
73.1%
43.8%
56.0%
43.8%
46.4%
30.8%
60.4%
72.6%
41.5%
53.1%
47.1%
40.8%
24.3%
0.0%
10.0%
20.0%
30.0%
40.0%
50.0%
60.0%
70.0%
All White Black Hispanic EDS ELS SWD
Charter 3-5 Non-Charter 3-5
63.6%
72.6%
45.2%
57.3%
44.3%
37.3%
24.9%
56.0%
68.9%
36.2%
47.5%
41.0%
19.5%
17.2%
0.0%
10.0%
20.0%
30.0%
40.0%
50.0%
60.0%
70.0%
All White Black Hispanic EDS ELS SWD
Charter 6-8 Non-Charter 6-8
Formatted: Keep with next, Keep lines together
41
Figure U. High School Subgroup Comparison
44.6%
52.7%
28.8%
41.2%
29.6% 28.6%
18.9%
40.9%
52.5%
27.1%
35.1%
31.8%
16.3%
13.7%
0.0%
10.0%
20.0%
30.0%
40.0%
50.0%
60.0%
All White Black Hispanic EDS ELS SWD
Charter 9-12 Non-Charter 9-12
Formatted: Keep with next, Keep lines together
42
Science Performance
Science
Charter Schools and Non-Charter Schools
All Students Comparisons 2019
Figure V. Percent of Students Scoring a Level 3 or Above on Science EOC/EOG
Science
Charter and Non-Charter Schools
Percent of Students Scoring a Level 3 or Above on Math EOC/EOG
Figure W. Elementary School Subgroup Comparison
75.1%
65.6%
72.3%
78.1%
59.3%
0.0%
10.0%
20.0%
30.0%
40.0%
50.0%
60.0%
70.0%
80.0%
Elementary Middle High
Charter Non-Charter
75.7%
83.9%
59.7%
70.2%
60.4%
52.1%
42.2%
72.3%
83.8%
56.8%
63.3% 61.6%
44.7%
34.9%
0.0%
10.0%
20.0%
30.0%
40.0%
50.0%
60.0%
70.0%
80.0%
90.0%
All White Black Hispanic EDS ELS SWD
Charter 3-5 Non-Charter 3-5
43
Figure X. Middle School Subgroup Performance
Figure Y. High School Subgroup Performance
85.1%
91.4%
71.9%
80.6%
73.1%
47.3%
54.9%
78.1%
88.1%
63.8%
69.1% 67.5%
32.5%
41.5%
0.0%
10.0%
20.0%
30.0%
40.0%
50.0%
60.0%
70.0%
80.0%
90.0%
100.0%
All White Black Hispanic EDS ELS SWD
Charter 6-8 Non-Charter 6-8
65.6%
72.7%
43.8%
55.4%
43.4%
24.1%
30.6%
59.3%
72.1%
39.2%
47.2%
43.3%
15.0%
21.6%
0.0%
10.0%
20.0%
30.0%
40.0%
50.0%
60.0%
70.0%
80.0%
All White Black Hispanic EDS ELS SWD
Charter 9-12 Non-Charter 9-12
44
ACT Performance
Charter Schools and Non-Charter Schools
Figure Z. Percent of Students Meeting UNC 2017 ACT Benchmark
70.0%
54.7%
34.5%
43.5%
33.4%
45.7%
55.1%
38.4%
24.9%
31.8%
24.2%
28.8%
0.0%
10.0%
20.0%
30.0%
40.0%
50.0%
60.0%
70.0%
80.0%
ACT ACT English ACT Math ACT Reading ACT Science ACT Writing
Charter Non-Charter
45
State Board of Education Strategic Plan
Goals and Measures for Charter Schools
The State Board of Education sets targets for charter school academic performance, as
measured by school performance grades, school growth, and Low-Performing/Continually Low-
Performing status. The chart below shows charter schools’ actual results relative to the State Board’s
goals and targets.
The Office of Charter Schools, Charter Schools Advisory Board, and State Board of
Education are committed to providing the supports necessary to ensure that the charter sector is
progressing towards the goals outlined in the SBE strategic plan.
Table 13. SBE Goals and Measures for Charter Schools
Measure
2018-2019
Targeted Actual
2.4.1
Percentage of charter
schools receiving SPG
of A or B
45.5% 43%
2.4.2
Percentage of charter
schools meeting or
exceeding expected
annual academic
growth
75% 69%
2.4.3
Percentage of charter
schools meeting or
exceeding all financial
and operational goals
as measured by the
OCS’ Performance
Framework
90% TBD
2.4.4a
Decrease number of
Low Performing
charter schools
25 42
2.4.44b
Decrease number of
Continually Low
Performing charter
schools
8 38
46
Charter School Impact on Local Districts
In 2018-2019, charter school average daily membership (ADM) accounted for 7.2% of the
state’s total ADM. Of the $9.44 billion in state funding for public education, 7.1% (or $674,314,240)
was allotted to charter schools.
Table 14. Number of Charters Approved, Opened, Closed and Total State Funds Allotted
Unlike local education agencies, charter schools are not bound to serve only the students
residing within a particular county or district. Many charter schools serve students from multiple
districts, which often poses challenges related to transportation and funding allocations. Given the
large number of districts from which a charter school may enroll students, it is difficult to pinpoint
the specific fiscal impact of a given charter school on its “home district.” The map below illustrates
the percentage of public school students in membership for each district in the state.
47
Figure AA. Percentage of Public School Students in Membership at Charter Schools
In 2018-2019, the individual LEAs with the highest percentages of charter school membership
(compared to total district and charter ADM) were located predominantly in rural areas, with the
exception of Durham Public Schools. The table below outlines the LEAs where charter membership
is at least 13% of the total district and charter ADM. A table of percentage of charter membership
for every LEA in NC is in Appendix E.
Table 15. LEAs with at Least 13% of Students Enrolled in Charter Schools
Region LEA Charter Membership LEA Allotted
ADM
Total LEA
and CS
% of LEA
1 Halifax 959 2,472 3,431 28.0%
1 Northampton 530 1,651 2,181 24.3%
3 Vance 1,853 5,928 7,781 23.8%
1 Weldon City 251 899 1,150 21.8%
3 Person 1,134 4,449 5,583 20.3%
3 Durham
Public
6,957 33,080 40,037 17.4%
3 Granville 1,500 7,511 9,011 16.6%
3 Warren 378 2,039 2,417 15.6%
2 Pamlico 230 1,250 1,480 15.5%
3 Wilson 1,834 11,554 13,388 13.7%
8 Rutherford 1,236 8,183 9,419 13.1%
3 Franklin 1,224 8,198 9,422 13.0%
In 2018-2019, the SBE Education districts with the highest percentages of charter school
membership (compared to total district and charter ADM) were Regions 3 and 6. The table below
Deleted: X
48
outlines the total percentage of charter membership for each region. A map of the eight State Board
of Education Districts is also below for reference.
Figure AB. North Carolina State Board of Education Districts
Table 16. SBE Districts/Regions and Total Charter Membership
Region 2019 Charter
Membership
LEA Allotted
ADM
Total LEA
and CS
% of LEA
North Central – 3 35,420 352,216 387,636 9.1%
Southwest – 6 34,523 343,488 378,011 9.1%
Western – 8 6,123 81,266 87,389 7.0%
Northeast – 1 4,632 71,272 75,904 6.1%
Piedmont-Triad – 5 15,273 238,458 253,731 6.0%
Southeast – 2 5,293 140,320 145,613 3.6%
Sandhills – 4 4,804 134,812 139,616 3.4%
Northwest – 7 1,104 82,705 83,809 1.3%
Charter schools also have positive potential impacts on local districts, such as relieving
overcrowding, supplementing educational offerings currently available to parents, and reducing the
financial strain on districts of building new facilities. Charter schools received a survey to gather
square footage information, in order to estimate the amount of money districts have saved on
facilities by not having to build schools to house students enrolled in charter schools. Preliminary
survey results indicate that charter school square footage across the state totals approximately
11,000,000 square feet. If that figure is multiplied by a conservative estimate of $100 per square foot
in building, renovation, and maintenance costs, charter schools may be saving districts almost $1
49
billion dollars in capital improvements. Further analysis on facilities savings is necessary to confirm
this figure.
Prior to 2013, the State Board of Education was required by legislation to solicit impact statements
from LEAs when new applications for charters were being considered or when exiting charter
schools wanted to grow beyond what was normally allowed within the statute. The General
Assembly removed the requirement that LEAs submit impact statements, but the State Board has
continued to consider comments from school districts in situations involving charter school
enrollment growth.
50
Ensuring Autonomy and Accountability
As schools of choice, charter schools are accountable to parents and guardians, who may withdraw
their student(s) and re-enroll them elsewhere, should the school not meet their expectations.
However, the North Carolina General Assembly and State Board of Education have approved
several additional, concrete measures through which charter schools are held accountable to
stakeholders:
1) Per General Statute 115C-218.25, all charter school boards are subject to the Open Meetings
Laws and must publish the board meeting schedule on their website.
2) Per General Statute 115C-218.25, all charter schools are subject to the Public Records Act
and must promptly comply with citizen requests.
3) Per General Statute 115C-218.90(b), all charter schools must adopt a criminal history check
policy mirror that of the local school administrative unit in which the school is located.
Further, all charter school board members must have criminal background checks.
4) Per General Statute 115C-218.85(3) and SBE policy CHTR-001, all charter schools are
required to conduct the student assessments required by the SBE. Further, all charter
schools are required to comply with North Carolina’s Accountability Model, unless
otherwise approved by the SBE. Currently, four charter schools have been approved for an
alternative accountability model.
5) Per General Statute 115C-218.30 and SBE policy CHTR-006, every charter school is
required to undergo an annual audit for both its finances and its compliance with applicable
federal and state laws and policies. These audits conducted by an independent auditor
approved by the Local Governance Commission, and the audit must be published on the
school’s website. (LGC Audit Requirements located in Appendix F)
6) Per General Statute 115C-218.94 and SBE policy CHTR-010, every charter school identified
as Low Performing or Continually Low Performing is required to come before the Charter
School Advisory Board and outline their plan for improving student achievement.
7) Goal 2, Objective 2.4 of the SBE’s Strategic Plan is to “Increase the number of schools
meeting academic, operational, and financial goals.” Annually, the Office of Charter Schools’
Performance Framework serves as the standard mechanism for reporting on progress
toward achievement of these goals. The framework provides a consolidated view of the
school’s performance relative to a list of academic, operational, and financial requirements.
The academic elements of the Framework are all standard indicators provided by the State
accountability system. The operational and financial elements of the Framework are all
required by General Statute, State Board Policy, or the Charter Agreement. This yearly
compliance review involves divisions across the entire Department of Public Instruction
(such as Exceptional Children and Financial Business Services) and ensures that charter
schools are also in compliance with federal reporting requirements. (Performance
Framework Guidelines located in Appendix G)
8) Per General Statute 115C-218.6 and SBE policy CHTR-007, every charter school is required
to undergo a rigorous renewal process prior to having their charter term extended. Schools
Deleted: X
Deleted: X
51
not meeting the expected academic, financial, and/or governance standards are subject to
renewal terms of 7, 5, 3 years or non-renewal. (Renewal Policy and Framework located in
Appendix B) Deleted: X
52
Best Practices Resulting from Charter School Operations
Northeast Academy for Aerospace and Advanced Technologies “NEAAT” is a charter school
physically located on the campus of Elizabeth City State University in Elizabeth City, North
Carolina. NEAAT’s school operations provide several examples of best practices that may be
transferred to other charter and district schools.
1) NEAAT’s governing board has established a five-year strategic plan, complete with goals,
objectives, and yearly milestones. The strategic plan includes an emphasis on an exceptional
school culture through parent and community engagement, sustained extracurricular
activities, demographics that mirror the geographic region, and stakeholder surveys;
college/career readiness through academic pathways and internship opportunities,
professional development for teachers, opportunities for students to present research, and
an emphasis on helping students earn industry-recognized credentials/certifications; and the
long-term sustainability of the school through a growing fund balance, multiple highly
qualified candidates for each staffing vacancy, increased teacher retention, and collaborative
projects with external partners such as other schools, districts, community organizations, etc.
2) NEAAT has demonstrated a commitment to university/community partnerships, as
evidenced by its collaborative agreement with Elizabeth City State University. In addition to
sharing physical classroom space, the university offers NEAAT students opportunities to
utilize other campus resources related to NEAAT’s unique school mission and academic
pathways – aerospace, computer science, and health sciences. The school has obtained
sponsorships from organizations such as the William R. Kenan, Jr. Charitable Trust, the
Golden Leaf Foundation, the Carnegie Corporation of New York, the Elizabeth City
Foundation, and Sentara Albemarle Medical Center. Moreover, the school’s strategic plan
contains objectives related to increasing signed partnership agreements and volunteer hours
with community and business organizations, and designing/implementing high-quality
project-based learning assignments that have been informed by business and community
partners.
The North Carolina Advancing Charter Collaboration and Excellence for Student Success
(NC ACCESS) program provided training to NC ACCESS fellows on developing meaningful
relationships and effective parent and community engagement with educationally
disadvantaged students and their families. Each subgrantee was charged with creating a plan to
engage diverse populations during the school’s initial enrollment drive and throughout the grant
period, and monitoring indicators were provided to ensure that the plans developed were intentional
and comprehensive. At the conclusion of the training, the NC ACCESS team offered subgrantees an
opportunity to submit a mini-proposal to implement a parent engagement activity. Groups
submitting the strongest proposals were awarded $500 towards project implementation.
IC Imagine was awarded a $500 award to create a parent resource library (both online and physical)
to support parents in multiple areas, including the use of social media, bullying, homework help,
child/family wellness, literacy and core academic support at home, access to PowerSchool, and
college entry. To engage parents with the resource center, the school will host an opening event with
dinner for families. At the event, teachers and staff will show families how to access the resources,
and then allow families time for exploration. Multiple community organizations, such as the
Buncombe County Library and ECAC’s Western Office will partner with the school in the provision
Deleted: traditional public
53
of resources. Finally, IC Imagine will host a Parent Resource Orientation Night with dinner each
semester to provide an overview of available resources, share information on community
agencies/partners willing to assist, and to continue fostering relationships with families, teachers,
and administrators.
Hiring a Diverse Teacher Workforce
The Fordham Institute released a report examining North Carolina teacher and student data from
2006-07 through 2012-13 to determine the frequency and impact of student-teacher race match in
charter and district schools. The report included several key findings, including:
1) Charter and district schools served the same proportion of black students, but charter
schools hired about 35% more black teachers.
2) Black students enrolled in charter schools are more likely to have a black teacher than their
counterparts in district schools, but white students in district and charter schools are equally
likely to have a white teacher.
54
Charter Schools Receiving Special Awards and Recognition
In 2018-2019, Envision Science Academy was the only school in the state to be
recognized as an NC Model STEM School of Distinction.
*Multiple charter schools were recognized by the CSAB for outstanding qualities:
1) Lake Norman Charter was recognized in Newsweek as one of America’s Best
STEM High Schools
2) East Wake Academy teacher Heather Futtrell was honored for her exceptional
ability to teach and connect with students
3) Charter School Teacher of the Year Ashley Bailey from Roxboro Community
School was recognized for her stellar accomplishments
4) Lincoln Charter School was recognized for outstanding sportsmanship and
character
5) Henderson Collegiate and its founder/leader Eric Sanchez was recognized for
outstanding student achievement
*U.S. News and World Report released a list of Top Ranked NC Schools based on six
indicators: College Readiness, Math and Reading Proficiency, Math and Reading
Performance, Underserved Student Performance, College Curriculum Breadth, and
Graduation Rate. Several charter schools were among the highest rated:
• Raleigh Charter High School (#2)
• Woods Charter (#5)
• Thomas Jefferson Classical Academy (#7)
• Lake Norman Charter School (#9)
• Pine Lake Preparatory (#19)
• Franklin Academy (#20)
• Community School of Davidson (#22)
• Gray Stone Day School (#24)
• Gaston College Preparatory (#28)
• Research Triangle High School (#31)
• The Hawbridge School (#39)
• Union Academy (#46)
• Voyager Academy (#48)
• Longleaf School of the Arts (#51)
• Oxford Preparatory Academy (#52)
• Lincoln Charter (#53)
• East Wake Academy (#54)
*In a survey of the state’s charter high schools, an estimated $122 million dollars in scholarships
were awarded to the graduating class of 2019. The number of reported graduates in the 88 charter
high schools returning the survey was 3,432. That averages to $35,548 per graduate.
Deleted: ¶
Page Break
Formatted: Font: Font color: Custom
Color(RGB(179,94,6))
Deleted: ¶
¶
¶
Page Break
Formatted: Pattern: Clear (White)
55
Appendices
Appendix A Ready-to-Open Final Enrollment Report
Appendix B SBE Approved Renewal Policy
Appendix C OCS Supports for Low-Performing and Continually Low-Performing Schools
Appendix D Subgroup Size for Test Performance Reporting
Appendix E Charter Membership in NC LEAs
Appendix F LGC Audit Requirements
Appendix G Performance Framework Guidelines

More Related Content

What's hot

College by Subscription
College by SubscriptionCollege by Subscription
College by SubscriptionStraighterLine
 
Local Control Funding Formula 101 presentation by the Santa Clara County Offi...
Local Control Funding Formula 101 presentation by the Santa Clara County Offi...Local Control Funding Formula 101 presentation by the Santa Clara County Offi...
Local Control Funding Formula 101 presentation by the Santa Clara County Offi...district5united
 
SBE evaluation recommendations
SBE evaluation recommendationsSBE evaluation recommendations
SBE evaluation recommendationsEducationNC
 
Private Investment Opportunities In Education Booz And Company Bfe Mena 2011
Private Investment Opportunities In Education Booz And Company Bfe Mena 2011Private Investment Opportunities In Education Booz And Company Bfe Mena 2011
Private Investment Opportunities In Education Booz And Company Bfe Mena 2011espie77
 
Curriculum standards commoncore_trainerguide
Curriculum standards commoncore_trainerguideCurriculum standards commoncore_trainerguide
Curriculum standards commoncore_trainerguideSat Án
 
Certification Inspection Report MLIS-W
Certification Inspection Report MLIS-WCertification Inspection Report MLIS-W
Certification Inspection Report MLIS-WBlake Defieux
 
State update-webinar-series-2014-updated-august-8-2014
State update-webinar-series-2014-updated-august-8-2014State update-webinar-series-2014-updated-august-8-2014
State update-webinar-series-2014-updated-august-8-2014chume1
 
Round 3 budget priorities
Round 3 budget prioritiesRound 3 budget priorities
Round 3 budget prioritiesEducationNC
 
A Skills Beyond School Review of Kazakhstan
A Skills Beyond School Review of KazakhstanA Skills Beyond School Review of Kazakhstan
A Skills Beyond School Review of KazakhstanEduSkills OECD
 
Summer school guidance presentation
Summer school guidance presentationSummer school guidance presentation
Summer school guidance presentationEducationNC
 
COVID round three priorities
COVID round three prioritiesCOVID round three priorities
COVID round three prioritiesEducationNC
 
A Skills Beyond School Review of South Africa
A Skills Beyond School Review of South AfricaA Skills Beyond School Review of South Africa
A Skills Beyond School Review of South AfricaEduSkills OECD
 
DPI COVID-19 estimates
DPI COVID-19 estimatesDPI COVID-19 estimates
DPI COVID-19 estimatesEducationNC
 
A Skills Beyond School Review of Egypt
A Skills Beyond School Review of Egypt A Skills Beyond School Review of Egypt
A Skills Beyond School Review of Egypt EduSkills OECD
 

What's hot (20)

College by Subscription
College by SubscriptionCollege by Subscription
College by Subscription
 
Final Project Financial
Final Project Financial Final Project Financial
Final Project Financial
 
Local Control Funding Formula 101 presentation by the Santa Clara County Offi...
Local Control Funding Formula 101 presentation by the Santa Clara County Offi...Local Control Funding Formula 101 presentation by the Santa Clara County Offi...
Local Control Funding Formula 101 presentation by the Santa Clara County Offi...
 
SBE evaluation recommendations
SBE evaluation recommendationsSBE evaluation recommendations
SBE evaluation recommendations
 
Private Investment Opportunities In Education Booz And Company Bfe Mena 2011
Private Investment Opportunities In Education Booz And Company Bfe Mena 2011Private Investment Opportunities In Education Booz And Company Bfe Mena 2011
Private Investment Opportunities In Education Booz And Company Bfe Mena 2011
 
Educational service contracting
Educational service contractingEducational service contracting
Educational service contracting
 
Curriculum standards commoncore_trainerguide
Curriculum standards commoncore_trainerguideCurriculum standards commoncore_trainerguide
Curriculum standards commoncore_trainerguide
 
Certification Inspection Report MLIS-W
Certification Inspection Report MLIS-WCertification Inspection Report MLIS-W
Certification Inspection Report MLIS-W
 
Concept paper for higher education summit
Concept paper for higher education summitConcept paper for higher education summit
Concept paper for higher education summit
 
State update-webinar-series-2014-updated-august-8-2014
State update-webinar-series-2014-updated-august-8-2014State update-webinar-series-2014-updated-august-8-2014
State update-webinar-series-2014-updated-august-8-2014
 
Round 3 budget priorities
Round 3 budget prioritiesRound 3 budget priorities
Round 3 budget priorities
 
EETT- C 2010
EETT- C 2010EETT- C 2010
EETT- C 2010
 
A Skills Beyond School Review of Kazakhstan
A Skills Beyond School Review of KazakhstanA Skills Beyond School Review of Kazakhstan
A Skills Beyond School Review of Kazakhstan
 
Summer school guidance presentation
Summer school guidance presentationSummer school guidance presentation
Summer school guidance presentation
 
COVID round three priorities
COVID round three prioritiesCOVID round three priorities
COVID round three priorities
 
GMA IV_Mtasiwa
GMA IV_MtasiwaGMA IV_Mtasiwa
GMA IV_Mtasiwa
 
A Skills Beyond School Review of South Africa
A Skills Beyond School Review of South AfricaA Skills Beyond School Review of South Africa
A Skills Beyond School Review of South Africa
 
DPI COVID-19 estimates
DPI COVID-19 estimatesDPI COVID-19 estimates
DPI COVID-19 estimates
 
A Skills Beyond School Review of Egypt
A Skills Beyond School Review of Egypt A Skills Beyond School Review of Egypt
A Skills Beyond School Review of Egypt
 
5410 For O L A C
5410 For  O L A C5410 For  O L A C
5410 For O L A C
 

Similar to Redline charter school report

Annual Charter School Report 2019
Annual Charter School Report 2019Annual Charter School Report 2019
Annual Charter School Report 2019EducationNC
 
No child left behind
No child left behindNo child left behind
No child left behindt5928
 
California State_Levinar
California State_LevinarCalifornia State_Levinar
California State_LevinarSharonne Navas
 
Communities of Excellence - Idaho CSP Summary Slides 12 5-18.2
Communities of Excellence - Idaho CSP Summary Slides   12 5-18.2Communities of Excellence - Idaho CSP Summary Slides   12 5-18.2
Communities of Excellence - Idaho CSP Summary Slides 12 5-18.2Kristen McCarver
 
Sheldon Berman, Beyond discord: Resolving the tensions between charter and pu...
Sheldon Berman, Beyond discord: Resolving the tensions between charter and pu...Sheldon Berman, Beyond discord: Resolving the tensions between charter and pu...
Sheldon Berman, Beyond discord: Resolving the tensions between charter and pu...Sheldon Berman
 
Obama's Blueprint for ESEA
Obama's Blueprint for ESEAObama's Blueprint for ESEA
Obama's Blueprint for ESEAsarverm
 
Executive Summary Convening 2023.pdf
Executive Summary Convening 2023.pdfExecutive Summary Convening 2023.pdf
Executive Summary Convening 2023.pdfMebane Rash
 
Reform Alabama - Blueprint for Education Reform
Reform Alabama - Blueprint for Education ReformReform Alabama - Blueprint for Education Reform
Reform Alabama - Blueprint for Education Reformbsc_admin
 
Student Completion - Background information
Student Completion - Background informationStudent Completion - Background information
Student Completion - Background informationHigherEdUtah
 
Jared Polis Foundation Education Report Fall 2002
Jared Polis Foundation Education Report Fall 2002Jared Polis Foundation Education Report Fall 2002
Jared Polis Foundation Education Report Fall 2002Lisa Finkelstein
 
Clayton Valley: Today v. Tomorrow
Clayton Valley: Today v. TomorrowClayton Valley: Today v. Tomorrow
Clayton Valley: Today v. Tomorrowperreirad
 
The North Carolina Community College System
The North Carolina Community College SystemThe North Carolina Community College System
The North Carolina Community College Systemtdize
 
Career College Promise and CIHS
Career College Promise and CIHSCareer College Promise and CIHS
Career College Promise and CIHSEducationNC
 
Extended Local Control Funding Formula presentation by Public Advocates
Extended Local Control Funding Formula presentation by Public AdvocatesExtended Local Control Funding Formula presentation by Public Advocates
Extended Local Control Funding Formula presentation by Public Advocatesdistrict5united
 
Is Oregon Ready to Implement Competency Education?
Is Oregon Ready to Implement Competency Education?Is Oregon Ready to Implement Competency Education?
Is Oregon Ready to Implement Competency Education?Jesse Moyer
 
Phase 1 Leandro Draft Plans
Phase 1 Leandro Draft PlansPhase 1 Leandro Draft Plans
Phase 1 Leandro Draft PlansAnalisa Sorrells
 
Final black and latino caucus ccjef presentation final
Final black and latino caucus ccjef presentation finalFinal black and latino caucus ccjef presentation final
Final black and latino caucus ccjef presentation finalConnCAN
 
We Must Have Even Higher Expectations For Teachers
We Must Have Even Higher Expectations For TeachersWe Must Have Even Higher Expectations For Teachers
We Must Have Even Higher Expectations For Teachersnoblex1
 

Similar to Redline charter school report (20)

Annual Charter School Report 2019
Annual Charter School Report 2019Annual Charter School Report 2019
Annual Charter School Report 2019
 
No child left behind
No child left behindNo child left behind
No child left behind
 
California State_Levinar
California State_LevinarCalifornia State_Levinar
California State_Levinar
 
Communities of Excellence - Idaho CSP Summary Slides 12 5-18.2
Communities of Excellence - Idaho CSP Summary Slides   12 5-18.2Communities of Excellence - Idaho CSP Summary Slides   12 5-18.2
Communities of Excellence - Idaho CSP Summary Slides 12 5-18.2
 
Sheldon Berman, Beyond discord: Resolving the tensions between charter and pu...
Sheldon Berman, Beyond discord: Resolving the tensions between charter and pu...Sheldon Berman, Beyond discord: Resolving the tensions between charter and pu...
Sheldon Berman, Beyond discord: Resolving the tensions between charter and pu...
 
Obama's Blueprint for ESEA
Obama's Blueprint for ESEAObama's Blueprint for ESEA
Obama's Blueprint for ESEA
 
Executive Summary Convening 2023.pdf
Executive Summary Convening 2023.pdfExecutive Summary Convening 2023.pdf
Executive Summary Convening 2023.pdf
 
Reform Alabama - Blueprint for Education Reform
Reform Alabama - Blueprint for Education ReformReform Alabama - Blueprint for Education Reform
Reform Alabama - Blueprint for Education Reform
 
Ways and means 3 16-11 lw
Ways and means 3 16-11 lwWays and means 3 16-11 lw
Ways and means 3 16-11 lw
 
Student Completion - Background information
Student Completion - Background informationStudent Completion - Background information
Student Completion - Background information
 
Michigan CSP Informational Meeting - February 2021
Michigan CSP Informational Meeting - February 2021Michigan CSP Informational Meeting - February 2021
Michigan CSP Informational Meeting - February 2021
 
Jared Polis Foundation Education Report Fall 2002
Jared Polis Foundation Education Report Fall 2002Jared Polis Foundation Education Report Fall 2002
Jared Polis Foundation Education Report Fall 2002
 
Clayton Valley: Today v. Tomorrow
Clayton Valley: Today v. TomorrowClayton Valley: Today v. Tomorrow
Clayton Valley: Today v. Tomorrow
 
The North Carolina Community College System
The North Carolina Community College SystemThe North Carolina Community College System
The North Carolina Community College System
 
Career College Promise and CIHS
Career College Promise and CIHSCareer College Promise and CIHS
Career College Promise and CIHS
 
Extended Local Control Funding Formula presentation by Public Advocates
Extended Local Control Funding Formula presentation by Public AdvocatesExtended Local Control Funding Formula presentation by Public Advocates
Extended Local Control Funding Formula presentation by Public Advocates
 
Is Oregon Ready to Implement Competency Education?
Is Oregon Ready to Implement Competency Education?Is Oregon Ready to Implement Competency Education?
Is Oregon Ready to Implement Competency Education?
 
Phase 1 Leandro Draft Plans
Phase 1 Leandro Draft PlansPhase 1 Leandro Draft Plans
Phase 1 Leandro Draft Plans
 
Final black and latino caucus ccjef presentation final
Final black and latino caucus ccjef presentation finalFinal black and latino caucus ccjef presentation final
Final black and latino caucus ccjef presentation final
 
We Must Have Even Higher Expectations For Teachers
We Must Have Even Higher Expectations For TeachersWe Must Have Even Higher Expectations For Teachers
We Must Have Even Higher Expectations For Teachers
 

More from EducationNC

NC STEM Plan 2035
NC STEM Plan 2035NC STEM Plan 2035
NC STEM Plan 2035EducationNC
 
Hispanic student experiences with transfer
Hispanic student experiences with transferHispanic student experiences with transfer
Hispanic student experiences with transferEducationNC
 
7Education-excerpt.pdf
7Education-excerpt.pdf7Education-excerpt.pdf
7Education-excerpt.pdfEducationNC
 
Supt Truitt - Operation Polaris 2.0.pdf
Supt Truitt - Operation Polaris 2.0.pdfSupt Truitt - Operation Polaris 2.0.pdf
Supt Truitt - Operation Polaris 2.0.pdfEducationNC
 
February Superintendent SBE Report 1.12.23_347984yturdpaadaely1a0jhvpvg0k.pdf
February Superintendent SBE Report 1.12.23_347984yturdpaadaely1a0jhvpvg0k.pdfFebruary Superintendent SBE Report 1.12.23_347984yturdpaadaely1a0jhvpvg0k.pdf
February Superintendent SBE Report 1.12.23_347984yturdpaadaely1a0jhvpvg0k.pdfEducationNC
 
2023_EPP Performance Reporting_v2_347343yturdpaadaely1a0jhvpvg0k.pdf
2023_EPP Performance Reporting_v2_347343yturdpaadaely1a0jhvpvg0k.pdf2023_EPP Performance Reporting_v2_347343yturdpaadaely1a0jhvpvg0k.pdf
2023_EPP Performance Reporting_v2_347343yturdpaadaely1a0jhvpvg0k.pdfEducationNC
 
2302_ESP_SOTP PPT_v3_347513yturdpaadaely1a0jhvpvg0k.pdf
2302_ESP_SOTP PPT_v3_347513yturdpaadaely1a0jhvpvg0k.pdf2302_ESP_SOTP PPT_v3_347513yturdpaadaely1a0jhvpvg0k.pdf
2302_ESP_SOTP PPT_v3_347513yturdpaadaely1a0jhvpvg0k.pdfEducationNC
 
CS K12 Legislative Brief House Ed January 2023.pdf
CS K12 Legislative Brief House Ed January 2023.pdfCS K12 Legislative Brief House Ed January 2023.pdf
CS K12 Legislative Brief House Ed January 2023.pdfEducationNC
 
FINAL_NCASA 2023 Legislative Priorities_rev. 1.6.23.pdf
FINAL_NCASA 2023 Legislative Priorities_rev. 1.6.23.pdfFINAL_NCASA 2023 Legislative Priorities_rev. 1.6.23.pdf
FINAL_NCASA 2023 Legislative Priorities_rev. 1.6.23.pdfEducationNC
 
FTE STATE BOARD SLIDE DECK (1)_3448851rr0iszrpy5ecvm1plgvnywf.pdf
FTE STATE BOARD SLIDE DECK (1)_3448851rr0iszrpy5ecvm1plgvnywf.pdfFTE STATE BOARD SLIDE DECK (1)_3448851rr0iszrpy5ecvm1plgvnywf.pdf
FTE STATE BOARD SLIDE DECK (1)_3448851rr0iszrpy5ecvm1plgvnywf.pdfEducationNC
 
Government Affairs January 2023 SBE Budget Presentation (DRAFT)_3448671rr0isz...
Government Affairs January 2023 SBE Budget Presentation (DRAFT)_3448671rr0isz...Government Affairs January 2023 SBE Budget Presentation (DRAFT)_3448671rr0isz...
Government Affairs January 2023 SBE Budget Presentation (DRAFT)_3448671rr0isz...EducationNC
 
SBE Strategic Plan Discussion - January 2023_3445821rr0iszrpy5ecvm1plgvnywf.pdf
SBE Strategic Plan Discussion - January 2023_3445821rr0iszrpy5ecvm1plgvnywf.pdfSBE Strategic Plan Discussion - January 2023_3445821rr0iszrpy5ecvm1plgvnywf.pdf
SBE Strategic Plan Discussion - January 2023_3445821rr0iszrpy5ecvm1plgvnywf.pdfEducationNC
 
Pathways -- Statutory and other changes for Pilot Program - January 2023 Draf...
Pathways -- Statutory and other changes for Pilot Program - January 2023 Draf...Pathways -- Statutory and other changes for Pilot Program - January 2023 Draf...
Pathways -- Statutory and other changes for Pilot Program - January 2023 Draf...EducationNC
 
States NOF Ex. A - Affidavit of Anca Grozav.pdf
States NOF Ex. A - Affidavit of Anca Grozav.pdfStates NOF Ex. A - Affidavit of Anca Grozav.pdf
States NOF Ex. A - Affidavit of Anca Grozav.pdfEducationNC
 
Rule 14.3 Report to the Court.pdf
Rule 14.3 Report to the Court.pdfRule 14.3 Report to the Court.pdf
Rule 14.3 Report to the Court.pdfEducationNC
 
Order Reassigning Case.pdf
Order Reassigning Case.pdfOrder Reassigning Case.pdf
Order Reassigning Case.pdfEducationNC
 
Letter from Judge Robinson to Chief Justice Newby-2.pdf
Letter from Judge Robinson to Chief Justice Newby-2.pdfLetter from Judge Robinson to Chief Justice Newby-2.pdf
Letter from Judge Robinson to Chief Justice Newby-2.pdfEducationNC
 
DRAFT JLEOC Committee Report.pdf
DRAFT JLEOC Committee Report.pdfDRAFT JLEOC Committee Report.pdf
DRAFT JLEOC Committee Report.pdfEducationNC
 
221110_Model_Updated_3414051ndi34uk1r1sojyjj1jjmfxd.pdf
221110_Model_Updated_3414051ndi34uk1r1sojyjj1jjmfxd.pdf221110_Model_Updated_3414051ndi34uk1r1sojyjj1jjmfxd.pdf
221110_Model_Updated_3414051ndi34uk1r1sojyjj1jjmfxd.pdfEducationNC
 

More from EducationNC (20)

NC STEM Plan 2035
NC STEM Plan 2035NC STEM Plan 2035
NC STEM Plan 2035
 
Hispanic student experiences with transfer
Hispanic student experiences with transferHispanic student experiences with transfer
Hispanic student experiences with transfer
 
7Education-excerpt.pdf
7Education-excerpt.pdf7Education-excerpt.pdf
7Education-excerpt.pdf
 
Supt Truitt - Operation Polaris 2.0.pdf
Supt Truitt - Operation Polaris 2.0.pdfSupt Truitt - Operation Polaris 2.0.pdf
Supt Truitt - Operation Polaris 2.0.pdf
 
February Superintendent SBE Report 1.12.23_347984yturdpaadaely1a0jhvpvg0k.pdf
February Superintendent SBE Report 1.12.23_347984yturdpaadaely1a0jhvpvg0k.pdfFebruary Superintendent SBE Report 1.12.23_347984yturdpaadaely1a0jhvpvg0k.pdf
February Superintendent SBE Report 1.12.23_347984yturdpaadaely1a0jhvpvg0k.pdf
 
2023_EPP Performance Reporting_v2_347343yturdpaadaely1a0jhvpvg0k.pdf
2023_EPP Performance Reporting_v2_347343yturdpaadaely1a0jhvpvg0k.pdf2023_EPP Performance Reporting_v2_347343yturdpaadaely1a0jhvpvg0k.pdf
2023_EPP Performance Reporting_v2_347343yturdpaadaely1a0jhvpvg0k.pdf
 
2302_ESP_SOTP PPT_v3_347513yturdpaadaely1a0jhvpvg0k.pdf
2302_ESP_SOTP PPT_v3_347513yturdpaadaely1a0jhvpvg0k.pdf2302_ESP_SOTP PPT_v3_347513yturdpaadaely1a0jhvpvg0k.pdf
2302_ESP_SOTP PPT_v3_347513yturdpaadaely1a0jhvpvg0k.pdf
 
CS K12 Legislative Brief House Ed January 2023.pdf
CS K12 Legislative Brief House Ed January 2023.pdfCS K12 Legislative Brief House Ed January 2023.pdf
CS K12 Legislative Brief House Ed January 2023.pdf
 
FINAL_NCASA 2023 Legislative Priorities_rev. 1.6.23.pdf
FINAL_NCASA 2023 Legislative Priorities_rev. 1.6.23.pdfFINAL_NCASA 2023 Legislative Priorities_rev. 1.6.23.pdf
FINAL_NCASA 2023 Legislative Priorities_rev. 1.6.23.pdf
 
FTE STATE BOARD SLIDE DECK (1)_3448851rr0iszrpy5ecvm1plgvnywf.pdf
FTE STATE BOARD SLIDE DECK (1)_3448851rr0iszrpy5ecvm1plgvnywf.pdfFTE STATE BOARD SLIDE DECK (1)_3448851rr0iszrpy5ecvm1plgvnywf.pdf
FTE STATE BOARD SLIDE DECK (1)_3448851rr0iszrpy5ecvm1plgvnywf.pdf
 
Government Affairs January 2023 SBE Budget Presentation (DRAFT)_3448671rr0isz...
Government Affairs January 2023 SBE Budget Presentation (DRAFT)_3448671rr0isz...Government Affairs January 2023 SBE Budget Presentation (DRAFT)_3448671rr0isz...
Government Affairs January 2023 SBE Budget Presentation (DRAFT)_3448671rr0isz...
 
SBE Strategic Plan Discussion - January 2023_3445821rr0iszrpy5ecvm1plgvnywf.pdf
SBE Strategic Plan Discussion - January 2023_3445821rr0iszrpy5ecvm1plgvnywf.pdfSBE Strategic Plan Discussion - January 2023_3445821rr0iszrpy5ecvm1plgvnywf.pdf
SBE Strategic Plan Discussion - January 2023_3445821rr0iszrpy5ecvm1plgvnywf.pdf
 
COVID Impacts
COVID ImpactsCOVID Impacts
COVID Impacts
 
Pathways -- Statutory and other changes for Pilot Program - January 2023 Draf...
Pathways -- Statutory and other changes for Pilot Program - January 2023 Draf...Pathways -- Statutory and other changes for Pilot Program - January 2023 Draf...
Pathways -- Statutory and other changes for Pilot Program - January 2023 Draf...
 
States NOF Ex. A - Affidavit of Anca Grozav.pdf
States NOF Ex. A - Affidavit of Anca Grozav.pdfStates NOF Ex. A - Affidavit of Anca Grozav.pdf
States NOF Ex. A - Affidavit of Anca Grozav.pdf
 
Rule 14.3 Report to the Court.pdf
Rule 14.3 Report to the Court.pdfRule 14.3 Report to the Court.pdf
Rule 14.3 Report to the Court.pdf
 
Order Reassigning Case.pdf
Order Reassigning Case.pdfOrder Reassigning Case.pdf
Order Reassigning Case.pdf
 
Letter from Judge Robinson to Chief Justice Newby-2.pdf
Letter from Judge Robinson to Chief Justice Newby-2.pdfLetter from Judge Robinson to Chief Justice Newby-2.pdf
Letter from Judge Robinson to Chief Justice Newby-2.pdf
 
DRAFT JLEOC Committee Report.pdf
DRAFT JLEOC Committee Report.pdfDRAFT JLEOC Committee Report.pdf
DRAFT JLEOC Committee Report.pdf
 
221110_Model_Updated_3414051ndi34uk1r1sojyjj1jjmfxd.pdf
221110_Model_Updated_3414051ndi34uk1r1sojyjj1jjmfxd.pdf221110_Model_Updated_3414051ndi34uk1r1sojyjj1jjmfxd.pdf
221110_Model_Updated_3414051ndi34uk1r1sojyjj1jjmfxd.pdf
 

Recently uploaded

mini mental status format.docx
mini    mental       status     format.docxmini    mental       status     format.docx
mini mental status format.docxPoojaSen20
 
Hybridoma Technology ( Production , Purification , and Application )
Hybridoma Technology  ( Production , Purification , and Application  ) Hybridoma Technology  ( Production , Purification , and Application  )
Hybridoma Technology ( Production , Purification , and Application ) Sakshi Ghasle
 
Presiding Officer Training module 2024 lok sabha elections
Presiding Officer Training module 2024 lok sabha electionsPresiding Officer Training module 2024 lok sabha elections
Presiding Officer Training module 2024 lok sabha electionsanshu789521
 
Enzyme, Pharmaceutical Aids, Miscellaneous Last Part of Chapter no 5th.pdf
Enzyme, Pharmaceutical Aids, Miscellaneous Last Part of Chapter no 5th.pdfEnzyme, Pharmaceutical Aids, Miscellaneous Last Part of Chapter no 5th.pdf
Enzyme, Pharmaceutical Aids, Miscellaneous Last Part of Chapter no 5th.pdfSumit Tiwari
 
Crayon Activity Handout For the Crayon A
Crayon Activity Handout For the Crayon ACrayon Activity Handout For the Crayon A
Crayon Activity Handout For the Crayon AUnboundStockton
 
Introduction to ArtificiaI Intelligence in Higher Education
Introduction to ArtificiaI Intelligence in Higher EducationIntroduction to ArtificiaI Intelligence in Higher Education
Introduction to ArtificiaI Intelligence in Higher Educationpboyjonauth
 
BASLIQ CURRENT LOOKBOOK LOOKBOOK(1) (1).pdf
BASLIQ CURRENT LOOKBOOK  LOOKBOOK(1) (1).pdfBASLIQ CURRENT LOOKBOOK  LOOKBOOK(1) (1).pdf
BASLIQ CURRENT LOOKBOOK LOOKBOOK(1) (1).pdfSoniaTolstoy
 
Organic Name Reactions for the students and aspirants of Chemistry12th.pptx
Organic Name Reactions  for the students and aspirants of Chemistry12th.pptxOrganic Name Reactions  for the students and aspirants of Chemistry12th.pptx
Organic Name Reactions for the students and aspirants of Chemistry12th.pptxVS Mahajan Coaching Centre
 
Science 7 - LAND and SEA BREEZE and its Characteristics
Science 7 - LAND and SEA BREEZE and its CharacteristicsScience 7 - LAND and SEA BREEZE and its Characteristics
Science 7 - LAND and SEA BREEZE and its CharacteristicsKarinaGenton
 
18-04-UA_REPORT_MEDIALITERAСY_INDEX-DM_23-1-final-eng.pdf
18-04-UA_REPORT_MEDIALITERAСY_INDEX-DM_23-1-final-eng.pdf18-04-UA_REPORT_MEDIALITERAСY_INDEX-DM_23-1-final-eng.pdf
18-04-UA_REPORT_MEDIALITERAСY_INDEX-DM_23-1-final-eng.pdfssuser54595a
 
How to Make a Pirate ship Primary Education.pptx
How to Make a Pirate ship Primary Education.pptxHow to Make a Pirate ship Primary Education.pptx
How to Make a Pirate ship Primary Education.pptxmanuelaromero2013
 
Kisan Call Centre - To harness potential of ICT in Agriculture by answer farm...
Kisan Call Centre - To harness potential of ICT in Agriculture by answer farm...Kisan Call Centre - To harness potential of ICT in Agriculture by answer farm...
Kisan Call Centre - To harness potential of ICT in Agriculture by answer farm...Krashi Coaching
 
microwave assisted reaction. General introduction
microwave assisted reaction. General introductionmicrowave assisted reaction. General introduction
microwave assisted reaction. General introductionMaksud Ahmed
 
POINT- BIOCHEMISTRY SEM 2 ENZYMES UNIT 5.pptx
POINT- BIOCHEMISTRY SEM 2 ENZYMES UNIT 5.pptxPOINT- BIOCHEMISTRY SEM 2 ENZYMES UNIT 5.pptx
POINT- BIOCHEMISTRY SEM 2 ENZYMES UNIT 5.pptxSayali Powar
 
Interactive Powerpoint_How to Master effective communication
Interactive Powerpoint_How to Master effective communicationInteractive Powerpoint_How to Master effective communication
Interactive Powerpoint_How to Master effective communicationnomboosow
 
Alper Gobel In Media Res Media Component
Alper Gobel In Media Res Media ComponentAlper Gobel In Media Res Media Component
Alper Gobel In Media Res Media ComponentInMediaRes1
 
The basics of sentences session 2pptx copy.pptx
The basics of sentences session 2pptx copy.pptxThe basics of sentences session 2pptx copy.pptx
The basics of sentences session 2pptx copy.pptxheathfieldcps1
 
Introduction to AI in Higher Education_draft.pptx
Introduction to AI in Higher Education_draft.pptxIntroduction to AI in Higher Education_draft.pptx
Introduction to AI in Higher Education_draft.pptxpboyjonauth
 

Recently uploaded (20)

mini mental status format.docx
mini    mental       status     format.docxmini    mental       status     format.docx
mini mental status format.docx
 
Hybridoma Technology ( Production , Purification , and Application )
Hybridoma Technology  ( Production , Purification , and Application  ) Hybridoma Technology  ( Production , Purification , and Application  )
Hybridoma Technology ( Production , Purification , and Application )
 
Presiding Officer Training module 2024 lok sabha elections
Presiding Officer Training module 2024 lok sabha electionsPresiding Officer Training module 2024 lok sabha elections
Presiding Officer Training module 2024 lok sabha elections
 
Enzyme, Pharmaceutical Aids, Miscellaneous Last Part of Chapter no 5th.pdf
Enzyme, Pharmaceutical Aids, Miscellaneous Last Part of Chapter no 5th.pdfEnzyme, Pharmaceutical Aids, Miscellaneous Last Part of Chapter no 5th.pdf
Enzyme, Pharmaceutical Aids, Miscellaneous Last Part of Chapter no 5th.pdf
 
Crayon Activity Handout For the Crayon A
Crayon Activity Handout For the Crayon ACrayon Activity Handout For the Crayon A
Crayon Activity Handout For the Crayon A
 
Introduction to ArtificiaI Intelligence in Higher Education
Introduction to ArtificiaI Intelligence in Higher EducationIntroduction to ArtificiaI Intelligence in Higher Education
Introduction to ArtificiaI Intelligence in Higher Education
 
BASLIQ CURRENT LOOKBOOK LOOKBOOK(1) (1).pdf
BASLIQ CURRENT LOOKBOOK  LOOKBOOK(1) (1).pdfBASLIQ CURRENT LOOKBOOK  LOOKBOOK(1) (1).pdf
BASLIQ CURRENT LOOKBOOK LOOKBOOK(1) (1).pdf
 
Organic Name Reactions for the students and aspirants of Chemistry12th.pptx
Organic Name Reactions  for the students and aspirants of Chemistry12th.pptxOrganic Name Reactions  for the students and aspirants of Chemistry12th.pptx
Organic Name Reactions for the students and aspirants of Chemistry12th.pptx
 
Science 7 - LAND and SEA BREEZE and its Characteristics
Science 7 - LAND and SEA BREEZE and its CharacteristicsScience 7 - LAND and SEA BREEZE and its Characteristics
Science 7 - LAND and SEA BREEZE and its Characteristics
 
18-04-UA_REPORT_MEDIALITERAСY_INDEX-DM_23-1-final-eng.pdf
18-04-UA_REPORT_MEDIALITERAСY_INDEX-DM_23-1-final-eng.pdf18-04-UA_REPORT_MEDIALITERAСY_INDEX-DM_23-1-final-eng.pdf
18-04-UA_REPORT_MEDIALITERAСY_INDEX-DM_23-1-final-eng.pdf
 
How to Make a Pirate ship Primary Education.pptx
How to Make a Pirate ship Primary Education.pptxHow to Make a Pirate ship Primary Education.pptx
How to Make a Pirate ship Primary Education.pptx
 
Código Creativo y Arte de Software | Unidad 1
Código Creativo y Arte de Software | Unidad 1Código Creativo y Arte de Software | Unidad 1
Código Creativo y Arte de Software | Unidad 1
 
Kisan Call Centre - To harness potential of ICT in Agriculture by answer farm...
Kisan Call Centre - To harness potential of ICT in Agriculture by answer farm...Kisan Call Centre - To harness potential of ICT in Agriculture by answer farm...
Kisan Call Centre - To harness potential of ICT in Agriculture by answer farm...
 
microwave assisted reaction. General introduction
microwave assisted reaction. General introductionmicrowave assisted reaction. General introduction
microwave assisted reaction. General introduction
 
POINT- BIOCHEMISTRY SEM 2 ENZYMES UNIT 5.pptx
POINT- BIOCHEMISTRY SEM 2 ENZYMES UNIT 5.pptxPOINT- BIOCHEMISTRY SEM 2 ENZYMES UNIT 5.pptx
POINT- BIOCHEMISTRY SEM 2 ENZYMES UNIT 5.pptx
 
Interactive Powerpoint_How to Master effective communication
Interactive Powerpoint_How to Master effective communicationInteractive Powerpoint_How to Master effective communication
Interactive Powerpoint_How to Master effective communication
 
9953330565 Low Rate Call Girls In Rohini Delhi NCR
9953330565 Low Rate Call Girls In Rohini  Delhi NCR9953330565 Low Rate Call Girls In Rohini  Delhi NCR
9953330565 Low Rate Call Girls In Rohini Delhi NCR
 
Alper Gobel In Media Res Media Component
Alper Gobel In Media Res Media ComponentAlper Gobel In Media Res Media Component
Alper Gobel In Media Res Media Component
 
The basics of sentences session 2pptx copy.pptx
The basics of sentences session 2pptx copy.pptxThe basics of sentences session 2pptx copy.pptx
The basics of sentences session 2pptx copy.pptx
 
Introduction to AI in Higher Education_draft.pptx
Introduction to AI in Higher Education_draft.pptxIntroduction to AI in Higher Education_draft.pptx
Introduction to AI in Higher Education_draft.pptx
 

Redline charter school report

  • 1. 1 Charter School Annual Report 2019 Executive Summary North Carolina state statute requires an annual reporting of charter school performance, impact on district schools, best practices and other factors. The North Carolina State Board of Education (SBE), Charter Schools Advisory Board (CSAB), and Office of Charter Schools (OCS) welcome this opportunity to reflect on the successes and challenges encountered in the charter sector over the past year, and to chart a path towards high academic outcomes for all students as embodied in the first two purposes of the charter legislation. The demand for charter schools continues to grow, as evidenced by the growth in charter enrollment. More than 110,000 North Carolina students are enrolled in charter schools, totaling 7.6% of the total public school population. Self-reported data from the state’s charter schools indicate that 65,000 students were on waitlists for charter school admission.* This report gives updates on charter school enrollment, academic performance, best practices, and the impact of charter school on districts. It also highlights the benefits of our State receiving the competitive Federal Charter School Program Grant of $26 million, and a further supplemental grant of $10 million, over 5 years. As the charter school movement in North Carolina continues to grow it is important to do further analysis on the counties’ financial savings as counties do not pay for any facility costs. Charter schools continually operate with less per pupil government funding than district schools, with capital expenditures accounting for much of the disparity in funding. Charter school facility investments funded outside of the county tax base is conservatively estimated at over $1 billion. Relatedly, as district per pupil funding varies across the state, the amount of local funding per charter school student also varies. The North Carolina State Board of Education and the North Carolina General Assembly have each provided critical supports to ensure accountability, oversight, and autonomy in the state’s 196 charter schools. We look forward to continued partnership to high-quality expanded choices in the charter sector as charter schools meet measurable student achievement results through its performance based accountability systems. *Figure may include duplicates, as students are often waitlisted at multiple charter schools. Deleted: 2020 Deleted: ¶ *Insert Official Title Page Here*¶ Deleted: traditional public Deleted: This report highlights areas for charter school growth and improvement, and provides examples of best practices resulting from charter school operations. ¶ Deleted: Charter schools will need continued support, both in curriculum and instruction as well as financial resources (i.e. state transportation funding), as they work to eliminate barriers to enrollment and to provide high-quality academic opportunities for all students. With the funds available through the 23.4 million federal CSP grant in conjunction with the additional $10 million in supplemental funding offered, OCS is confident that the number of high-quality charter schools serving economically disadvantaged students will increase.¶
  • 2. 2 Table of Contents Legislation and Historical Background................................................................................. 3 Charter School Oversight in North Carolina.......................................................................... 5 Charter School Student Enrollment....................................................................................... 8 2019 Charter Sector Growth and Sustainability.....................................................................12 2019 Legislative Updates ......................................................................................................16 Office of Charter School Updates .........................................................................................17 Charter School Academic Performance ................................................................................19 Charter School Impact on Local Districts ............................................................................46 Ensuring Autonomy and Accountability ..............................................................................50 Best Practices Resulting from Charter School Operations ...................................................52 Charter Schools Receiving Special Awards and Recognition................................................54 Appendices...........................................................................................................................55 Deleted: 11 Deleted: 15 Deleted: 16 Deleted: 18 Deleted: 44 Deleted: 48 Deleted: 50 Deleted: 52 Deleted: 53
  • 3. 3 Tables and Figures Table 1. 2019 Charter School Advisory Board Members Table 2. Office of Charter School Workflows/Responsibilities Table 3. Charter School Student Demographics Table 4. Charter Schools Requesting to Implement Weighted Lotteries Table 5. Charter Schools Approved in 2018 Application Cycle Table 6. 2019 Charter Renewals Table 7. 2018-19 School Grades for Charter and Non-Charter Schools Table 8. 2018-2019 Charter School Performance Grade Trends Table 9. School Performance Grade Trends: Schools Earning a C or Higher Table 10. School Performance Grade Trends: Charter Schools Earning a D or F Table 11. 2018-19 Charter and Non-Charter Growth Comparison Table 12. Number and Percentage of Schools At or Above 60% Grade Level Proficient and College/Career Ready Table 13. Low-Performing/Continually Low-Performing Charter School Trends Table 14. Number of Charters Approved, Opened, Closed and Total State Funds Allotted Table 15. LEAs with at Least 13% of Students Enrolled in Charter Schools Table 16. SBE Districts/Regions and Total Charter Membership Figure A. School Performance Grade Trends: Number of A & B Charter Schools Since 2014-2015 Figure B. Bar Graph of School Performance Grade Trends of Charter Schools Earning a C or Higher Over Past Five Years Figure C. School Performance Grade Trends: Charter Schools Earning a D or F Figure D. School Performance Grades and the Percentage of ED Students Tested Figure E. School Performance Grades and the Length of Time in Operation Figure F. Charter School Growth Trends Over Past Five Years Figure G. 2018-2019 Charter/District School Growth Status and Percentage of ED Students Tested Figure H. Academic Growth with Economically Disadvantaged Students Figure I. Academic Growth with English Learners Figure J. Academic Growth with Students with Disabilities Figure K. Academic Growth with Students of Color Figure L. Charter School Growth Status and Length of Time in Operation Figure M. Total Number of LP/CLP Charter Schools - Three Year Trend Figure N. Percent of Students Scoring a Level 3 or Above on ELA EOC/EOG Figure O. Percent of Students Scoring a Level 3 or Above on English Language Arts EOG Figure P. Percent of Students Scoring a Level 3 or Above on English/Language Arts EOG Figure Q. Percent of Students Scoring a Level 3 or Above on English/Language Arts EOC Figure R. Percent of Students Scoring a Level 3 or Above on Math EOC/EOG Figure S. Elementary School Subgroup Comparison Figure T. Middle School Subgroup Comparison Figure U. High School Subgroup Comparison Figure V. Percent of Students Scoring a Level 3 or Above on Science EOC/EOG Figure W. Elementary School Subgroup Comparison Figure X. Middle School Subgroup Performance Figure Y. High School Subgroup Performance Figure Z. Percent of Students Meeting UNC 2017 ACT Benchmark Figure AA. Percentage of Public School Students in Membership at Charter Schools Figure AB. North Carolina State Board of Education Districts
  • 4. 4 Legislation and Historical Background In 1996, the North Carolina General Assembly passed the Charter School Act, thereby authorizing the establishment of “a system of charter schools to provide opportunities for teachers, parents, pupils, and community members to establish and maintain schools that operate independently of existing schools, as a method to accomplish all of the following: 1. Improve student learning; 2. Increase learning opportunities for all students, with special emphasis on expanded learning experiences for students who are identified as at-risk of academic failure or academically gifted; 3. Encourage the use of different and innovative teaching methods; 4. Create new professional opportunities for teachers, including the opportunity to be responsible for the learning at the school site; 5. Provide parents and students with expanded choices in the types of educational opportunities that are available within the public school system; 6. Hold the schools established under this Part accountable for meeting measurable student achievement results and provide the schools with a method to change from rule-based to performance-based accountability systems.” Current statute sets the parameters for how the system of charter schools must operate. The law includes the following sections: § Purpose of charter schools; establishment of North Carolina Charter Schools Advisory Board and North Carolina Office of Charter Schools § Eligible applicants; contents of applications; submission of applications for approval § Opportunity to correct applications; opportunity to address Advisory Board § Fast-track replication of high-quality charter schools § Final approval of applications for charter schools § Review and renewal of charters § Material revisions of charters § Nonmaterial revisions of charters § Charter school exemptions § Charter school operation § Civil liability and insurance requirements § Open meetings and public records § Accountability; reporting requirements to State Board of Education § Charter school facilities § Charter school transportation § Admission requirements § Charter school nonsectarian § Nondiscrimination in charter schools § Student discipline § Driving eligibility certificates § General operating requirements § Display of the United States and North Carolina flags and the recitation of the Pledge of Allegiance § Course of study requirements § Employment requirements
  • 5. 5 § Identification of low-performing and continually low-performing schools § Causes for nonrenewal or termination; disputes § Dissolution of a charter school § State and local funds for a charter school § Notice of the charter school process; review of charter schools § Operation of NC Pre-K programs Finally, G.S. 115C-218.110 directs that the State Board “shall report no annually no later than February 15 to the Joint Legislative Education Oversight Committee on the following: 1) The current and projected impact of charter schools on the delivery of services by the public schools. 2) Student academic progress in charter schools as measures, where available, against the academic year immediately preceding the first academic year of the charter schools’ operation. 3) Best practices resulting from charter school operations. 4) Other information the State Board considers appropriate.” This report addresses this legislated reporting requirement. Charter School Oversight in North Carolina North Carolina State Board of Education Codified in NC General Statute as Article 14A of Chapter 115C (115C-218, et al,) the charter schools law assigns the State Board of Education the sole authority of charter school oversight in North Carolina, including but not limited to the approval of charter applications, the approval of material revisions to the charter agreement, and the renewal of charter agreements. North Carolina Charter Schools Advisory Board In 2013, the North Carolina Charter Schools Advisory Board (CSAB) was created in statute, with four expressed powers and duties: A. To make recommendations to the State Board of Education on the adoption of rules regarding all aspects of charter school operation, including timelines, standards, and criteria for acceptance and approval of applications, monitoring of charter schools, and grounds for revocation of charters. B. To review applications and make recommendations to the State Board for final approval of charter applications. C. To make recommendations to the State Board on actions regarding a charter school, including renewals of charters, nonrenewals of charters, and revocations of charters. D. To undertake any other duties and responsibilities as assigned by the State Board. The CSAB is comprised of 11 voting members; four appointed by the North Carolina Senate, four appointed by the North Carolina House of Representatives, two appointed by the State Board of Education, and the Lieutenant Governor or the Lieutenant Governor’s designee. The Superintendent of Public Instruction or the Superintendent’s designee, serves as the secretary of the board and a nonvoting member. Appointed members serve four-year terms, and are limited to serving no more than eight consecutive years. In 2019, three new members were appointed to the
  • 6. 6 CSAB to fill vacant positions: Jeannette Butterworth, Joel Ford, and Rita Haire. The entire slate of CSAB members, their date of appointment, and their term is below. Table 1. 2019 Charter School Advisory Board Members Appointed By First Name Last Name County Start Date of Current Term End Date of Current Term Appointment State Board of Education Cheryl Turner Mecklenburg 2019 June 30, 2023 June 2019 SBE State Board of Education Alex Quigley Durham 2017 June 30, 2021 July 2017 SBE Superintendent - (Non-Voting) Joe Maimone Wake 2017 June 30, 2020 Superintendent Lt. Governor Steven Walker Wake 2017 December 31, 2020 Lt. Governor House Bruce Friend Wake 2017 June 30, 2021 SL 2018-139 House Lindalyn Kakadelis Mecklenburg 2017 June 30, 2021 SL 2017-75 House Lynn Kroeger Union 2017 June 30, 2021 SL 2017-75 House Heather Vuncannon Randolph 2019 June 30, 2023 SL 2019-122 Senate Sherry Reeves Pamlico 2017 June 30, 2021 SL 2017-75 Senate Jeannette Butterworth* Henderson 2019 June 30, 2021 SL 2018-139 Senate Rita Haire* Davidson 2017 June 30, 2021 SL 2019-233 Senate Joel Ford* Mecklenburg 2017 June 30, 2021 SL 2019-122 *Indicates board members who were appointed to fill unexpired term vacancies in 2019. Their terms will expire in 2021. Office of Charter Schools N.C. General Statute 115C-218(c) stipulates the establishment of the NC Office of Charter Schools, staffed by an executive director and additional personnel to carry out necessary duties. Pursuant to state statute, the Office of Charter Schools has the following powers and duties: A. Serve as staff to the Advisory Board and fulfill any tasks and duties assigned to it by the Advisory Board. B. Provide technical assistance and guidance to charter schools operating within the State. C. Provide technical assistance and guidance to nonprofit corporations seeking to operate charter schools within the State. D. Provide or arrange for training for charter schools that have received preliminary approval from the State Board. Deleted: 1
  • 7. 7 E. Assist approved charter schools and charter schools seeking approval from the State Board in coordinating services within the Department of Public Instruction. 1. Assist certain charter schools seeking to participate in the NC prekindergarten program in accordance with G.S. 115C-218.115. F. Other duties as assigned by the State Board. The Office of Charter Schools is currently staffed by six consultants, a program assistant, and an executive director, with office responsibilities divided into multiple workflows, each managed by an individual consultant. The current division of workflows within the office is as follows (listed alphabetically): Table 2. Office of Charter School Workflows/Responsibilities Workflow Responsibilities 1. Amendments/Risk Assessment/CSAB Planning Facilitates process of obtaining approval for any modifications to a school’s charter agreement, manages grievances and complaints from stakeholders, conducts site visits to schools falling out of academic, operational, or financial compliance, and organizes CSAB and SBE meetings. 2. Applications Facilitates the new school application process, provides training to applicants, hires and trains external evaluators, provides updates to CSAB members. 3. Communications Manages all internal and external communication between the Office of Charter Schools and the general public. 4. Performance Framework Facilitates the yearly collection and audit of documents from schools to ensure compliance with NC statute, SBE policy, and the Charter Agreement. 5. Planning Year/Ready-to-Open Process Provides training to newly approved schools prior to opening, reviews documentation to ensure compliance with statute, policy, and the Charter Agreement, provides CSAB with progress newly approved schools make towards a successful open. 6. Professional Development Plans and provides ongoing in-person and virtual training to currently operating schools. 7. Renewals Facilitates the charter renewal process. In addition, OCS consultants provide general guidance and technical support to each charter school in the state. Best practices indicate that in order to provide the highest quality oversight and support, the ratio of charter office staff to schools should be approximately one consultant to eight schools. North Carolina currently has 196 charter schools in operation, and the Office of Charter Schools is staffed by six consultants, which results in a ratio of one consultant providing support to approximately 33 schools.
  • 8. 8 Charter School Student Enrollment State statute originally capped at 100 the number of charter schools that could operate in the state in a given school year, but the N.C. General Assembly removed that ceiling in August 2011. Since then, the number of charter schools in the state has grown from 100 to 196 (as of September 2019). 194 are brick-and-mortar charter schools operating in 67 different local education agencies, and two are virtual charter schools. Both virtual charter schools have brick-and-mortar headquarters in Durham county. According to the second month Average Daily Membership (ADM) figures certified in November 2019, 116,316 students are now being served by charter schools. This represents 7.6% of the total public school population (1,526,144). Table 3. Charter School Student Demographics 2018-2019 School Year Charter Traditional All Race/Ethnicity/Gender # % # % # % Total White 59,703 54.0% 671,727 47.3% 731,430 47.8% Total Black 28,676 26.0% 355,201 25.0% 383,877 25.1% Total Hispanic 11,845 10.7% 262,894 18.5% 274,739 17.9% Other 10,240 9.3% 131,459 9.2% 141,699 9.3% Male 55,189 50.0% 730,619 51.4% 785,808 51.3% Female 55,275 50.0% 690,662 48.6% 745,937 48.7% Total Enrollment 110,464 100.0% 1,421,281 100.0% 1,531,745 100.0% A Closer Look at Racial/Ethnic Diversity in Charter Schools N.C. General Statute 115C-218.45(e) states, “within one year after the charter school begins operation, the charter school shall make efforts for the population of the school to reasonably reflect the racial and ethnic composition of the general population residing within the local school administrative unit in which the school is located or the racial and ethnic composition of the special population that the school seeks to serve residing within the local school administrative unit in which the school is located.” To give appropriate insight on the extent to which charter schools reasonably reflect the areas in which they are located, significant research would need to be conducted to disaggregate the racial and ethnic breakdown of traditional schools and charter schools serving diverse communities within all LEAs in the state. Special Population Student Enrollment Students with Disabilities In the 2018-19 school year, charter schools enrolled 11,455 students with disabilities, which represented 10.34% of the total charter school enrollment at that time. During the same period, Deleted: To gain insight on the extent to which charter schools reasonably reflect the areas in which they are located, charter school racial demographics were compared first to the racial demographics of the school district in which they are located, and secondly to the racial demographics of the general population of the county in which they are located. Because the virtual charter schools enroll students from across the state, they were compared to the state of North Carolina demographics, instead of the county in which they are headquartered. District demographic data was collected from the Statistical Profile Online database, and geographic county data was collected from the 2017 U.S. Census Bureau American Community Survey. Charter schools whose demographics were +/- 10 points of the district or county were considered to “reasonably reflect” the comparison group.¶ ¶ Charter/District Comparisons¶ White Student Enrollment¶ Out of 185 schools that were in operation last year, 47 schools (25%) had a White student enrollment within 10% points of the White student enrollment of the district in which the school is located.¶ ¶ When comparing White student enrollment to the non- Hispanic White demographics of the general population, the percentage of charter schools with an enrollment within 10% points of the general population is 36.8% (68 schools).¶ ¶ Black Student Enrollment¶ Seventy-nine schools (43%) had a Black student enrollment within 10% points of the Black student enrollment of the local district. ¶ ¶ Seventy-seven schools (42%) had a Black, non-Hispanic student enrollment within 10% points of the general population of their geographic county.¶
  • 9. 9 district schools enrolled 176,837 students with disabilities, which represented 12.53% of total district school enrollment (not including enrollment at DOJ, NC HHS, and NC DJJ schools). English Learners Based on the October 1, 2018 headcount, charter schools enrolled 3,612 English Learners, and LEAs enrolled 112, 745 English Learners. Economically Disadvantaged Students It is important to note that the ED student data (collected through NCDPI Testing and Accountability Services) is self-reported by charter schools. While charter schools do certify to NCDPI that the numbers they report are accurate, some schools have expressed concern that since they must ask families to self-report income information to verify ED status, the figures may underrepresent the true ED population in a given school and across all charter schools. Charter schools that do not participate in the National School Lunch Program, and therefore do not have that participation rate to use as a proxy for ED status, may be most likely to report figures that underrepresent the true ED population at their schools. Improvements to this data collection are being implemented through the Direct Certification System. At its December meeting, the CSAB dedicated a significant amount of time to discussing the challenges of defining economically disadvantaged, identifying economically disadvantaged students enrolled in charter schools, and the solutions other states have implemented to solve this issue. A DPI official led the discussion and began by clarifying that free- and reduced-price lunch eligibility is no longer the definition of economically disadvantaged. In terms of federal or state reporting, economically disadvantaged is a subcategory and individual-level data is required to report this figure. If schools are not participating in a Community Eligibility Program (CEP) or participating in the NSLP, then they will not have that data. Even if schools ask parents to self-report that information, self-reported data cannot be validated by DPI, which is a requirement for federal reporting and auditing. DPI has applied for a grant for a longitudinal data study to figure out how to calculate the economically disadvantaged population. OCS, CSAB, and DPI continue to work together to more accurately capture the percentage of economically disadvantaged students enrolled in charter schools, particularly those charter schools that do not participate in the National School Lunch Program. As of November 2019, charter schools enrolled 22,069 economically disadvantaged students, which represents 18.8% of total charter school enrollment. Eliminating Barriers to Access Weighted Lotteries The ability to conduct a weighted lottery is codified in G.S. 115C-218.45(g1). Charter schools may not discriminate in their admissions process on the basis of race, creed, national origin, religion, or ancestry; however, they are allowed to utilize additional controls to enroll underserved populations, if supported by the school’s mission. In 2018, North Carolina was awarded a federal Charter Schools Program grant to increase educationally disadvantaged student access to high quality charter schools in the state. One stipulation that North Carolina wrote into the grant application is that subgrantees would agree to Deleted: traditional public Deleted: traditional public Commented [AD1]: EL headcount report only included raw numbers – did not include total enrollment so the percentage could not be calculated. Moved (insertion) [1] Deleted: Traditional public schools enrolled XX economically disadvantaged students, which represents XX% of total traditional public school enrollment. Deleted: ¶ Moved up [1]: It is important to note that the ED student data (collected through NCDPI Testing and Accountability Services) is self-reported by charter schools. While charter schools do certify to NCDPI that the numbers they report are accurate, some schools have expressed concern that since they must ask families to self-report income information to verify ED status, the figures may underrepresent the true ED population in a given school and across all charter schools. Charter schools that do not participate in the National School Lunch Program, and therefore do not have that participation rate to use as a proxy for ED status, may be most likely to report figures that underrepresent the true ED population at their schools. Improvements to this data collection are being implemented through the Direct Certification System.¶ Moved (insertion) [2] Commented [DT3]: IMO the CSP grant context is important here rt?
  • 10. 10 implement a weighted lottery. In 2019, the Office of Charter Schools saw a marked increase in the number of schools asking to amend their charter to include the use of a weighted lottery. Prior to 2019, six charter schools requested and received permission to implement a weighted lottery. In 2019, that number increased to 21, with nine schools being approved to amend their charter to include a weighted lottery, and six schools receiving approval to use weighted lotteries after requesting permission in their original charter applications. There has also been a marked increase in the number of schools including a weighted lottery in their initial charter application. In 2017, 14 applications were approved, and only one requested the use of a weighted lottery. In 2018, 11 applications were approved, and none requested the use of a weighted lottery. In 2019, the first year that grant funds were available to newly approved charter schools, fifteen applications were approved, and five schools requested the use of a weighted lottery in the initial charter application. The full list of schools with approval to implement weighted lotteries is below. Table 4. Charter Schools Requesting to Implement Weighted Lotteries School Name Amendment/Policy Approval Original App or Amendment? Central Park School for Children Jan-13 Amendment Community School of Davidson Mar-16 Amendment Charlotte Lab School Jan-17 Amendment GLOW Academy Jan-17 Amendment Raleigh Oak Charter School Jul-18 Original App The Exploris School Oct-18 Amendment Moore Montessori Community School Jan-19 Amendment Movement East Charter School May-19 Amendment IC Imagine May-19 Amendment Willow Oak Montessori Jul-19 Amendment MINA Charter School of Lee County Jul-19 Amendment Evergreen Community Charter Jul-19 Amendment Pocosin Innovative Charter Jul-19 Amendment Alamance Community School Oct-19 Original App Tillery Charter Academy Nov-19 Amendment Wake Preparatory Academy Nov-19 Amendment East Voyager Academy Nov-19 Amendment Hobgood Charter School Original App North Raleigh Charter Academy Original App Wendell Falls Charter Original App Wilmington School of the Arts Original App Transportation Deleted: ¶ ¶
  • 11. 11 N.C. General Statute 115C-218.40 states that a charter school “may provide transportation enrolled at the school. The charter school shall develop a transportation plan so that transportation is not a barrier to any student who resides in the local school administrative unit in which the school is located.” In 2017, S.L. 2017-57 appropriated $2.5 million to the Charter School Transportation Grant. Grant awards were available to schools where 50% or more of the student population was economically disadvantaged. These grant funds were not renewed for the following year. Providing transportation is a costly endeavor for charter schools, and those providing transportation receive minimal financial resources to do so. The charter schools providing transportation are often the schools with the most racially and socioeconomically diverse student populations. The dearth of transportation funds provided to charter schools often forces schools to make significant financial trade-offs. Adequate transportation funding is critical to ensuring that charter schools are accessible to all students, regardless of their ability to provide their own transportation to and from school. As of November 2019, 98 charter schools (50% of all charter schools in the state) indicated that they provide bus transportation for students. 61% of schools that have been open for 1-5 years provide bus transportation. 41% of schools that have been open for 6-10 years provide bus transportation. 50% of schools that have been open for 11-15 years provide bus transportation. 33% of schools that have been open for 16-20 years provide transportation. 58% of schools that have been open for 21+ years provide bus transportation. Child Nutrition Charter schools in North Carolina are not required to participate in the National School Lunch Program, however, similar to the transportation plan provision, they are required to have a plan that ensures that every child who needs lunch provided will receive a meal. During the application interview process, the CSAB asked detailed questions about how the school will provide lunch for all students who need it. As of November 2019, 61 charter schools (31% of all charter schools) are participants in the National School Lunch Program, and the remainder have alternative plans to provide lunch. Often times, smaller charter schools find the amount of paperwork required to participate in the NSLP prohibitive, and opt to provide lunch for students through other means. The Francine Delaney New School for Children has been lauded for its innovative approach to providing lunch for its students. The school has partnered with local grocers and provides a monthly voucher to the parents of students qualifying for free or reduced priced lunch. The vouchers are then used to buy lunch for students to bring to school. Formatted: Font: Deleted: .¶ ¶
  • 12. 12 2019 Charter Sector Growth and Sustainability 2018 Charter Application Updates During the 2018 application cycle, thirty-five applications were submitted for new charter schools- sixteen applications were submitted for Fast-Track Replication or Acceleration. The Office of Charter Schools screened each application for completeness, and the applicant groups with incomplete applications were given five days to submit or clarify incomplete items. Of the thirty-five applications submitted, six applications were withdrawn prior to receiving a recommendation from the CSAB. Of the remaining 29 applications, fifteen received favorable recommendations from the CSAB and were approved by the State Board of Education. Three of the fifteen schools requested and received approval to open on an accelerated timeline. Each of the approved schools is listed below. Table 5. Charter Schools Approved in 2018 Application Cycle School Name County Approved Special Request Alamance Community School Alamance N/A Achievement Charter Academy Harnett N/A CE Academy Wake N/A CFA Community Public Charter Gaston Acceleration Doral Academy of North Carolina Wake Replication Elaine Riddick Charter Perquimans N/A Hobgood Charter Academy Halifax Acceleration MINA Charter School of Lee County Lee N/A North Raleigh Charter Academy Wake Replication Pocosin Innovative Charter School Washington Acceleration Revolution Academy Guilford N/A Robert J. Brown Leadership Academy Guilford N/A Wake Preparatory Academy Wake Replication Wendell Falls Charter Academy Wake Replication Wilmington School of the Arts New Hanover N/A The three schools approved to open on an accelerated timeline successfully opened in August/September 2019, and 11 of the 12 approved schools are in their planning year. One school, Robert J. Brown Leadership Academy, elected to relinquish their charter prior to beginning the planning year process. 2019 Charter Application Updates Prior to the 2019 charter application cycle, the CSAB recommended a number of changes to the application timeline and process to the State Board of Education. Among them, a separate, earlier deadline for Fast-Track and Acceleration applications, and a stipulation that applications requesting Fast-Track or Acceleration only be considered for opening on an accelerated timeline, as opposed to being considered to open on a traditional timeline, should they not meet the requirements for Fast- Track Replication or Acceleration. The State Board of Education approved the recommended changes to the charter application timeline and process at its April 2019 meeting. During the 2019 application cycle, five applications were submitted for Fast-Track Replication or Acceleration, and fourteen applications were submitted for the Traditional timeline. Of the five Moved up [2]: Weighted Lotteries¶ The ability to conduct a weighted lottery is codified in G.S. 115C-218.45(g1). Charter schools may not discriminate in their admissions process on the basis of race, creed, national origin, religion, or ancestry; however, they are allowed to utilize additional controls to enroll underserved populations, if supported by the school’s mission. ¶ In 2018, North Carolina was awarded a federal Charter Schools Program grant to increase educationally disadvantaged student access to high quality charter schools in the state. One stipulation that North Carolina wrote into the grant application is that subgrantees would agree to implement a weighted lottery. In 2019, the Office of Charter Schools saw a marked increase in the number of schools asking to amend their charter to include the use of a weighted lottery. Prior to 2019, six charter schools requested and received permission to implement a weighted lottery. In 2019, that number increased to 21, with nine schools being approved to amend their charter to include a weighted lottery, and six schools receiving approval to use weighted lotteries after requesting permission in their original charter applications. The full list of schools with approval to implement weighted lotteries is below.¶ ¶ ¶ ¶ Table 4. Charter Schools Requesting to Implement Weighted Lotteries¶ School Name Deleted: ¶ ¶ ¶
  • 13. 13 applications submitted to open on an accelerated timeline, one received approval from the State Board of Education. The CSAB has conducted a preliminary review of the fourteen applications submitted for the Traditional timeline, and nine were invited for full interviews. The CSAB will conduct full interviews and forward their recommendations to the SBE by their April meeting, per SBE policy CHTR-012. The SBE will make final decisions regarding approval by August 15. Eleven of the nineteen applications were for schools in urban districts and surrounding areas: § Mecklenburg County (6 applicants) § Wake County (2 applicants) § Guilford County (2 applicants) § Durham County (1 applicants) Charter Application Approval Rate Trends The charter application approval rate over the past five years has increased from 14% of applications being approved in 2014 to 43% percent of applications being approved in 2019. 2014: 71 applications submitted; 10 approved (14% approval rate) 2015: 40 applications submitted; 14 approved (35% approval rate) 2016: 28 applications submitted; 8 approved (29% approval rate) 2017: 38 applications submitted; 14 approved (37% approval rate) 2018: 29 applications submitted; 11 approved (38% approval rate) 2019: 35 applications submitted: 15 approved (43% approval rate) The 2019-2020 application cycle interview phase will conclude in January 2020, and the CSAB’s preliminary recommendations will be forwarded to the SBE thereafter. 2019 Ready-to-Open Updates In 2018-19, 16 schools participated in the Planning Year process. Two of the sixteen schools requested a one-year delay, and were approved delay their opening until 2020. Fourteen schools completed the Planning Year process and were deemed Ready-to-Open. These schools opened in the fall of 2019. Of the fourteen schools that opened, ten opened with fewer than 75% of their approved ADM. The chart contained in Appendix A outlines each of the fourteen schools that opened, the approved year 1 maximum enrollment, the initial year 1 enrollment requested in the charter application, the self-reported enrollment as of September 2019, the school’s breakeven enrollment number, their actual month 1 funded ADM, and the funded percentage of the school’s approved or amended maximum enrollment. 2019 Charter Renewal Updates Thirty-two schools were considered for renewal in 2019. The SBE-approved renewal policy is in Appendix B. Of the 32 schools considered for renewal, the CSAB recommended a ten-year renewal for 21 schools, a seven-year renewal for two schools, a five-year renewal for one school, a three-year renewal for 7 schools, and non-renewal for one school. With the exception of two schools, the SBE accepted all of the CSAB’s recommendations. The two ALS alternative high schools were recommended to receive 10-year renewals but were approved for 7-year renewals by the NC State Board of Education, with the stipulation that the OCS develop a framework for evaluating the success of schools with alternative status. Deleted: X Deleted: ¶ Deleted: X
  • 14. 14 Table 6. 2019 Charter Renewals SBE-Approved Renewal Term School Name 10 Years American Renaissance School Anderson Creek Academy Cardinal Charter Envision Science Academy Evergreen Community Forsyth Academy Greensboro Academy Invest Collegiate - Imagine Quest Academy Raleigh Charter High School Research Triangle Charter South Brunswick Charter The Franklin School of Innovation The Mountain Community School Thomas Jefferson Classical Academy Vance Charter School Wake Forest Charter School Wayne Preparatory Academy Wilson Preparatory Academy 7 Years Bradford Preparatory School Commonwealth High School (Alternative High School) Pioneer Springs Community School Stewart Creek High School (Alternative High School) 5 Years The Capitol Encore Academy 3 Years A.C.E. Academy Carter Community Charter Dillard Academy Haliwa-Saponi Tribal School Lakeside Charter Academy Reaching All Minds Academy United Community Charter Non-Renewal Charlotte Learning Academy 2020 Charter Renewal Updates Nineteen schools are being considered for renewal in 2020. The CSAB voted on renewal recommendations for each school in December 2019, and their recommendations will be forwarded to the SBE in January 2020. Charter School Closure and Relinquishment Updates Due to low academic performance, Charlotte Learning Academy was recommended for a nonrenewal of its charter and closed effective June 30, 2019. The non-profit board operating Hope Charter Academy voted to relinquish their charter effective June 30, 2019.
  • 15. 15 Anson Charter requested a second delay and was denied by the CSAB. The school’s governing board subsequently voted to relinquish their charter, and the SBE approved the relinquishment at its April 2019 meeting.
  • 16. 16 2019 Legislative Updates S.L. 2019-51: Created a term “public school unit” in Chapter 115C to include all types of public schools in the state, including charter schools. S.L. 2019-82: Amended G.S. 115C-218.85(a) and now requires charter schools to provide financial literacy instruction as required by the State Board of Education, including required professional development for teachers of the financial literacy course. S.L. 2019-122: Appointed Joel Ford to the Charter School Advisory Board to fill the unexpired term of Alan Hawkes, and re-appointed Heather Vuncannon for another full term. S.L. 2019-165: Made various changes to laws related to education. Officially changed the reporting date for the annual charter school report to February 15. S.L. 2019-222: Appropriated funds for school safety. School resource officer grants are to be made available to qualifying school units – including charter schools – to improve school safety. S.L. 2019-71: Modified teacher licensure requirements. S.L. 2019-154: Adopted a 15-point scale in the determination of school performance grades.
  • 17. 17 Office of Charter School Updates NC ACCESS Grant In 2018, the North Carolina Department of Public Instruction (NCDPI) was awarded a Public Charter Schools Program (CSP) grant from the U.S. Department of Education (USDOE) of approximately $26,600,000. The CSP grant is currently being used to implement the North Carolina Advancing Charter Collaboration and Excellence for Student Success (NC ACCESS) Program to: 1. Increase the number of educationally disadvantaged students attending high-quality charter schools and expand the number of high-quality charter schools available to educationally disadvantaged students; 2. Develop a cohort of one hundred (100) charter school leaders who can develop and demonstrate best practices in serving educationally disadvantaged students; and 3. Broadly disseminate best practices in serving educationally disadvantaged students and foster collaboration in the charter school community and between charter schools and district schools. NC ACCESS Progress to Date: 1. ACCESS team has been fully staffed and consists of a Grant Administrator, Program Coordinator, Technical Assistance Specialist, and Finance Administrator. 2. Nine subgrants, totaling $3.4 million, were awarded in the first application cycle. This includes three Planning and Implementation subgrants, four Implementation subgrants, and one Expansion subgrant. 3. ACCESS Fellowship was launched. Four workshops have been held; three in-person and one virtual. Topics covered include school culture and design, parent and community engagement, leadership and empowering teacher leaders, intentional marketing and recruitment, and addressing adverse childhood experiences and the socioemotional learning needs of students. 4. ACCESS team applied for and received $10 million supplemental grant to further expand the reach of the program, and to support low-performing charter schools across the state. Team will now be able to award 10 additional subgrants (60 instead of 50) over the life of the CSP grant. 5. ACCESS team is piloting a Visiting Fellows program for leaders of low-performing schools. These leaders will participate in the ACCESS fellowship and have access to all resources and support provided through that initiative. 6. ACCESS team received approval to expand the eligibility criteria to better serve schools and to expand the reach of the program. Epicenter S.L. 2017-57 mandated that funds be used to support the purchase of a Web-based electronic records and data management system to automate and streamline reporting and accountability requirements to assist the Office of Charter Schools in complying with annual reporting obligations. OCS has adopted Epicenter for this purpose and has worked with representatives from the National Charter Schools Institute to train school leaders on the use of the platform. Over the past year, each workflow within OCS has transitioned to the Epicenter platform. All charter-related documents are now submitted or collected via the Epicenter portal. OCS Deleted: traditional public
  • 18. 18 consultants are working with multiple divisions within NCDPI that have expressed interest in also collecting and reviewing documentation through Epicenter. Professional Development The Office of Charter Schools continues to welcome feedback in order to better serve the professional learning needs of the charter school community and its stakeholders. Some of the opportunities this year included: • Office of Charter Schools Huddle West, July 2019 at Gray Stone Day School; • Office of Charter Schools Charter School Leadership Institute, October 17 & 18, 2019, at Envision Science Academy; • Leading & Learning Day (formerly known as LP/CLP training), September 26, 2019, at Healthy Start Academy, Durham; • For Counselors By Counselors: A network of support and professional learning for NC charter school counselors. This collaborative cohort works to unify knowledge and offer superior counselor support to students in our charter network; • Quick Takes: 15 minute pre-recorded webinars in topics of interest to the charter community; • Online professional development and renewal newsletters, through S’more have been very well received and widely read; • Increased collaboration and professional learning within and across NC DPI divisions; • Number of Twitter/Social Media followers has increased and professional learning is actively promoted on our Twitter feed; • Epicenter is now being used as a resource for professional learning as well through an application called OCS Professional Learning Resource Center, which will serve as a ‘library’ of professional learning resources; • Charter School Teacher of the Year is Ms. Ashley Bailey of Roxboro Community School; • NCCAT inaugural Beginning Teacher of the Year award had three (3) charter school teachers in the running for Beginning Teacher of the Year.
  • 19. 19 Charter School Academic Performance The sixth legislative purpose of charter schools outlined in G.S. 225C-218 is to “hold schools established under this Part accountable for meeting measurable student achievement results and provide the schools with a method to change from rule-based to performance-based accountability systems.” This section of the Annual Report examines the student achievement results of North Carolina’s charter schools. Please note that this reporting includes data from North Carolina’s two virtual charter schools, which are both currently in pilot status. With the exception of schools operating under an alternative status, all public schools are assigned School Performance Grades (A-F) based on test scores, and for high schools, additional indicators that measure college and career readiness. School Performance Grades are based on student proficiency (80%) and growth (20%). Table 7. 2018-19 School Grades for Charter and Non-Charter Schools Charter Non-Charter All Grade # % # % # % A 20 11% 183 7% 203 8% B 59 32% 686 28% 745 29% C 53 29% 991 40% 1044 41% D 34 18% 426 17% 459 18% F 12 7% 79 3% 89 4% I 2 1% 12 1% 14 1% N/A 0 N/A 3 .1% 3 .1% Alternative 4 2% 90 4% 94 4% Total A-F 178 97% 2362 96% 2540 Total A and B 79 44% 869 37% 948 37% Total D and F 46 26% 502 21% 548 22% Total Schools 184 2467 2651 A “Closer Look” at Charter School Academic Proficiency and Growth The chart below depicts trends in charter school SPGs over the past five years. The percentage of charter schools earning Ds and Fs increased slightly from 2017-18 to 2018-19. The percentage of charter schools earning As and Bs also increased over the past year.
  • 20. 20 Table 8. 2018-2019 Charter School Performance Grade Trends 2014 – 15 2015 – 16 2016 – 17 2017 - 18 2018-19 Grade # % # % # % # % # % A+NG 12 8.5% 12 7.7% 11 6.7% A 7 4.9% 5 3.2% 5 3.1% 15 8.9% 20 11% B 50 35.2% 45 29.0% 55 33.7% 55 32.7% 59 32% C 31 21.8% 50 32.3% 51 31.3% 60 35.7% 53 29% D 24 16.9% 29 18.7% 28 17.2% 29 17.4% 34 18% F 18 12.7% 14 9.0% 13 8.0% 8 4.8% 12 7% Total 142 155 163 167 178 Figure A below depicts the charter school performance grade trends since 2014-2015. Table 9 presents the trends in charter schools earning a grade of C or higher over the past five years. This percentage was on the rise from 2014-15 until the most recent year, when the percentage of charter schools earning a C or higher decreased 6.1 percentage points. Figure B visually depicts the trends of charter schools earning a C or higher over the past five years. Table 10 contains the percentages of charter schools earning grades of D or F over the past five years, and Figure C visually depicts this trend. Formatted: Keep with next, Keep lines together
  • 21. 21 Figure A. School Performance Grade Trends: Number of A & B Charter Schools Since 2014- 2015 Table 9. School Performance Grade Trends: Schools Earning a C or Higher 2014 – 15 2015 – 16 2016 – 17 2017 – 18 2018-19 Percentage of C or Better Charter Schools 70.4% 72.3% 74.8% 77.8% 71.7% 7 5 5 15 20 50 45 55 55 59 14-15 15-16 16-17 17-18 18-19A B Formatted: Keep with next, Keep lines together
  • 22. 22 Figure B. Bar Graph of School Performance Grade Trends of Charter Schools Earning a C or Higher Over Past Five Years Table 10. School Performance Grade Trends: Charter Schools Earning a D or F 2014 – 15 2015 – 16 2016 – 17 2017 – 18 2018-19 Percentage of D and F Charter Schools 29.6% 27.7% 25.2% 22.2% 25% Figure C. School Performance Grade Trends: Charter Schools Earning a D or F 70.4 72.3 74.8 77.8 71.7 14-15 15-16 16-17 17-18 18-19 29.6 27.7 25.2 22.2 25 14-15 15-16 16-17 17-18 18-19
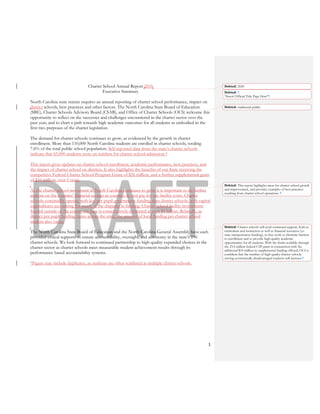
  • 23. 23 Additional Context for Charter School Performance Grades As discussed previously, school performance grades are based on a formula of 80% proficiency and 20% growth. To provide additional context around charter school performance, the next several graphs describe the percentage of economically disadvantaged students tested at charter schools earning school performance grades, as well as the average length of time charter schools earning school performance grades have been in operation. School Performance Grades and Economically Disadvantaged Students Figure D depicts the total number of charter schools receiving A-F letter grades. Within each bar, color-coded sections indicate the percentage of economically disadvantaged students tested at each school earning a particular letter grade. At the bottom of the graph is a key outlining the percentage of ED students each color represents. Figure D. School Performance Grades and the Percentage of ED Students Tested Of the 20 charter schools earning an A in 2018-2019, 19 (95%) served 20% or fewer economically disadvantaged students. Within this 19 schools, thirteen served student populations that were fewer than 5% EDS. Southeastern Academy served the largest percentage of ED students of all charter schools earning an A, at 39.3% EDS. 9% 0% 51% 1% 78% 9% 95% 39% 17% 15% 3% 21% 11% 17% 41% 5% 36% 33% 16% 29% 30% 6% 50% 3% 38% 22% 42% 56% 35% 51% 21% 35% 2% 11% 3% 8% 28% 12% 15% 2% 4% 1% 0% 10% 20% 30% 40% 50% 60% 70% 80% 90% 100% F (CS) F (DS) D (CS) D (DS) C (CS) C (DS) B (CS) B (DS) A (CS) A (DS) Percentage of Schools SchoolPerformanceGradeReceived 0-20% EDS 20.1-40% EDS 40.1-60% EDS 60.1-80% EDS 80.1-100% EDS Deleted: 19 46 1 10 2 1 0% 10% 20% 30% 40% 50% 60% 70% 80% 90% 100% A B PercentageofSchools School Perfo 0-20% EDS 21-40% EDS
  • 24. 24 Of the 183 district schools earning an A in 2018-2019, 72 (39%) served 20% or fewer economically disadvantaged students; 65 (36%) served 20.1-40% EDS; 40 (22%) served 40.1-60% EDS; 5 (3%) served 60.1-80% EDS; and 1 (.5%) served greater than 80% EDS. Of the 59 charter schools earning a B, 46 (or approximately 78%) served student populations that were 20% or fewer EDS. Ten of the 59 schools served between 20.1 – 40% EDS, and three served greater than 40% EDS (Alpha Academy – 49.3%, Bethel Hill Charter – 44%, and Sallie B. Howard – 61.1%). Of the 686 district schools earning a B, 64 (9%) served 20% or fewer EDS; 282 (41%) served 20.1- 40% EDS; 262 (38%) served 40.1-60% EDS; and 78 (11%) served 60.1-80% EDS. Of the 53 charter schools earning a C, 27 (51%) served 20% or fewer EDS. Eleven schools (21%) served between 20.1 – 40% EDS, 3 (6%) served between 40.1 – 60% EDS, and 11 (21%) served between 60.1 – 80% EDS. One school, Maureen Joy Charter, served greater than 80% ED students, with an ED population of at least 95%. Of the 991 district schools earning a C, 6 (.6%) served 20% or fewer EDS; 107 (11%) served 20.1- 40% EDS; 491 (50%) served 40.1-60% EDS; 345 (35%) served 60.1-80% EDS; and 42 (4%) served greater than 80% EDS. Of the 34 charter schools earning a D, three (10%) served 20% or fewer EDS. Five schools (15%) served between 20.1 – 40% EDS, and ten (29%) served between 40.1 – 60% EDS. Twelve schools (35%) served between 60.1 – 80% EDS, and four schools (12%) served greater than 80% EDS. Of the 426 district schools earning a D; 2 (.5%) served 20% or fewer EDS; 14 (3%) served 20.1 – 40% EDS; 129 (30%) served 40.1 – 60% EDS; 218 (51%) served 60.1 – 80% EDS; and 63 (15%) served greater than 80% EDS. Of the twelve charter schools earning an F, two (17%) schools served 20.1 – 40% EDS, four schools (33%) served 40.1 – 60% EDS, five schools tested 61 – 80% EDS, and one school (8%) served greater than 80% EDS. Of the 79 district schools earning an F, 13 (16%) served 40.1 – 60% EDS; 44 (56%) served 60.1 – 80% EDS; and 22 (28%) served greater than 80% EDS. School Performance Grades and Length of Time in Operation The bar graph in Figure E depicts the number of schools earning grades A-F and contains color- coding to identify the length of time schools earning each particular grade have been in operation. Deleted: Twenty charter schools earned an A in 2018-2019, as shown in the first column in the graph above. Of those twenty schools, nineteen (95%) tested between 0-20% economically disadvantaged students. For example, School A earned an A letter grade, and is one of the 19 schools that tested between 0- 20% economically disadvantaged students. If School A tested 100 students, between 0-20 of the tested students were identified as economically disadvantaged. ¶ ¶ Within the 0-20% EDS category of schools earning an A, thirteen of the nineteen schools tested student populations that were fewer than 5% EDS. Southeastern Academy tested the largest percentage of ED students of all schools earning an A, at 39.3% EDS.¶ ¶ Of the 59 charter schools earning a B, 46 (or approximately 78%) tested student populations that were between 0 – 20% EDS. Ten of the 59 schools tested between 20.5 – 40% EDS, and three tested greater than 40% EDS (Alpha Academy – 49.3%, Bethel Hill Charter – 44%, and Sallie B. Howard – 61.1%).¶ ¶ Of the 53 charter schools earning a C, 27 (51%) tested between 0 – 20% EDS. Eleven schools (21%) tested between 20.5 – 40% EDS, four tested between 40.5 – 60% EDS, and ten tested between 60.5 – 80% EDS. One school, Maureen Joy Charter, tested greater than 80% ED students, with an ED population of at least 95%.¶ ¶ Of the 34 charter schools earning a D, three (10%) tested between 0 – 20% EDS. Five schools tested between 20.5 – 40% EDS, and ten (29%) tested between 40.5 – 60% EDS. Four schools (12%) tested greater than 80% EDS, and twelve schools (35%) served between 60.5 – 80% EDS.¶ ¶ ¶ On the far right of the chart is the bar depicting the number of schools that earned an F letter grade. Of the twelve schools earning an F, none of them tested between 0-20% EDS. Two schools tested 21-40% EDS, four schools tested 41-60% EDS, five schools tested 61-80% EDS, and one school tested 80- 100% EDS.¶ ¶ Formatted: Font:
  • 25. 25 Figure E. School Performance Grades and the Length of Time in Operation Of the twenty schools earning an A, four (20%) have been in operation for 1-5 years, four (20%) have been in operation for 6-10 years, and twelve (65%) have been in operation for 11 years or more. Of the 59 schools earning a B, 37 schools (64%) have been in operation for 11 years or more. Eight of the 59 (3%) have been in operation for 1-5 years, and 14 of the 59 (32% have been in operation for 6-10 years. Of the 53 schools earning a C, 26 (49) have been in operation for 1-5 years, six (11%) have been in operation for 6-10 years, four (8%) have been in operation for 11-15 years, 11 (21%) have been in operation for 16-20 years, and 6 (11%) have been in operation for 21 years or more. Of the 34 schools earning a D, sixteen (47%) have been in operation for 1-5 years. Six (18%) schools earning a D have been in operation for 6-10 years, two (6%) have been in operation for 11- 15 years, seven (21%) have been in operation for 16-20 years, and 3 (9%) have been in operation for 21 years or more. Of the 12 schools earning an F, 6 (50%) have been open for 1-5 years, 3 (25%) have been open 6-10 years, and 3 (25%) have been open for 21 years or more. 2018-2019 Charter School Academic Growth The section below examines charter school growth compared to non-charter schools, charter school growth trends over the past five years, the demographics of charter schools compared to their growth scores, and growth scores in comparison to the length of time schools have been in operation. 4 8 26 16 6 4 14 6 6 32 7 4 2 0 8 24 11 7 0 2 6 6 3 3 0 10 20 30 40 50 60 A B C D F NumberofSchools School Performance Grade Received 1-5 Years 6-10 Years 11-15 Years 16-20 Years 21+ Years Formatted: Keep with next, Keep lines together
  • 26. 26 In a comparison of charter and non-charter academic growth, more non-charters met and exceeded growth in 2018-2019 than did charters. 69.4% of charter schools met or exceeded growth whereas 73.6% of district schools met or exceeded growth. A higher percentage of charters failed to meet growth (30.2%) compared to non-charter schools (26.5%). However, as Figure F shows, the percentage of charter schools meeting or exceeding growth increased from 2017-18 to 2018-19, breaking a four-year slide in growth scores. Table 11. 2018-19 Charter and Non-Charter Growth Comparison Charter Non-Charter All Growth Status # % # % # % Exceeded 48 26.8% 647 27.4% 695 27.3% Met 77 43% 1095 46.2% 1172 46% Not Met 54 30.2% 627 26.5% 681 26.7% *May not equal 184. Alternative schools and those with insufficient data did not receive a growth score. Figure F. Charter School Growth Trends Over Past Five Years School Growth Status Compared to Percentage of ED Students Tested Figure G illustrates the growth status achieved by North Carolina’s charter schools and the percentage of economically disadvantaged students tested at each school. 73.40% 70.40% 70.10% 68.50% 70% 66.00% 68.00% 70.00% 72.00% 74.00% 2014-15 2015-16 2016-17 2017-18 2018-19 Percent Meeting or Exceeding Growth Deleted: traditional public Deleted: 4 Commented [DA5]: Question for Ashley – the percentage of charters meeting/exceeding growth in the table above doesn’t match the figures in this graph. Can you confirm that the 70% is correct?
  • 27. 27 Figure G. 2018-2019 Charter/District School Growth Status and Percentage of ED Students Served Of the 54 charter schools that did not meet growth, 30 schools (56%) served 20% or fewer EDS; eight (15%) served between 21-40% EDS; six (11%) served between 41-60% EDS, seven (13%) served between 61-80% EDS, and three (6%) served greater than 80% EDS. Of the 627 district schools that did not meet growth, 28 (4%) served fewer than 20% EDS; 87 (14%) served 20.1-40% EDS; 243 (39%) served 40.1-60% EDS; 216 (34%) served 60.1-80% EDS; and 53 (8%) served greater than 80% EDS. Of the 77 charter schools that met growth, 34 schools (44%) served 20% or fewer EDS; 19 (25%) served 21-40% EDS; nine (12%) served 41-60% EDS; 12 (16%) served 61-80% EDS; and three (4%) served greater than 80% EDS. Of the 1095 district schools that met growth, 57 (5%) served 20% or fewer EDS; 218 (20%) served 20.1-40% EDS; 436 (40%) served 40.1-60% EDS; 330 (30%) served 60.1-80% EDS; and 54 (5%) served greater than 80% EDS. Of the 48 charter schools that exceeded growth, 31 schools (65%) served 20% or fewer EDS; 3 (6%) served 21-40% EDS; 3 (6%) served 41-60% EDS; and 11 (23%) served 61-80% EDS. Of the 647 district schools that exceeded growth, 56 (9%) served 20% or fewer EDS; 155 (24%) served 20.1-40% EDS; 251 (39%) served 40.1-60% EDS; 156 (34%) served 60.1-80% EDS; and 29 (22.1%) served greater than 80% EDS. 9% 65% 5% 44% 4% 56% 24% 6% 20% 25% 14% 15% 39% 6% 40% 12% 39% 11% 24% 23% 30% 16% 34% 13% 4% 0% 5% 4% 8% 6% 0% 10% 20% 30% 40% 50% 60% 70% 80% 90% 100% Exceeded (District) Exceeded (Charter) Met (District) Met (Charter) Not Met (District) Not Met (Charter) Percent EDS 0-20% 20.1-40% 40.1-60% 60.1-80% 80.1-100% Formatted: Keep with next, Keep lines together Deleted: Deleted: Tested Deleted: 31 3 4 10 0 10 20 30 40 50 60 70 80 Exceeded 0-20% 21-40%
  • 28. 28 High Academic Growth with Disadvantaged Student Populations One of the six legislative purposes of charter schools in North Carolina is to increase learning opportunities for all students, particularly those who are identified as at-risk of academic failure. One measure of excellence for charter schools is achieving high academic growth with a student population that is economically disadvantaged. The figure below illustrates the growth index achieved by each school compared to the percentage of economically disadvantaged students who were assessed in EOC or EOG assessments in 2018-2019. It is important to note that the ED% in the chart below is reflective of the percentage of economically disadvantaged students in tested grades only as opposed to the school as a whole. Further, because charter schools are not required to participate in the National School Lunch Program, there is no standard manner in which to accurately capture the EE student population enrolled in charter schools. This may result in ED populations being largely underreported amongst charter schools. Figure H. Academic Growth with Economically Disadvantaged Students Based on this data, five schools had an ED population (in tested grades) of at least 70% and exceeded growth by achieving an EVAAS growth score of greater than +2: • Wilmington Preparatory Academy (81.01% ED in tested grades; +2.66 growth score) • Sugar Creek Charter (79.31% ED in tested grades; +3.29 growth score) • CIS Academy (76.67% ED in tested grades; +3.75 growth score) • PreEminent Charter (74.36% ED in tested grades; +8.38 growth score) • Healthy Start Academy (71.03% ED in tested grades; +5.6 growth score) Deleted: Of the 48 schools that exceeded growth, 31 schools (65%) tested fewer than 20% EDS; 3 (6%) tested 21-40% EDS; 4 (8%) tested 41-60% EDS; and ten (21%) tested 61- 80% EDS.¶ Of the 73 that met growth, 32 schools (44%) tested between 0 – 20% EDS; 18 (25%) tested 21-40% EDS; nine (12%) tested 41-60% EDS; 11 (15%) tested 61-80% EDS; and three (4%) tested greater than 80% EDS. ¶ ¶ Of the 54 schools that did not meet growth, 30 schools (56%) tested between 0 – 20% EDS; eight (15%) tested between 21- 40% EDS; six (11%) tested between 41-60% EDS, seven (13%) tested between 61-80% EDS, and three (6%) tested greater than 80% EDS.¶ ¶ ¶ Formatted: Keep with next, Keep lines together
  • 29. 29 KIPP Durham College Preparatory nearly met the 70% ED and +2 growth score threshold; the school had 69.9% ED students in tested grades and earned a +3.9 growth score. Academic Growth with English Learners The figure below illustrates the growth index achieved by each school compared to the percentage of English Learners who were assessed in EOG or EOC assessments in 2018-2019. Based on this data, four schools had a tested EL population of at least 25% and exceeded growth by achieving an EVAAS score of greater than +2: • KIPP Durham College Preparatory (38.6% EL tested population; +3.9 growth score) • Torchlight Academy (31.02% EL tested population; +5.14 growth score) • Healthy Start Academy (28.17% EL tested population; +5.6 growth score) • Sallie B. Howard School of the Arts (25.82% EL tested population; +4.55 growth score) Figure I. Academic Growth with English Learners Academic Growth with Students with Disabilities The figure below illustrates the growth index achieved by each school compared to the percentage of students with disabilities who were assessed in EOG or EOC assessments in 2018-2019. Based on this data, eight schools had a tested SWD population of at least 15% and exceeded growth by achieving an EVAAS score of greater than +2: • Arapahoe Charter School (18.02% SWD tested population; +3.56 growth score) • CIS Academy (16.67% SWD tested population; +3.75 growth score) • Island Montessori Charter School (20.29% SWD tested population; +3.59 growth score) Formatted: Left Deleted: ¶ ¶ ¶ ¶ ¶ ¶
  • 30. 30 • Magellan Charter (15.21% SWD tested population; +2.14 growth score) • Mountain Discovery Charter (15.38% SWD tested population; +2.32 growth score) • PreEminent Charter (17.95% SWD tested population; +8.38 growth score) • Quest Academy (17.02% SWD tested population; +2.02 growth score) • United Community School (18.8% SWD tested population; +4.83 growth score) Figure J. Academic Growth with Students with Disabilities Academic Growth with Students of Color The figure below illustrates the growth index achieved by each school compared to the percentage of students of color who were assessed in EOC or EOG assessments in 2018-2019. Based on this data, eleven schools had a tested student of color population of at least 70% and exceeded growth by achieving an EVAAS score of greater than +2: • Alpha Academy (86.3%; +2.53) • CIS Academy (95%; +3.75) • Guilford Preparatory Academy (95%; +2.39) • Healthy Start Academy (95%; +5.6) • Henderson Collegiate (94.74%; +2.72) • KIPP Durham College Preparatory (95%; +3.9) • PreEminent Charter (95%; +8.38) • Quality Education Academy (95%; +2.84) • Research Triangle Charter (95%; +5.44) • Sugar Creek Charter (95%; +3.29) • Torchlight Academy (95%; +5.14) Deleted: ¶ ¶
  • 31. 31 Figure K. Academic Growth with Students of Color Charter Academic Growth And Length of Time in Operation Figure L depicts the number of charter schools not meeting, meeting, and exceeding growth, and the length of time that schools have been in operation.
  • 32. 32 Figure L. Charter School Growth Status and Length of Time in Operation Of the 48 schools that exceeded growth, nine (19%) have been in operation for 1-5 years; 8 (17%) have been in operation for 6-10 years; three (6%) have been in operation for 11-15 years; 21 (44%) have been in operation for 16-20 years; and seven (15%) have been in operation for 21 years or more. Of the 73 schools meeting growth, 21 (29%) have been in operation for 1-5 years; 15 (21%) have been in operation for 6-10 years; seven (10%) have been in operation for 11-15 years; 21 (29%) have been in operation for 16-20 years; and nine (12%) have been in operation for more than 20 years. Of the 54 schools not meeting growth, 29 (54%) have been in operation for five years or fewer; 9 (17%) have been in operation for 6-10 years; five (9%) have been in operation for 11-15 years; eight (15%) have been in operation for 16-20 years; and five (9%) have been in operation for greater than 20 years. 9 21 298 15 9 3 7 5 21 21 8 7 9 5 0 10 20 30 40 50 60 70 80 Exceeded Met Not Met NumberofSchools Growth Status 1-5 Years 6-10 Years 11-15 Years 16-20 Years 20+ Years Formatted: Keep with next, Keep lines together
  • 33. 33 Table 12. Number and Percentage of Schools At or Above 60% Grade Level Proficient and College/Career Ready Charter Non-Charter All # % # % # % Schools At/Above 60% GLP (Level 3, 4, or 5) 104 56% 1068 44% 1172 45% Schools At/Above 60% CCR (Level 4 or 5) 46 25% 350 15% 396 15% Academic Performance: Low-Performing and Continually Low-Performing Schools S.L. 2016-79 defines Low-Performing and Continually Low-Performing Charter Schools as the following: 1. Low-Performing charter schools are those that receive a school performance grade of D or F and a school growth score of “met expected growth” or “not met expected growth.” 2. Continually Low-Performing charter schools are those that have been designated by the State Board as Low-Performing for at least two of the last three years. In 2018-19, 47 total schools were identified as either Low-Performing or Continually Low- Performing. Thirty-eight schools were identified as Continually Low-Performing, and forty-two schools were identified as Low-Performing. There was considerable overlap between the Low- Performing and Continually Low-Performing lists. Of the 42 Low-Performing schools, 31 were also Continually Low-Performing. Two of these schools were closed at the end of the 2018-19 school year. Of the 38 Continually Low-Performing Schools, five were not identified as Low-Performing because they received a grade higher than a D and either met or exceeded growth in 2018-19. The number of LP/CLP charter schools increased from 34 in 2017-18 to 47 in 2018-19. Formatted: Keep with next, Keep lines together Formatted: Keep with next, Keep lines together Formatted: Keep with next, Keep lines together Commented [DA7]: Get denominators from Swetha
  • 34. 34 Table 13. Low-Performing/Continually Low-Performing Charter School Trends 2016-17 2017-18 2018-19 LP Schools 37 (22.6%) 28 (16.8%) 42 (23.6%) CLP Schools 20 (12.3%) 28 (16.8%) 38 (21.3%) CLP Charter Schools 38 (22.8%) Recurring LP District Schools 423 (18.5%) Table 14. Total Low-Performing/Continually Low-Performing Charter School Trends 2016-17 2017-18 2018-19 Total LP/CLP Schools 37 34 47 Formatted: Keep with next, Keep lines together Formatted: Keep with next, Keep lines together Formatted: Keep with next, Keep lines together Formatted: Keep with next, Keep lines together Formatted Table Formatted: Keep with next, Keep lines together Formatted: Keep with next, Keep lines together Deleted: (22.7%) Deleted: 4 (19.8%) Deleted: (26.4%) Deleted: ¶ ¶
  • 35. 35 Figure M. Total Number of LP/CLP Charter Schools - Three Year Trend In order to hold charter schools accountable for student achievement results, the CSAB requires every school on the Low-Performing or Continually Low-Performing list to appear before them and present a plan for school improvement. CSAB members ask pointed questions about the efficacy of school plans and often encourage schools to establish student achievement goals that are feasible and ambitious. Every school identified as Low-Performing or Continually Low-Performing receives a site visit from the OCS Risk Assessment team. Schools consistently appearing on the Low-Performing monitoring list are also at risk of possible charter termination or non-renewal. Additional information on OCS-provided supports for Low-Performing and Continually Low- Performing Schools is located in Appendix C. 37 34 47 16-17 17-18 18-19 Total LP/CLP Schools Deleted: ¶ Formatted: Keep with next, Keep lines together
  • 36. 36 Academic Performance: Grade Level Proficiency Across Subject Areas and Subgroups The next several charts depict charter school student proficiency in English/Language Arts, Math, Science, and the ACT, both overall and within specific subgroups. The number of students captured within each subgroup score is located in Appendix D. English Language Arts Charter Schools and Non-Charter Schools All Students Comparisons 2019 Figure N. Percent of Students Scoring a Level 3 or Above on English/ELA EOC/EOG English Language Arts Charter Schools and Non-Charter Schools Elementary Subgroup Comparison 64.7% 68.7% 71.0% 55.5% 57.2% 59.1% 0.0% 10.0% 20.0% 30.0% 40.0% 50.0% 60.0% 70.0% 80.0% Elementary Middle High Charter Non-Charter Deleted: X
  • 37. 37 Figure O. Percent of Students Scoring a Level 3 or Above on English Language Arts EOG Middle School Subgroup Comparison Figure P. Percent of Students Scoring a Level 3 or Above on English/Language Arts EOG 64.7% 75.0% 44.9% 54.7% 44.7% 35.2% 29.4% 55.5% 69.4% 38.7% 42.1% 41.7% 24.3% 20.9% 0.0% 10.0% 20.0% 30.0% 40.0% 50.0% 60.0% 70.0% 80.0% All White Black Hispanic EDS ELS SWD Charter ELA 3-5 Non-Charter ELA 3-5 68.7% 77.2% 51.7% 61.4% 50.7% 25.5% 28.1% 57.2% 70.2% 40.0% 45.3% 42.6% 10.3% 17.5% 0.0% 10.0% 20.0% 30.0% 40.0% 50.0% 60.0% 70.0% 80.0% 90.0% All White Black Hispanic EDS ELS SWD Charter ELA 6-8 Non-Charter ELA 6-8 Formatted: Keep with next, Keep lines together Deleted: ¶ ¶ ¶ Formatted: Left
  • 38. 38 High School Subgroup Comparison Figure Q. Percent of Students Scoring a Level 3 or Above on English/Language Arts EOC 71.0% 78.4% 50.5% 63.7% 48.2% 12.5% 27.0% 59.1% 71.0% 41.0% 47.9% 42.9% 9.4% 17.0% 0.0% 10.0% 20.0% 30.0% 40.0% 50.0% 60.0% 70.0% 80.0% 90.0% All White Black Hispanic EDS ELS SWD Charter 9-12 Non-Charter 9-12
  • 39. 39 Mathematics Performance Mathematics Charter Schools and Non-Charter Schools All Students Comparisons 2019 Figure R. Percent of Students Scoring a Level 3 or Above on Math EOC/EOG Mathematics Charter and Non-Charter Schools Percent of Students Scoring a Level 3 or Above on Math EOC/EOG 63.4% 63.6% 44.6% 60.3% 56.0% 40.9% 0.0% 10.0% 20.0% 30.0% 40.0% 50.0% 60.0% 70.0% Elementary Middle High Charter Non-Charter
  • 40. 40 Figure S. Elementary School Subgroup Comparison Figure T. Middle School Subgroup Comparison 63.4% 73.1% 43.8% 56.0% 43.8% 46.4% 30.8% 60.4% 72.6% 41.5% 53.1% 47.1% 40.8% 24.3% 0.0% 10.0% 20.0% 30.0% 40.0% 50.0% 60.0% 70.0% All White Black Hispanic EDS ELS SWD Charter 3-5 Non-Charter 3-5 63.6% 72.6% 45.2% 57.3% 44.3% 37.3% 24.9% 56.0% 68.9% 36.2% 47.5% 41.0% 19.5% 17.2% 0.0% 10.0% 20.0% 30.0% 40.0% 50.0% 60.0% 70.0% All White Black Hispanic EDS ELS SWD Charter 6-8 Non-Charter 6-8 Formatted: Keep with next, Keep lines together
  • 41. 41 Figure U. High School Subgroup Comparison 44.6% 52.7% 28.8% 41.2% 29.6% 28.6% 18.9% 40.9% 52.5% 27.1% 35.1% 31.8% 16.3% 13.7% 0.0% 10.0% 20.0% 30.0% 40.0% 50.0% 60.0% All White Black Hispanic EDS ELS SWD Charter 9-12 Non-Charter 9-12 Formatted: Keep with next, Keep lines together
  • 42. 42 Science Performance Science Charter Schools and Non-Charter Schools All Students Comparisons 2019 Figure V. Percent of Students Scoring a Level 3 or Above on Science EOC/EOG Science Charter and Non-Charter Schools Percent of Students Scoring a Level 3 or Above on Math EOC/EOG Figure W. Elementary School Subgroup Comparison 75.1% 65.6% 72.3% 78.1% 59.3% 0.0% 10.0% 20.0% 30.0% 40.0% 50.0% 60.0% 70.0% 80.0% Elementary Middle High Charter Non-Charter 75.7% 83.9% 59.7% 70.2% 60.4% 52.1% 42.2% 72.3% 83.8% 56.8% 63.3% 61.6% 44.7% 34.9% 0.0% 10.0% 20.0% 30.0% 40.0% 50.0% 60.0% 70.0% 80.0% 90.0% All White Black Hispanic EDS ELS SWD Charter 3-5 Non-Charter 3-5
  • 43. 43 Figure X. Middle School Subgroup Performance Figure Y. High School Subgroup Performance 85.1% 91.4% 71.9% 80.6% 73.1% 47.3% 54.9% 78.1% 88.1% 63.8% 69.1% 67.5% 32.5% 41.5% 0.0% 10.0% 20.0% 30.0% 40.0% 50.0% 60.0% 70.0% 80.0% 90.0% 100.0% All White Black Hispanic EDS ELS SWD Charter 6-8 Non-Charter 6-8 65.6% 72.7% 43.8% 55.4% 43.4% 24.1% 30.6% 59.3% 72.1% 39.2% 47.2% 43.3% 15.0% 21.6% 0.0% 10.0% 20.0% 30.0% 40.0% 50.0% 60.0% 70.0% 80.0% All White Black Hispanic EDS ELS SWD Charter 9-12 Non-Charter 9-12
  • 44. 44 ACT Performance Charter Schools and Non-Charter Schools Figure Z. Percent of Students Meeting UNC 2017 ACT Benchmark 70.0% 54.7% 34.5% 43.5% 33.4% 45.7% 55.1% 38.4% 24.9% 31.8% 24.2% 28.8% 0.0% 10.0% 20.0% 30.0% 40.0% 50.0% 60.0% 70.0% 80.0% ACT ACT English ACT Math ACT Reading ACT Science ACT Writing Charter Non-Charter
  • 45. 45 State Board of Education Strategic Plan Goals and Measures for Charter Schools The State Board of Education sets targets for charter school academic performance, as measured by school performance grades, school growth, and Low-Performing/Continually Low- Performing status. The chart below shows charter schools’ actual results relative to the State Board’s goals and targets. The Office of Charter Schools, Charter Schools Advisory Board, and State Board of Education are committed to providing the supports necessary to ensure that the charter sector is progressing towards the goals outlined in the SBE strategic plan. Table 13. SBE Goals and Measures for Charter Schools Measure 2018-2019 Targeted Actual 2.4.1 Percentage of charter schools receiving SPG of A or B 45.5% 43% 2.4.2 Percentage of charter schools meeting or exceeding expected annual academic growth 75% 69% 2.4.3 Percentage of charter schools meeting or exceeding all financial and operational goals as measured by the OCS’ Performance Framework 90% TBD 2.4.4a Decrease number of Low Performing charter schools 25 42 2.4.44b Decrease number of Continually Low Performing charter schools 8 38
  • 46. 46 Charter School Impact on Local Districts In 2018-2019, charter school average daily membership (ADM) accounted for 7.2% of the state’s total ADM. Of the $9.44 billion in state funding for public education, 7.1% (or $674,314,240) was allotted to charter schools. Table 14. Number of Charters Approved, Opened, Closed and Total State Funds Allotted Unlike local education agencies, charter schools are not bound to serve only the students residing within a particular county or district. Many charter schools serve students from multiple districts, which often poses challenges related to transportation and funding allocations. Given the large number of districts from which a charter school may enroll students, it is difficult to pinpoint the specific fiscal impact of a given charter school on its “home district.” The map below illustrates the percentage of public school students in membership for each district in the state.
  • 47. 47 Figure AA. Percentage of Public School Students in Membership at Charter Schools In 2018-2019, the individual LEAs with the highest percentages of charter school membership (compared to total district and charter ADM) were located predominantly in rural areas, with the exception of Durham Public Schools. The table below outlines the LEAs where charter membership is at least 13% of the total district and charter ADM. A table of percentage of charter membership for every LEA in NC is in Appendix E. Table 15. LEAs with at Least 13% of Students Enrolled in Charter Schools Region LEA Charter Membership LEA Allotted ADM Total LEA and CS % of LEA 1 Halifax 959 2,472 3,431 28.0% 1 Northampton 530 1,651 2,181 24.3% 3 Vance 1,853 5,928 7,781 23.8% 1 Weldon City 251 899 1,150 21.8% 3 Person 1,134 4,449 5,583 20.3% 3 Durham Public 6,957 33,080 40,037 17.4% 3 Granville 1,500 7,511 9,011 16.6% 3 Warren 378 2,039 2,417 15.6% 2 Pamlico 230 1,250 1,480 15.5% 3 Wilson 1,834 11,554 13,388 13.7% 8 Rutherford 1,236 8,183 9,419 13.1% 3 Franklin 1,224 8,198 9,422 13.0% In 2018-2019, the SBE Education districts with the highest percentages of charter school membership (compared to total district and charter ADM) were Regions 3 and 6. The table below Deleted: X
  • 48. 48 outlines the total percentage of charter membership for each region. A map of the eight State Board of Education Districts is also below for reference. Figure AB. North Carolina State Board of Education Districts Table 16. SBE Districts/Regions and Total Charter Membership Region 2019 Charter Membership LEA Allotted ADM Total LEA and CS % of LEA North Central – 3 35,420 352,216 387,636 9.1% Southwest – 6 34,523 343,488 378,011 9.1% Western – 8 6,123 81,266 87,389 7.0% Northeast – 1 4,632 71,272 75,904 6.1% Piedmont-Triad – 5 15,273 238,458 253,731 6.0% Southeast – 2 5,293 140,320 145,613 3.6% Sandhills – 4 4,804 134,812 139,616 3.4% Northwest – 7 1,104 82,705 83,809 1.3% Charter schools also have positive potential impacts on local districts, such as relieving overcrowding, supplementing educational offerings currently available to parents, and reducing the financial strain on districts of building new facilities. Charter schools received a survey to gather square footage information, in order to estimate the amount of money districts have saved on facilities by not having to build schools to house students enrolled in charter schools. Preliminary survey results indicate that charter school square footage across the state totals approximately 11,000,000 square feet. If that figure is multiplied by a conservative estimate of $100 per square foot in building, renovation, and maintenance costs, charter schools may be saving districts almost $1
  • 49. 49 billion dollars in capital improvements. Further analysis on facilities savings is necessary to confirm this figure. Prior to 2013, the State Board of Education was required by legislation to solicit impact statements from LEAs when new applications for charters were being considered or when exiting charter schools wanted to grow beyond what was normally allowed within the statute. The General Assembly removed the requirement that LEAs submit impact statements, but the State Board has continued to consider comments from school districts in situations involving charter school enrollment growth.
  • 50. 50 Ensuring Autonomy and Accountability As schools of choice, charter schools are accountable to parents and guardians, who may withdraw their student(s) and re-enroll them elsewhere, should the school not meet their expectations. However, the North Carolina General Assembly and State Board of Education have approved several additional, concrete measures through which charter schools are held accountable to stakeholders: 1) Per General Statute 115C-218.25, all charter school boards are subject to the Open Meetings Laws and must publish the board meeting schedule on their website. 2) Per General Statute 115C-218.25, all charter schools are subject to the Public Records Act and must promptly comply with citizen requests. 3) Per General Statute 115C-218.90(b), all charter schools must adopt a criminal history check policy mirror that of the local school administrative unit in which the school is located. Further, all charter school board members must have criminal background checks. 4) Per General Statute 115C-218.85(3) and SBE policy CHTR-001, all charter schools are required to conduct the student assessments required by the SBE. Further, all charter schools are required to comply with North Carolina’s Accountability Model, unless otherwise approved by the SBE. Currently, four charter schools have been approved for an alternative accountability model. 5) Per General Statute 115C-218.30 and SBE policy CHTR-006, every charter school is required to undergo an annual audit for both its finances and its compliance with applicable federal and state laws and policies. These audits conducted by an independent auditor approved by the Local Governance Commission, and the audit must be published on the school’s website. (LGC Audit Requirements located in Appendix F) 6) Per General Statute 115C-218.94 and SBE policy CHTR-010, every charter school identified as Low Performing or Continually Low Performing is required to come before the Charter School Advisory Board and outline their plan for improving student achievement. 7) Goal 2, Objective 2.4 of the SBE’s Strategic Plan is to “Increase the number of schools meeting academic, operational, and financial goals.” Annually, the Office of Charter Schools’ Performance Framework serves as the standard mechanism for reporting on progress toward achievement of these goals. The framework provides a consolidated view of the school’s performance relative to a list of academic, operational, and financial requirements. The academic elements of the Framework are all standard indicators provided by the State accountability system. The operational and financial elements of the Framework are all required by General Statute, State Board Policy, or the Charter Agreement. This yearly compliance review involves divisions across the entire Department of Public Instruction (such as Exceptional Children and Financial Business Services) and ensures that charter schools are also in compliance with federal reporting requirements. (Performance Framework Guidelines located in Appendix G) 8) Per General Statute 115C-218.6 and SBE policy CHTR-007, every charter school is required to undergo a rigorous renewal process prior to having their charter term extended. Schools Deleted: X Deleted: X
  • 51. 51 not meeting the expected academic, financial, and/or governance standards are subject to renewal terms of 7, 5, 3 years or non-renewal. (Renewal Policy and Framework located in Appendix B) Deleted: X
  • 52. 52 Best Practices Resulting from Charter School Operations Northeast Academy for Aerospace and Advanced Technologies “NEAAT” is a charter school physically located on the campus of Elizabeth City State University in Elizabeth City, North Carolina. NEAAT’s school operations provide several examples of best practices that may be transferred to other charter and district schools. 1) NEAAT’s governing board has established a five-year strategic plan, complete with goals, objectives, and yearly milestones. The strategic plan includes an emphasis on an exceptional school culture through parent and community engagement, sustained extracurricular activities, demographics that mirror the geographic region, and stakeholder surveys; college/career readiness through academic pathways and internship opportunities, professional development for teachers, opportunities for students to present research, and an emphasis on helping students earn industry-recognized credentials/certifications; and the long-term sustainability of the school through a growing fund balance, multiple highly qualified candidates for each staffing vacancy, increased teacher retention, and collaborative projects with external partners such as other schools, districts, community organizations, etc. 2) NEAAT has demonstrated a commitment to university/community partnerships, as evidenced by its collaborative agreement with Elizabeth City State University. In addition to sharing physical classroom space, the university offers NEAAT students opportunities to utilize other campus resources related to NEAAT’s unique school mission and academic pathways – aerospace, computer science, and health sciences. The school has obtained sponsorships from organizations such as the William R. Kenan, Jr. Charitable Trust, the Golden Leaf Foundation, the Carnegie Corporation of New York, the Elizabeth City Foundation, and Sentara Albemarle Medical Center. Moreover, the school’s strategic plan contains objectives related to increasing signed partnership agreements and volunteer hours with community and business organizations, and designing/implementing high-quality project-based learning assignments that have been informed by business and community partners. The North Carolina Advancing Charter Collaboration and Excellence for Student Success (NC ACCESS) program provided training to NC ACCESS fellows on developing meaningful relationships and effective parent and community engagement with educationally disadvantaged students and their families. Each subgrantee was charged with creating a plan to engage diverse populations during the school’s initial enrollment drive and throughout the grant period, and monitoring indicators were provided to ensure that the plans developed were intentional and comprehensive. At the conclusion of the training, the NC ACCESS team offered subgrantees an opportunity to submit a mini-proposal to implement a parent engagement activity. Groups submitting the strongest proposals were awarded $500 towards project implementation. IC Imagine was awarded a $500 award to create a parent resource library (both online and physical) to support parents in multiple areas, including the use of social media, bullying, homework help, child/family wellness, literacy and core academic support at home, access to PowerSchool, and college entry. To engage parents with the resource center, the school will host an opening event with dinner for families. At the event, teachers and staff will show families how to access the resources, and then allow families time for exploration. Multiple community organizations, such as the Buncombe County Library and ECAC’s Western Office will partner with the school in the provision Deleted: traditional public
  • 53. 53 of resources. Finally, IC Imagine will host a Parent Resource Orientation Night with dinner each semester to provide an overview of available resources, share information on community agencies/partners willing to assist, and to continue fostering relationships with families, teachers, and administrators. Hiring a Diverse Teacher Workforce The Fordham Institute released a report examining North Carolina teacher and student data from 2006-07 through 2012-13 to determine the frequency and impact of student-teacher race match in charter and district schools. The report included several key findings, including: 1) Charter and district schools served the same proportion of black students, but charter schools hired about 35% more black teachers. 2) Black students enrolled in charter schools are more likely to have a black teacher than their counterparts in district schools, but white students in district and charter schools are equally likely to have a white teacher.
  • 54. 54 Charter Schools Receiving Special Awards and Recognition In 2018-2019, Envision Science Academy was the only school in the state to be recognized as an NC Model STEM School of Distinction. *Multiple charter schools were recognized by the CSAB for outstanding qualities: 1) Lake Norman Charter was recognized in Newsweek as one of America’s Best STEM High Schools 2) East Wake Academy teacher Heather Futtrell was honored for her exceptional ability to teach and connect with students 3) Charter School Teacher of the Year Ashley Bailey from Roxboro Community School was recognized for her stellar accomplishments 4) Lincoln Charter School was recognized for outstanding sportsmanship and character 5) Henderson Collegiate and its founder/leader Eric Sanchez was recognized for outstanding student achievement *U.S. News and World Report released a list of Top Ranked NC Schools based on six indicators: College Readiness, Math and Reading Proficiency, Math and Reading Performance, Underserved Student Performance, College Curriculum Breadth, and Graduation Rate. Several charter schools were among the highest rated: • Raleigh Charter High School (#2) • Woods Charter (#5) • Thomas Jefferson Classical Academy (#7) • Lake Norman Charter School (#9) • Pine Lake Preparatory (#19) • Franklin Academy (#20) • Community School of Davidson (#22) • Gray Stone Day School (#24) • Gaston College Preparatory (#28) • Research Triangle High School (#31) • The Hawbridge School (#39) • Union Academy (#46) • Voyager Academy (#48) • Longleaf School of the Arts (#51) • Oxford Preparatory Academy (#52) • Lincoln Charter (#53) • East Wake Academy (#54) *In a survey of the state’s charter high schools, an estimated $122 million dollars in scholarships were awarded to the graduating class of 2019. The number of reported graduates in the 88 charter high schools returning the survey was 3,432. That averages to $35,548 per graduate. Deleted: ¶ Page Break Formatted: Font: Font color: Custom Color(RGB(179,94,6)) Deleted: ¶ ¶ ¶ Page Break Formatted: Pattern: Clear (White)
  • 55. 55 Appendices Appendix A Ready-to-Open Final Enrollment Report Appendix B SBE Approved Renewal Policy Appendix C OCS Supports for Low-Performing and Continually Low-Performing Schools Appendix D Subgroup Size for Test Performance Reporting Appendix E Charter Membership in NC LEAs Appendix F LGC Audit Requirements Appendix G Performance Framework Guidelines