
Download as PDF, PPTX


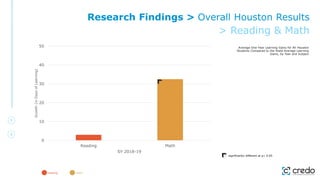
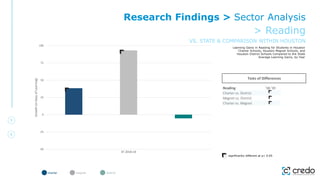
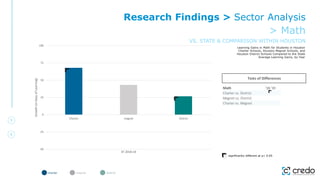
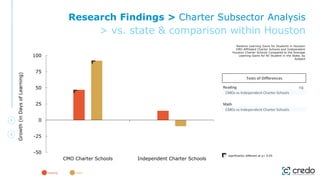
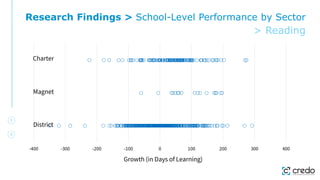
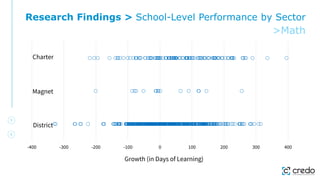
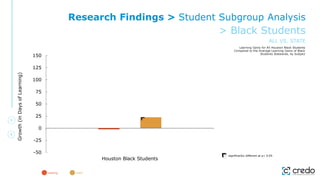
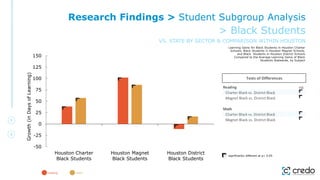
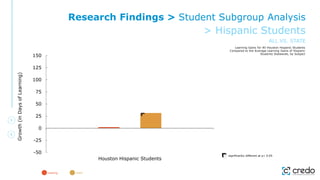
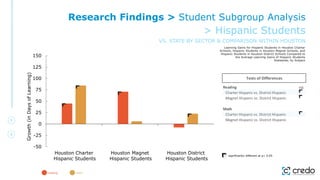
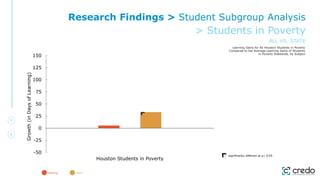
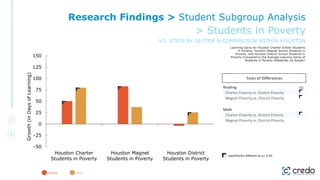
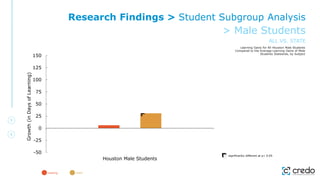
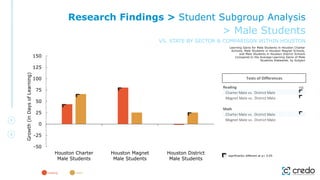
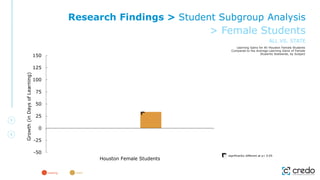
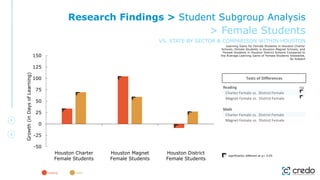
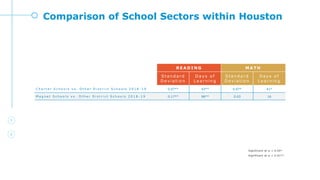
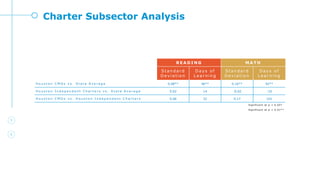


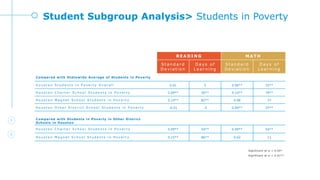


The 2022 Houston City Study analyzes school performance based on student academic progress from 2017-2019, comparing it against state averages across various demographics. It examines the effectiveness of charter and magnet schools compared to traditional public schools, evaluating performance in reading and math for student subgroups, including race and economic status. The findings emphasize significant variances in academic growth among different student sectors and demographic categories.


