SlideShare a Scribd company logo
1 of 20
Download to read offline
110
5 Strategic
Capacity
Management
Learning Objectives
LO 5–1 Explain what capacity management is and why it is strategically important.
LO 5–2 Exemplify how to plan capacity.
LO 5–3 Evaluate capacity alternatives using decision trees.
LO 5–4 Compare capacity planning in services to capacity planning in manufacturing.
ECONOMIES OF SCALE MADE OF STEEL
The Eleonora Maersk, almost 400m long is one of the E Series container ships oper-
ated by the Danish A. P. Moller-Maersk Group. These ships can carry 7,500 40-foot
shipping containers. Given that each of these containers can hold 70,000 T-shirts
allowing a T-shirt made in China to be sent to the Netherlands for just 2.5 cents.
These large ships and the even larger ones currently being launched, allow goods
to be shipped around the world at very low cost. Of course, the only downside is the
time that it takes these ships to make the
long journeys as they move the goods from
the factories in countries such as China,
India and Indonesia to the large consumer
markets in the United States, Canada,
­
Australia, and Western Europe.
The Eleonora Maersk leaving the Rotterdam
Harbor. The Triple-E vessels (Economy of
scale, Efficiency, Environment) will set new
standards for size, fuel, and cost efficiency
as well as reduce CO2
emissions. The capacity
of the new vessels is 18,000 TEU, exceeding
the capacity of the world’s largest
container vessels currently, which are
Maersk Line’s PS-class vessels of 15,550 TEU.
© imagebroker/Alamy
F.R. Jacobs, R.B. Chase (2018). “Operations and Supply Chain Management,” 15th Edition, McGraw Hill
publication. Chapter 5.
Strategic Capacity Management Chapter 5 111
A dictionary definition of capacity is “the ability to hold, receive, store, or accommodate.” In
a general business sense, it is most frequently viewed as the amount of output that a system is
capable of achieving over a specific period of time. In a service setting, this might be the
number of customers that can be handled between noon and 1:00 P.M. In manufacturing, this
might be the number of automobiles that can be produced in a single shift.
When looking at capacity, operations managers need to look at both resource inputs and
product outputs. For planning purposes, real (or effective) capacity depends on what is to be
produced. For example, a firm that makes multiple products inevitably can produce more of
one kind than of another with a given level of resource inputs. Thus, while the managers of an
automobile factory may state that their facility has 6,000 production hours available per year,
they are also thinking that these hours can be used to make either 150,000 two-door models
or 120,000 four-door models (or some mix of the two- and four-door models). This reflects
their knowledge of what their current technology and labor force inputs can produce and the
product mix that is to be demanded from these resources.
While many industries measure and report their capacity in terms of outputs, those whose
product mix is very uncertain often express capacity in terms of inputs. For example, hospital
capacity is expressed as the number of beds because the number of patients served and the
types of services provided will depend on patient needs.
An operations and supply chain management view also emphasizes the time dimension
of capacity. That is, capacity must also be stated relative to some period of time. This is evi-
denced in the common distinction drawn between long-range, intermediate-range, and short-
range capacity planning.
Capacity planning is generally viewed in three time durations:
Long range—greater than one year. Where productive resources (such as buildings, equip-
ment, or facilities) take a long time to acquire or dispose of, long-range capacity planning
requires top management participation and approval.
Intermediate range—monthly or quarterly plans for the next 6 to 18 months. Here, capac-
ity may be varied by such alternatives as hiring, layoffs, new tools, minor equipment pur-
chases, and subcontracting.
Short range—less than one month. This is tied into the daily or weekly scheduling process
and involves making adjustments to eliminate the variance between planned and actual
output. This includes alternatives such as overtime, personnel transfers, and alternative
production routings.
In this chapter, our focus is on capacity planning related to the long-term decisions. These
involve the purchase of highly capital-intensive items, such as buildings, equipment, and other
assets. The medium-term capacity-related decisions are considered as part of the aggregate
operations planning decisions, which are the topic of Chapter 19. Short-term capacity planning
is discussed in the context of the different types of processes discussed in the book: manufac-
turing in Chapter 7, service in Chapter 9, and material requirements planning in Chapter 21.
Although there is no one person with the job title “capacity manager,” there are several
managerial positions charged with the effective use of capacity. Capacity is a relative term; in
an operations management context, it may be defined as the amount of resource inputs avail-
able relative to output requirements over a particular period of time.
The objective of strategic capacity planning is to provide an approach for determining
the overall capacity level of capital-intensive resources—facilities, equipment, and overall
labor force size—that best supports the company’s long-term competitive strategy. The capac-
ity level selected has a critical impact on the firm’s response rate, its cost structure, its inven-
tory policies, and its management and staff support requirements. If capacity is inadequate, a
company may lose customers through slow service or by allowing competitors to enter the
CAPACITY MANAGEMENT IN OPERATIONS
AND SUPPLY CHAIN MANAGEMENT
Strategic capacity
planning
Finding the overall capacity
level of capital-intensive
resources to best support
the firm’s long-term
strategy.
Explain what capacity
management is and why it
is strategically important.
LO 5–1
112 Section 1 Strategy, Products, and Capacity
market. If capacity is excessive, a company may have to reduce prices to stimulate demand;
underutilize its workforce; carry excess inventory; or seek additional, less profitable products
to stay in business.
Capacity Planning Concepts
The term capacity implies an attainable rate of output, for example, 480 cars per day, but says
nothing about how long that rate can be sustained. Thus, we do not know if this 480 cars per
day is a one-day peak or a six-month average. To avoid this problem, the concept of best
operating level is used. This is the level of capacity for which the process was designed and
thus is the volume of output at which average unit cost is minimized. Determining this mini-
mum is difficult because it involves a complex trade-off between the allocation of fixed over-
head costs and the cost of overtime, equipment wear, defect rates, and other costs.
An important measure is the capacity utilization rate, which reveals how close a firm is
to its best operating level:
​
​
Capacity utilization rate = ​
Capacity used
  
______________
  
Best operating level
​
​
​
​
Capacity utilization rate = ​
480
___
500
​= .96 or 96%​
The capacity utilization rate is expressed as a percentage and requires that the numerator and
denominator be measured in the same units and time periods (such as machine hours/day, bar-
rels of oil/day, or dollars of output/day).
Economies and Diseconomies of Scale
The basic notion of economies of scale is that as a plant gets larger and volume increases, the
average cost per unit of output drops. This is partially due to lower operating and capital cost,
because a piece of equipment with twice the capacity of another piece typically does not cost
twice as much to purchase or operate. Plants also gain efficiencies when they become large
enough to fully utilize dedicated resources (people and equipment) for information technol-
ogy, material handling, and administrative support.
At some point, the size of a plant becomes too large and diseconomies of scale become a
problem. These diseconomies may surface in many different ways. For example, maintain-
ing the demand required to keep the large facility busy may require significant discounting
of the product. The U.S. automobile manufacturers continually face this problem. Another
typical example involves using a few large-capacity pieces of equipment. Minimizing equip-
ment downtime is essential in this type of operation. M&M
Mars, for example, has highly automated, high-volume equip-
ment to make M&Ms. A single packaging line moves 2.6 mil-
lion M&Ms each hour. Even though direct labor to operate
the equipment is very low, the labor required to maintain the
equipment is high.
In many cases, the size of a plant may be influenced by fac-
tors other than the internal equipment, labor, and other capi-
tal expenditures. A major factor may be the cost to transport
raw materials and finished product to and from the plant. A
cement factory, for example, would have a difficult time serv-
ing customers more than a few hours from its plant. Similarly,
automobile companies such as Ford, Honda, Nissan, and Toy-
ota have found it advantageous to locate plants within specific
international markets. The anticipated size of these intended
markets will largely dictate the size and capacity of the plants.
Jaguar, the luxury automobile producer, recently found it had
too many plants. Jaguar was employing 8,560 workers in three
plants that produced 126,122 cars, about 15 cars per employee.
Capacity
The output that a system is
capable of achieving over
a period of time.
Best operating level
The level of capacity for
which the process was
designed and the volume
of output at which average
unit cost is minimized.
Capacity utilization
rate
Measure of how close the
firm’s current output rate is
to its best operating level
(percent).
[5.1]
Economies of scale
Idea that as the plant
gets larger and volume
increases, the average
cost per unit drops. At
some point, the plant gets
too large and cost per unit
increases.
The production of M&M’s.
M&M’S®
is a registered trademark of Mars, Incorporated.
This trademark and the photograph depicting M&M’S®
chocolate candies are used with permission. Mars,
Incorporated is not associated with McGraw-Hill.
© Patrick Hertzog/AFP/Getty Images
Strategic Capacity Management Chapter 5 113
In comparison, Volvo’s plant in Torslanda, Sweden, was nearly twice as productive, building
158,466 cars with 5,472 workers, or 29 cars per employee. By contrast, BMW AG’s Mini unit
made 174,000 vehicles at a single British plant with just 4,500 workers, or 39 cars per employee.
Capacity Focus
The concept of a focused factory holds that a production facility works best when it focuses
on a fairly limited set of production objectives. This means, for example, that a firm should
not expect to excel in every aspect of manufacturing performance: cost, quality, delivery
speed and reliability, changes in demand, and flexibility to adapt to new products. Rather, it
should select a limited set of tasks that contribute the most to corporate objectives. Typically,
the focused factory would produce a specific product or related group of products. A focused
factory allows capacity to be focused on producing those specific items.
The capacity focus concept can be operationalized through the mechanism of plant within
a plant—or PWP. A focused factory (Exhibit 5.1) may have several PWPs, each of which may
have separate suborganizations, equipment and process policies, workforce management poli-
cies, production control methods, and so forth, for different products—even if they are made
under the same roof. This, in effect, permits finding the best operating level for each depart-
ment of the organization and thereby carries the focus concept down to the operating level.
Capacity Flexibility
Capacity flexibility means having the ability to rapidly increase or decrease production levels,
or to shift production capacity quickly from one product or service to another. Such flexibility
is achieved through flexible plants, processes, and workers, as well as through strategies that
use the capacity of other organizations. Increasingly, companies are taking the idea of flex-
ibility into account as they design their supply chains. Working with suppliers, they can build
capacity into their whole systems.
Flexible Plants Perhaps the ultimate in plant flexibility is the zero-changeover-time
plant. Using movable equipment, knockdown walls, and easily accessible and reroutable
utilities, such a plant can quickly adapt to change. An analogy to a familiar service business
captures the flavor well: a plant with equipment that is easy to install and easy to tear down
and move—like the Ringling Bros. and Barnum & Bailey Circus in the old tent-circus days.
Flexible Processes Flexible processes are epitomized by flexible manufacturing
systems on the one hand and simple, easily set up equipment on the other. Both of these
Plant within a plant
(PWP)
An area in a larger
facility that is dedicated
to a specific production
objective (for example,
product group). This can be
used to operationalize the
focused factory concept.
This company needs to produce two different
products. Product A is high volume and
standard (there is no variation in how it is
made). Product B is low volume and needs
to be customized to each order. This plant is
divided into three distinct areas that operate
independently. The Product Line A area
is a high-volume assembly line designed
to produce A. B Machine Shop is an area
where custom parts are made for product B.
Assembly B is where product B is assembled
based on each customer order. This factory,
with its plants within a plant, can operate more
efficiently than if both products were made
with a single common production process.
Product Line A
Assembly
– High Volume
– Low Variety
– Low Skill
– Low Volume
– High Variety
– High Skill
B
Machine Shop
Product Line B
Assembly
Focused Factories—Plant within a Plant
exhibit 5.1
Focused factory
A facility designed around
a limited set of production
objectives. Typically, the
focus would relate to a
specific product or product
group.
114 Section 1 Strategy, Products, and Capacity
technological approaches permit rapid low-cost switching from one product to another,
enabling what are sometimes referred to as economies of scope. (By definition, economies of
scope exist when multiple products can be combined and produced at one facility at a lower
cost than they can be produced separately.)
Flexible Worke rs Flexible workers have multiple skills and the ability to switch easily
from one kind of task to another. They require broader training than specialized workers and
need managers and staff support to facilitate quick changes in their work assignments.
Economies of scope
When multiple products
can be produced at lower
cost in combination than
they can be separately.
Employees work on a production line of Dell notebook
computers at a new plant of Wistron Group, which is the
main partner of Dell and Lenovo, in Chengdu, Sichuan
Province of China.
© ChinaFotoPress/ChinaFotoPress/Newscom
CAPACITY PLANNING
Considerations in Changing Capacity
Many issues must be considered when adding or decreasing capacity. Three important ones
are maintaining system balance, frequency of capacity additions or reductions, and use of
external capacity.
Maintaini ng System Balance In a perfectly balanced plant with three production
stages, the output of stage 1 provides the exact input requirement for stage 2. Stage 2’s output
provides the exact input requirement for stage 3, and so on. In practice, however, achieving
such a “perfect” design is usually both impossible and undesirable. One reason is that the best
operating levels for each stage generally differ. For instance, department 1 may operate most
efficiently over a range of 90 to 110 units per month, whereas department 2, the next stage in
the process, is most efficient at 75 to 85 units per month, and department 3 works best over a
range of 150 to 200 units per month. Another reason is that variability in product demand and
the processes themselves may lead to imbalance.
There are various ways of dealing with imbalance. One is to add capacity to stages that are
bottlenecks. This can be done by temporary measures, such as scheduling overtime, leasing
equipment, or purchasing additional capacity through subcontracting. A second way is through
the use of buffer inventories in front of the bottleneck stage to ensure it always has something to
work on. A third approach involves duplicating or increasing the facilities of one department on
which another is dependent. All these approaches are increasingly being applied to supply chain
design. This supply planning also helps reduce imbalances for supplier partners and customers.
Frequenc y of Capacity Additions There are two types of costs to consider
when adding capacity: the cost of upgrading too frequently and that of upgrading too
infrequently. Upgrading capacity too frequently is expensive. Direct costs include removing
and replacing old equipment and training employees on the
new equipment. In addition, the new equipment must be
purchased, often for considerably more than the selling price
of the old. Finally, there is the opportunity cost of idling the
plant or service site during the changeover period.
Conversely, upgrading capacity too infrequently is also
expensive. Infrequent expansion means that capacity is pur-
chased in larger chunks. Any excess capacity that is purchased
must be carried as overhead until it is utilized. (Exhibit 5.2
illustrates frequent versus infrequent capacity expansion.)
External Sources of Operations and
Supply Capacity In some cases, it may be cheaper
not to add capacity at all, but rather to use some existing
external source of capacity. Two common strategies used
by organizations are outsourcing and sharing capacity. An
example of outsourcing is Dell Computer using a Chinese
company to assemble its notebook computers. An example
of sharing capacity is two domestic airlines flying different
Exemplify how to plan
capacity.
LO 5–2
Strategic Capacity Management Chapter 5 115
routes with different seasonal demands exchanging aircraft (suitably repainted) when one’s
routes are heavily used and the other’s are not. A new twist is airlines sharing routes—using
the same flight number even though the airline company may change through the route.
Outsourcing is covered in more depth in Chapter 16.
Decreasing Capacity Although we normally think in terms of expansions,
shedding capacity in response to decreased demand can create significant problems for a firm.
Temporary strategies such as scheduling fewer hours or scheduling an extended shutdown
period are often used. More permanent reductions in capacity would typically require the sale
of equipment or possibly even the liquidation of entire facilities.
Determining Capacity Requirements
In determining capacity requirements, we must address the demands for individual product
lines, individual plant capabilities, and allocation of production throughout the plant network.
Typically, this is done according to the following steps:
1. Use forecasting techniques (see Chapter 18) to predict sales for individual products
within each product line.
2. Calculate equipment and labor requirements to meet product line forecasts.
3. Project labor and equipment availabilities over the planning horizon.
Often, the firm then decides on some capacity cushion that will be maintained between
the projected requirements and the actual capacity measured as a percentage in excess of
the expected demand. A capacity cushion is an amount of capacity in excess of expected
demand. For example, if the expected annual demand on a facility is $10 million in prod-
ucts per year and the design capacity is $12 million per year, it has a 20 percent capacity
­
cushion. A 20 percent capacity cushion equates to an 83 percent utilization rate
(100 ­
percent/120 percent).
When a firm’s design capacity is less than the capacity required to meet its demand, it is
said to have a negative capacity cushion. If, for example, a firm has a demand of $12 million
in products per year but can produce only $10 million per year, it has a negative capacity
cushion of 16.7 percent.
We now apply these three steps to an example.
Capacity cushion
Capacity in excess of
expected demand.
Volume
Capacity level
(infrequent expansion)
Years
Capacity level
(frequent expansion)
Small chunk Large chunk
Demand
forecast
Frequent versus Infrequent Capacity Expansion
exhibit 5.2
116 Section 1 Strategy, Products, and Capacity
EXAMPLE 5.1: Determining Capacity Requirements
Stewart Company produces two brands of salad dressings: Paul’s and Newman’s. Each is
available in bottles and single-serving plastic bags. Management would like to determine
yearly equipment and labor requirements for its packing operation for the next five years. The
details related to the exact weekly and monthly scheduling of the operations are done at dif-
ferent levels in the planning process.
The demand for the two flavors and for each packaging option is given in this table. The
company has three machines that can each package 150,000 bottles each year (each machine
has two operators). It also has five machines that can each package 250,000 plastic bags per
year (each of these machines has three operators). These capacity numbers have been adjusted
for expected downtime and quality problems. Will the company have enough yearly packag-
ing capacity to meet future demand?
Year
1 2 3 4 5
Paul’s
Bottles (000s) 60 100 150 200 250
Plastic bags (000s) 100 200 300 400 500
Newman’s
Bottles (000s) 75 85 95 97 98
Plastic bags (000s) 200 400 600 650 680
Year
1 2 3 4 5
Bottles (000s) 135 185 245 297 348
Plastic bags (000s) 300 600 900 1,050 1,180
SOLUTION
Step 1. Use forecasting techniques to predict sales for individual products within each product
line. The marketing department, which is now running a promotional campaign for Newman’s
dressing, provided the forecast demand values given in the previous table (in thousands) for
the next five years. The campaign is expected to continue for the next two years.
Step 2. Calculate equipment and labor requirements to meet product line forecasts. Cur-
rently, three machines that can package up to 150,000 bottles each per year are available.
Each machine requires two operators and can produce bottles of both Newman’s and Paul’s
dressings. Six bottle machine operators are available. Also, five machines that can package
up to 250,000 plastic bags each per year are available. Three operators are required for each
machine, which can produce plastic bags of both Newman’s and Paul’s dressings. Currently,
15 plastic bag machine operators are available.
Total product line forecasts can be calculated from the preceding table by adding the yearly
demand for bottles and plastic bags as follows.
We can now calculate equipment and labor requirements for the current year (year 1).
Because the total available capacity for packaging bottles is 450,000/year (3 machines
× 150,000 each), we will be using 135,000/450,000 = 0.3 or 30 percent of the available
capacity for the current year, or 135,000/150,000 = 0.9 machine. Similarly, we will need
300,000/1,250,000 = 0.24 or 24 percent of the available capacity for plastic bags for the cur-
rent year, or 300,000/250,000 = 1.2 machines. The total number of crew required to support
our forecast demand for the first year will equal the crew required for the bottle machine plus
the crew required for the plastic bag machine.
The labor requirement for year 1 is
​
​
0.9 bottle machine × 2 operators = 1.8 operators
​
    
1.2 bag machines × 3 operators = 3.6 operators
​
​
Strategic Capacity Management Chapter 5 117
EXAMPLE 5.2: Decision Trees
The owner of Hackers Computer Store is considering what to do with his business over the
next five years. Sales growth over the past couple of years has been good, but sales could grow
substantially if a major proposed electronics firm is built in his area. Hackers’ owner sees three
options. The first is to enlarge his current store, the second is to locate at a new site, and the
third is to simply wait and do nothing. The process of expanding or moving would take little
time, and, therefore, the store would not lose revenue. If nothing were done the first year and
strong growth occurred, then the decision to expand could be reconsidered. Waiting longer than
one year would allow competition to move in and would make expansion no longer feasible.
Step 3. Project labor and equipment availabilities over the planning horizon. We repeat the
preceding calculations for the remaining years.
Year
1 2 3 4 5
Bottle Operation
Percentage machine capacity utilized 30% 41% 54.4% 66% 77.3%
Machine requirement 0.9 1.23 1.63 1.98 2.32
Labor requirement 1.8 2.46 3.26 3.96 4.64
Plastic Bag Operation
Percentage machine capacity utilized 24% 48% 72% 84% 94%
Machine requirement 1.2 2.4 3.6 4.2 4.7
Labor requirement 3.6 7.2 10.8 12.6 14.1
A positive capacity cushion exists for all five years relative to the availability of machines
because the available capacity for both operations always exceeds the expected demand.
Stewart Company can now begin to develop the intermediate-range sales and operations plan
for the two production lines. This operations plan would need to address the issue of how
these machines might actually be scheduled relative to the use of overtime and/or multiple
shifts over weekly and monthly time intervals.
A convenient way to lay out the steps of a capacity problem is through the use of decision
trees. The tree format helps not only in understanding the problem but also in finding a solu-
tion. A decision tree is a schematic model of the sequence of steps in a problem and the con-
ditions and consequences of each step. In recent years, a few commercial software packages
have been developed to assist in the construction and analysis of decision trees. These pack-
ages make the process quick and easy.
Decision trees are composed of decision nodes with branches extending to and from them.
Usually squares represent decision points and circles represent chance events. Branches from
decision points show the choices available to the decision maker; branches from chance events
show the probabilities for their occurrence.
In solving decision tree problems, we work from the end of the tree backward to the start
of the tree. As we work back, we calculate the expected values at each step. In calculating the
expected value, the time value of money is important if the planning horizon is long.
Once the calculations are made, we prune the tree by eliminating from each decision point
all branches except the one with the highest payoff. This process continues to the first deci-
sion point, and the decision problem is thereby solved.
We now demonstrate an application of capacity planning for Hackers Computer Store.
USING DECISION TREES TO EVALUATE
CAPACITY ALTERNATIVES
Evaluate capacity
alternatives using decision
trees.
LO 5–3
118 Section 1 Strategy, Products, and Capacity
Alternative Revenue Cost Value
Move to new location, strong growth $195,000 × 5 yrs $210,000 $765,000
Move to new location, weak growth $115,000 × 5 yrs $210,000 $365,000
Expand store, strong growth $190,000 × 5 yrs $87,000 $863,000
Expand store, weak growth $100,000 × 5 yrs $87,000 $413,000
Do nothing now, strong growth, expand next year $170,000 × 1 yr +
$190,000 × 4 yrs
$87,000 $843,000
Do nothing now, strong growth, do not expand next year $170,000 × 5 yrs $0 $850,000
Do nothing now, weak growth $105,000 × 5 yrs $0 $525,000
The assumptions and conditions are as follows:
1. Strong growth as a result of the increased population of computer fanatics from the
new electronics firm has a 55 percent probability.
2. Strong growth with a new site would give annual returns of $195,000 per year. Weak
growth with a new site would mean annual returns of $115,000.
3. Strong growth with an expansion would give annual returns of $190,000 per year.
Weak growth with an expansion would mean annual returns of $100,000.
4. At the existing store with no changes, there would be returns of $170,000 per year if
there is strong growth and $105,000 per year if growth is weak.
5. Expansion at the current site would cost $87,000.
6. The move to the new site would cost $210,000.
7. If growth is strong and the existing site is enlarged during the second year, the cost
would still be $87,000.
8. Operating costs for all options are equal.
SOLUTION
We construct a decision tree to advise Hackers’ owner on the best action. Exhibit 5.3 shows
the decision tree for this problem. There are two decision points (shown with the square
nodes) and three chance occurrences (round nodes).
The values of each alternative outcome shown on the right of the diagram in Exhibit 5.4
are calculated as follows.
Hackers Computer
Store
Move
Expand
Do nothing
Strong growth
Weak growth
Strong growth
Weak growth
Strong growth
Weak growth
Expand
Do nothing
Revenue – Move_Cost
Revenue – Move_Cost
Revenue – Expansion_Cost
Revenue
.55
.45
.55
.55
.45
.45
Revenue
Decision Tree for Hackers Computer Store Problem
exhibit 5.3
Strategic Capacity Management Chapter 5 119
Hackers Computer
Store
Move
Expand
Do nothing
Strong growth
Weak growth
Strong growth
Weak growth
Strong growth
Weak growth
Expand
Do nothing
Revenue – Move_Cost = $365,000
Revenue – Move_Cost = $765,000
Revenue – Expansion_Cost = $413,000
Revenue – Expansion_Cost = $863,000
Revenue – Expansion_Cost = $843,000
Revenue = $850,000
0.550
0.450
0.550
0.550
0.450
0.450
Revenue = $525,000
$660,500
Do nothing; $703,750
$703,750
Do nothing; $850,000
$585,000
Decision Tree Analysis
exhibit 5.4
Decision Tree Analysis Using Net Present Value Calculations
exhibit 5.5
Hackers Computer
Store
Move
Expand
Do nothing
Strong growth
Weak growth
Strong growth
Weak growth
Strong growth
Weak growth
Expand
Do nothing
Revenue – Move_Cost = $166,544
Revenue – Move_Cost = $428,487
Revenue – Expansion_Cost = $240,429
Revenue – Expansion_Cost = $535,116
Revenue – Expansion_Cost = $529,874
Revenue = $556,630
0.550
0.450
0.550
0.550
0.450
0.450
Revenue = $343,801
$402,507
$460,857
Do nothing; $556,630
$310,613
NPV Analysis
Rate = 16%
Working from the rightmost alternatives, which are associated with the decision of whether
to expand, we see that the alternative of doing nothing has a higher value than the expansion
alternative. We therefore eliminate the expansion in the second year alternatives. What this
means is that if we do nothing in the first year and we experience strong growth, then in the
second year it makes no sense to expand.
Now we can calculate the expected values associated with our current decision alternatives.
We simply multiply the value of the alternative by its probability and sum the values. The
expected value for the alternative of moving now is $585,000. The expansion alternative has
an expected value of $660,500, and doing nothing now has an expected value of $703,750.
Our analysis indicates that our best decision is to do nothing (both now and next year)!
Due to the five-year time horizon, it may be useful to consider the time value of the rev-
enue and cost streams when solving this problem. If we assume a 16 percent interest rate,
the first alternative outcome (move now, strong growth) has a discounted revenue valued at
$428,487 (195,000 × 3.274293654) minus the $210,000 cost to move immediately. Exhibit 5.5
120 Section 1 Strategy, Products, and Capacity
shows the analysis considering the discounted flows. Details of the calculations are given as
follows. The present value table in Appendix E can be used to look up the discount factors. In
order to make our calculations agree with those completed by Excel—in Excel, calculate the
discount factor = (1 + interest rate)(–years)
—we have used discount factors that are calculated
to 10 digits of precision. The only calculation that is a little tricky is the one for revenue when
we do nothing now and expand at the beginning of next year. In this case, we have a revenue
stream of $170,000 the first year, followed by four years at $190,000. The first part of the cal-
culation (170,000 × .862068966) discounts the first-year revenue to the present. The next part
(190,000 × 2.798180638) discounts the next four years to the start of year 2. We then discount
this four-year stream to the present value.
Alternative Revenue Cost Value
Move to new location, strong
growth
$195,000 × 3.274293654 $210,000 $428,487
Move to new location, weak
growth
$115,000 × 3.274293654 $210,000 $166,544
Expand store, strong growth $190,000 × 3.274293654 $87,000 $535,116
Expand store, weak growth $100,000 × 3.274293654 $87,000 $240,429
Do nothing now, strong growth,
expand next year
$170,000 × .862068966 + $190,000
× 2.798180638 × .862068966
$87,000 ×
.862068966
$529,874
Do nothing now, strong growth,
do not expand next year
$170,000 × 3.274293654 $0 $556,630
Do nothing now, weak growth $105,000 × 3.274293654 $0 $343,801
PLANNING SERVICE CAPACITY
Capacity Planning in Services versus Manufacturing
Although capacity planning in services is subject to many of the same issues as manufactur-
ing capacity planning, and facility sizing can be done in much the same way, there are several
important differences. Service capacity is more time- and location-dependent, it is subject to
more volatile demand fluctuations, and utilization directly impacts service quality.
Time Unlike goods, services cannot be stored for later use. As such, in services, managers
must consider time as one of their supplies. The capacity must be available to produce a service
when it is needed. For example, a customer cannot be given a seat that went unoccupied on a
previous airline flight if the current flight is full. Nor can the customer purchase a seat on a
particular day’s flight and take it home to be used at some later date.
Location In face-to-face settings, the service capacity must be located near the customer.
In manufacturing, production takes place, and then the goods are distributed to the customer.
With services, however, the opposite is true. The capacity to deliver the service must first be
distributed to the customer (either physically or through some communications medium, such
as the telephone), then the service can be produced. A hotel room or rental car that is available
in another city is not much use to the customer—it must be where the customer is when that
customer needs it.
Volatility of Demand The volatility of demand on a service delivery system
is much higher than that on a manufacturing production system for three reasons. First, as
just mentioned, services cannot be stored. This means that inventory cannot smooth the
demand as in manufacturing. The second reason is that the customers interact directly with
Compare capacity planning
in services to capacity
planning in manufacturing.
LO 5–4
Strategic Capacity Management Chapter 5 121
jac66107_ch05_110-129.indd 121 01/11/17 11:55 AM
the production system—and these customers often have different needs, will have different
levels of experience with the process, and may require a different number of transactions. This
contributes to greater variability in the processing time required for each customer and hence
greater variability in the minimum capacity needed. The third reason for the greater volatility
in service demand is that it is directly affected by consumer behavior. Influences on customer
behavior ranging from the weather to a major event can directly affect demand for different
services. Go to any restaurant near your campus during spring break and it will probably be
almost empty. This behavioral effect can be seen over even shorter time frames, such as the
lunch-hour rush at a fast-food restaurant’s drive-through window. Because of this volatility,
service capacity is often planned in increments as small as 10 to 30 minutes, as opposed to the
one-week increments more common in manufacturing.
Capacity Utilization and Service Quality
Planning capacity levels for services must consider the day-to-day relationship between ser-
vice utilization and service quality. Exhibit 5.6 shows a service situation using waiting line
terms (arrival rates and service rates). The term arrival rate refers to the average number of
customers that come to a facility during a specific period of time. The service rate is the aver-
age number of customers that can be processed over the same period of time when the facility
is operating at maximum capacity. The best operating point is near 70 percent of the maxi-
mum capacity. This is enough to keep servers busy but allows enough time to serve customers
individually and keep enough capacity in reserve so as not to create too many managerial
headaches. In the critical zone, customers are processed through the system, but service qual-
ity declines. Above the critical zone, where customers arrive at a rate faster than they can be
served, the line builds up and it is likely that many customers may never be served. (Details
related to how waiting lines operate relative to capacity are presented in Chapter 10, “Waiting
Line Analysis and Simulation.”)
The optimal utilization rate is very context specific. Low rates are appropriate when both
the degree of uncertainty and the stakes are high. For example, hospital emergency rooms and
fire departments should aim for low utilization because of the high level of uncertainty and
the life-or-death nature of their activities. Relatively predictable services such as commuter
trains or service facilities without customer contact (for example, postal sorting operations)
can plan to operate much nearer to 100 percent utilization. Interestingly, there is a third group
for which high utilization is desirable. All sports teams like sellouts, not only because of the
virtually 100 percent contribution margin of each customer, but because a full house creates
an atmosphere that pleases customers, motivates the home team to perform better, and boosts
future ticket sales. Stage performances and bars share this phenomenon.
Typically, a firm can
run a factory at a
much higher capacity
utilization rate than a
service facility such
as a call center. Less
predictable demand
requires a lower
capacity operating
point for good service.
KEY IDEAS
Mean arrival
rate (λ)
Zone of nonservice
(μ  λ)
Critical
zone
Zone of service
Mean service rate (μ)
ρ = 100%
ρ = 70%
μ
λ
Relationship between the Rate of Service Utilization (ρ) and Service
Quality
exhibit 5.6
J. Haywood–Farmer and J. Nollet, Services
Plus: Effective Service Managment
(Boucherville, Quebec, Canada: G. Morin
Publisher Ltd., 1991), p. 59.
Final PDF to printer
122 Section 1 Strategy, Products, and Capacity
Ohio State fans cheer
the Buckeyes on
during the first half
of their game against
Youngstown State.
© Jamie Sabau/Getty Images
Concept Connections
LO 5–1 Explain what capacity management is and why it is strategically important.
Summary
∙ An operations and supply chain management view of
capacity emphasizes the time dimension of capacity.
∙ Three time horizons are generally used: long range
(greater than a year), intermediate range (next 6 to 18
months), and short range (less than a month).
∙ To distinguish between the absolute maximum capac-
ity of the system (the highest output rate attainable)
and the rate that is sustainable by the system (that it
can be run at efficiently and for a long period of time),
the term best operating level is used. The utilization
of the system is a measure of how close the system is
operating relative to the best level.
∙ When a producing resource, such as a manufactur-
ing plant, gets larger and volume increases while the
average cost per unit of output simultaneously drops,
then the resource is exhibiting economies of scale.
∙ At some point, the resource may be too large and the
average cost will start to rise. This is when disecono-
mies of scale are a problem.
∙ Focused manufacturing plants are designed to produce
multiple products using a concept called plant within a
plant to improve economies of scale even though mul-
tiple products are produced in the same facility. This
type of facility demonstrates the concept of economies
of scope.
∙ Having capacity flexibility is often important to meet-
ing the needs of a firm’s customers.
Key Terms
Strategic capacity planning Finding the overall capacity
level of capital-intensive resources to best support the
firm’s long-term strategy.
Capacity The output that a system is capable of achiev-
ing over a period of time.
Best operating level The level of capacity for which the
process was designed and the volume of output at which
average unit cost is minimized.
Capacity utilization rate Measure of how close the
firm’s current output rate is to its best operating level
(percent).
Economies of scale Idea that as the plant gets larger
and volume increases, the average cost per unit drops.
At some point, the plant gets too large and cost per unit
increases.
Strategic Capacity Management Chapter 5 123
Focused factory A facility designed around a limited
set of production objectives. Typically, the focus would
relate to a specific product or product group.
Plant within a plant (PWP) An area in a larger facility
that is dedicated to a specific production objective (for
example, product group). This can be used to operation-
alize the focused factory concept.
Economies of scope When multiple products can be
produced at lower cost in combination than they can be
separately.
​
​
Capacity utilization rate = ​
Capacity used
  
______________
  
Best operating level
​
​ ​
​
​​
​
[5.1]​
​
LO 5–2 Exemplify how to plan capacity.
∙ From a strategic, long-term view, capacity additions
or reductions come in chunks (fixed amounts). For
example, an additional machine of a certain type is
added to the existing pool of machines. Issues involve
how frequently and how much capacity is added or
removed over time.
Summary
Key Terms
Capacity cushion Capacity in excess of expected
demand.
LO 5–3 Evaluate capacity alternatives using decision trees.
∙ A useful technique for analyzing capacity problems is
the decision tree.
∙ With this format, the sequences of decisions are orga-
nized like branches in a tree.
∙ The potential consequences of the decisions are enu-
merated and evaluated based on their probability of
occurrence and corresponding expected value.
Summary
LO 5–4 Compare capacity planning in services to capacity planning in manufacturing.
∙ Often, services require that capacity be available
immediately and that it be near where the customer
resides. For example, a bank needs automated teller
machines (ATMs) close to where customers want
immediate cash, and enough of them so customers
will not have to wait in long lines.
∙ Also, firms that offer services often need to deal
with dramatic changes in customer demand over time
(for example, the lunch-hour rush at a bank’s drive-
through window).
Summary
Solved Problem
E-Education is a new startup that develops and markets MBA courses offered over the Inter-
net. The company is currently located in Chicago and employs 150 people. Due to strong
growth, the company needs additional office space. The company has the option of leasing
additional space at its current location in Chicago for the next two years, but after that will
need to move to a new building. Another option the company is considering is moving the
entire operation to a small Midwest town immediately. A third option is for the company to
lease a new building in Chicago immediately. If the company chooses the first option and
leases new space at its current location, it can, at the end of two years, either lease a new
building in Chicago or move to the small Midwest town.
LO 5–3
124 Section 1 Strategy, Products, and Capacity
The following are some additional facts about the alternatives and current situation:
1. The company has a 75 percent chance of surviving the next two years.
2. Leasing the new space for two years at the current location in Chicago would cost $750,000
per year.
3. Moving the entire operation to a Midwest town would cost $1 million. Leasing space
would run only $500,000 per year.
4. Moving to a new building in Chicago would cost $200,000, and leasing the new building’s
space would cost $650,000 per year.
5. The company can cancel the lease at any time.
6. The company will build its own building in five years, if it survives.
7. Assume all other costs and revenues are the same no matter where the company is located.
What should E-Education do?
Solution
		 Step 1: Construct a decision tree that considers all of E-Education’s alternatives. The fol-
lowing shows the tree that has decision points (with the square nodes) followed by chance
occurrences (round nodes). In the case of the first decision point, if the company survives,
two additional decision points need consideration.
E-Education
Stay in Chicago
Lease current space for
two years
Survive (.75)
Survive (.75)
Lease new space
in Chicago
Stay in Chicago
Lease new space
Move to Midwest
town
Move to Midwest
$3,650,000
$3,450,000
$3,112,500
$2,962,500
Fail (.25)
Fail (.25)
$4,000,000
$1,500,000
$1,500,000
Survive (.75)
$3,500,000
$3,125,000
Fail (.25)
$2,000,000
		 Step 2: Calculate the values of each alternative as follows.
Alternative Calculation Value
Stay in Chicago, lease current space for two years,
survive, lease new building in Chicago
(750,000) × 2 + 200,000 +
(650,000) × 3 =
$3,650,000
Stay in Chicago, lease current space for two years,
survive, move to Midwest
(750,000) × 2 + 1,000,000 +
(500,000) × 3 =
$4,000,000
Stay in Chicago, lease current space for two years, fail (750,000) × 2 = $1,500,000
Stay in Chicago, lease new building in Chicago, survive 200,000 + (650,000) × 5 = $3,450,000
Stay in Chicago, lease new building in Chicago, fail 200,000 + (650,000) × 2 = $1,500,000
Move to Midwest, survive 1,000,000 + (500,000) × 5 = $3,500,000
Move to Midwest, fail 1,000,000 + (500,000) × 2 = $2,000,000
Working from our rightmost alternatives, the first two alternatives end in decision nodes. If we
fail after the first two years, represented by the third alternative, the cost is only $1,500,000.
The expected value of the first option of staying in Chicago and leasing space for the first two
years is .75 × 3,650,000 + .25 × 1,500,000 = $3,112,500.
Strategic Capacity Management Chapter 5 125
The second option, staying in Chicago and leasing a new building now, has an expected
value of .75 × 3,450,000 + .25 × 1,500,000 = $2,962,500.
Finally, the third option of moving to the Midwest immediately has an expected value of
.75 × 3,500,000 + .25 × 2,000,000 = $3,125,000.
From this, it looks like the best alternative is to stay in Chicago and lease a new building
immediately.
Discussion Questions
	  1. What capacity problems are encountered when a new drug is introduced to the market?
	  2. List some practical limits to economies of scale. In other words, when should a plant stop
growing?
	 3. What are some capacity balance problems faced by the following organizations or
facilities?
a. An airline terminal
b. A university computing lab
c. A clothing manufacturer
	  4. At first glance, the concepts of the focused factory and capacity flexibility may seem to
contradict each other. Do they really?
	  5. Management may choose to build up capacity in anticipation of demand or in response to
developing demand. Cite the advantages and disadvantages of both approaches.
	  6. What is capacity balance? Why is it hard to achieve? What methods are used to deal with
capacity imbalances?
	  7. What are some reasons for a plant to maintain a capacity cushion? How about a negative
capacity cushion?
	  8. Will the use of decision tree analysis guarantee the best decision for a firm? Why or why
not? If not, why bother using it?
	  9. Consider the example in Exhibit 5.5. Can you think of anything else you might do with
that example that would be helpful to the ultimate decision maker?
10. What are some major capacity considerations in a hospital? How do they differ from
those of a factory?
11. Refer to Exhibit 5.6. Why is it that the critical zone begins at a utilization rate of about
70 percent in a typical service operation? Draw upon your own experiences as either a
customer or a server in common service establishments.
LO5–1
LO5–2
LO5–3
LO5–4
Objective Questions
1. A manufacturing shop is designed to operate most efficiently at an output of 550 units per
day. In the past month, the plant averaged 490 units per day. What was its capacity utiliza-
tion rate last month? (Answer in Appendix D)
2. A company has a factory that is designed so that it is most efficient (average unit cost is
minimized) when producing 15,000 units of output each month. However, it has an abso-
lute maximum output capability of 17,250 units per month, and can produce as little as
7,000 units per month without corporate headquarters shifting production to another plant.
If the factory produces 10,925 units in October, what is the capacity utilization rate in
October for this factory?
3. Hoosier Manufacturing operates a production shop that is designed to have the lowest unit
production cost at an output rate of 100 units per hour. In the month of July, the company
operated the production line for a total of 175 hours and produced 16,900 units of output.
What was its capacity utilization rate for the month?
4. AlwaysRain Irrigation, Inc. would like to determine capacity requirements for the next four
years. Currently, two production lines are in place for making bronze and plastic sprin-
klers. Three types of sprinklers are available in both bronze and plastic: 90-degree nozzle
LO5–1
LO5–2
126 Section 1 Strategy, Products, and Capacity
sprinklers, 180-degree nozzle sprinklers, and 360-degree nozzle sprinklers. Management
has forecast demand for the next four years as follows.
Yearly Demand
1 (in 000s) 2 (in 000s) 3 (in 000s) 4 (in 000s)
Plastic 90 32 44 55 56
Plastic 180 15 16 17 18
Plastic 360 50 55 64 67
Bronze 90 11 15 18 23
Bronze 180 6 5 6 9
Bronze 360 15 16 17 20
Yearly Demand
1 (in 000s) 2 (in 000s) 3 (in 000s) 4 (in 000s)
Plastic 90 32 44 55 56
Plastic 180 15 16 17 18
Plastic 360 50 55 64 67
Bronze 90 7 8 9 10
Bronze 180 3 4 5 6
Bronze 360 11 12 15 18
		 Both production lines can produce all the different types of nozzles. The bronze machines
needed for the bronze sprinklers require two operators and can produce up to 12,000 sprin-
klers. The plastic injection molding machine needed for the plastic sprinklers requires four
operators and can produce up to 200,000 sprinklers. Three bronze machines and only one
injection molding machine are available. What are the capacity requirements for the next
four years? (Assume that there is no learning.)
5. Suppose that AlwaysRain Irrigation’s marketing department will undertake an intense ad
campaign for the bronze sprinklers, which are more expensive but also more durable than
the plastic ones. Forecast demand for the next four years is as follows.
		 What are the capacity implications of the marketing campaign (assume no learning)?
6. In anticipation of the ad campaign, AlwaysRain bought an additional bronze machine. Will
this be enough to ensure that adequate capacity is available?
7. Suppose that operators have enough training to operate both the bronze machines and
the injection molding machine for the plastic sprinklers. Currently, AlwaysRain has 10
such employees. In anticipation of the ad campaign described in problem 5, management
approved the purchase of two additional bronze machines. What are the labor requirement
implications?
8. Expando, Inc. is considering the possibility of building an additional factory that would
produce a new addition to its product line. The company is currently considering two
options. The first is a small facility that it could build at a cost of $6 million. If demand for
new products is low, the company expects to receive $10 million in discounted revenues
(present value of future revenues) with the small facility. On the other hand, if demand is
high, it expects $12 million in discounted revenues using the small facility. The second
option is to build a large factory at a cost of $9 million. Were demand to be low, the com-
pany would expect $10 million in discounted revenues with the large plant. If demand is
high, the company estimates that the discounted revenues would be $14 million. In either
case, the probability of demand being high is .40, and the probability of it being low is
.60. Not constructing a new factory would result in no additional revenue being generated
because the current factories cannot produce these new products. Construct a decision tree
to help Expando make the best decision. (Answer in Appendix D)
LO5–3
Strategic Capacity Management Chapter 5 127
	  9. A builder has located a piece of property that she would like to buy and eventually build
on. The land is currently zoned for four homes per acre, but she is planning to request
new zoning. What she builds depends on approval of zoning requests and your analysis
of this problem to advise her. With her input and your help, the decision process has been
reduced to the following costs, alternatives, and probabilities:
		   Cost of land: $2 million
		   Probability of rezoning: .60
		   If the land is rezoned, there will be additional costs for new roads, lighting, and so on,
of $1 million.
		   If the land is rezoned, the contractor must decide whether to build a shopping cen-
ter or 1,500 apartments that the tentative plan shows would be possible. If she builds a
shopping center, there is a 70 percent chance that she can sell the shopping center to a
large department store chain for $4 million over her construction cost, which excludes the
land; and there is a 30 percent chance that she can sell it to an insurance company for $5
million over her construction cost (also excluding the land). If, instead of the shopping
center, she decides to build the 1,500 apartments, she places probabilities on the profits
as follows: There is a 60 percent chance that she can sell the apartments to a real estate
investment corporation for $3,000 each over her construction cost; there is a 40 percent
chance that she can get only $2,000 each over her construction cost. (Both exclude the
land cost.)
		   If the land is not rezoned, she will comply with the existing zoning restrictions and
simply build 600 homes, on which she expects to make $4,000 over the construction cost
on each one (excluding the cost of land).
		   Draw a decision tree of the problem and determine the best solution and the expected
net profit.
10. Owners of a local restaurant are concerned about their ability to provide quality service
as they continue to grow and attract more customers. They have collected data from Fri-
day and Saturday nights, their busiest times of the week. During these time periods, about
75 customers arrive per hour for service. Given the number of tables and chairs, and the
typical time it takes to serve a customer, the owners estimate they can serve, on average,
about 100 customers per hour. During these nights, are they in the zone of service, the
critical zone, or the zone of nonservice? (Answer in Appendix D)
11. Owners of the restaurant in the prior problem anticipate that in one year their demand
will double as long as they can provide good service to their customers. How much will
they have to increase their service capacity to stay out of the critical zone?
LO5–4
“Shouldice Hospital, the house that hernias built, is a
converted country estate which gives the hospital ‘a
country club’ appeal.”
A quote from American Medical News
Shouldice Hospital in Canada is widely known for one
thing—hernia repair! In fact, that is the only operation
it performs, and it performs a great many of them. Over
the past two decades this small 90-bed hospital has aver-
aged 7,000 operations annually. Last year, it had a record
year and performed nearly 7,500 operations. Patients’
ties to Shouldice do not end when they leave the hospital.
Every year, the gala Hernia Reunion dinner (with com-
plimentary hernia inspection) draws in over 1,000 former
patients, some of whom have been attending the event for
over 30 years.
A number of notable features in Shouldice’s service
delivery system contribute to its success: (1) Shouldice
accepts only patients with uncomplicated external her-
nias, and uses a superior technique developed for this
type of hernia by Dr. Shouldice during World War II.
(2) Patients are subject to early ambulation, which pro-
motes healing. (Patients literally walk off the operating
table and engage in light exercise throughout their stay,
which lasts only three days.) (3) Its country club atmo-
sphere, gregarious nursing staff, and built-in socializing
make a surprisingly pleasant experience out of an inher-
ently unpleasant medical problem. Regular times are set
aside for tea, cookies, and socializing. All patients are
paired up with a roommate with a similar background
and interests.
Case: Shouldice Hospital—A Cut Above
128 Section 1 Strategy, Products, and Capacity
The Production System
The medical facilities at Shouldice consist of five oper-
ating rooms, a patient recovery room, a laboratory, and
six examination rooms. Shouldice performs, on average,
150 operations per week, with patients generally staying
at the hospital for three days. Although operations are
performed only five days a week, the remainder of the
hospital is in operation continuously to attend to recover-
ing patients.
An operation at Shouldice Hospital is performed by
one of the 12 full-time surgeons, and assisted by one
of seven part-time assistant surgeons. Surgeons gener­
ally take about one hour to prepare for and perform each
hernia operation, and they operate on four patients per
day. The surgeons’ day ends at 4 P.M., although they can
expect to be on call every 14th night and every 10th
weekend.
The Shouldice Experience
Each patient undergoes a screening exam prior to setting
a date for his or her operation. Patients in the Toronto
area are encouraged to walk in for the diagnosis. Exami-
nations are done between 9 A.M. and 3:30 P.M. Monday
through Friday, and between 10 A.M. and 2 P.M. on Sat-
urday. Out-of-town patients are mailed a medical infor-
mation questionnaire (also available over the Internet),
which is used for the diagnosis. A small percentage of the
patients who are overweight or otherwise represent an
undue medical risk are refused treatment. The remaining
patients receive confirmation cards with the scheduled
dates for their operations. A patient’s folder is transferred
to the reception desk once an arrival date is confirmed.
Patients arrive at the clinic between 1 and 3 P.M. the
day before their surgery. After a short wait, they receive a
brief preoperative examination. They are then sent to an
admissions clerk to complete any necessary paperwork.
Patients are next directed to one of the two nurses’ sta-
tions for blood and urine tests and then are shown to their
rooms. They spend the remaining time before orienta-
tion getting settled and acquainting themselves with their
roommates.
Orientation begins at 5 P.M., followed by dinner in
the common dining room. Later in the evening, at 9 P.M.,
patients gather in the lounge area for tea and cookies.
Here, new patients can talk with patients who have already
had their surgery. Bedtime is between 9:30 and 10 P.M.
On the day of the operation, patients with early opera-
tions are awakened at 5:30 A.M. for preoperative sedation.
The first operations begin at 7:30 A.M. Shortly before an
operation starts, the patient is administered a local anes-
thetic, leaving him or her alert and fully aware of the pro-
ceedings. At the conclusion of the operation, the patient
is invited to walk from the operating table to a nearby
wheelchair, which is waiting to return the patient to his
or her room. After a brief period of rest, the patient is
encouraged to get up and start exercising. By 9 P.M. that
day, he or she is in the lounge having cookies and tea and
talking with new, incoming patients.
The skin clips holding the incision together are loos-
ened, and some even removed, the next day. The remain-
der are removed the following morning just before the
patient is discharged.
When Shouldice Hospital started, the average hospi-
tal stay for hernia surgery was three weeks. Today, many
institutions push “same day surgery” for a variety of rea-
sons. Shouldice Hospital firmly believes that this is not
in the best interests of patients and is committed to its
three-day process. Shouldice’s postoperative rehabilita-
tion program is designed to enable the patient to resume
normal activities with minimal interruption and discom-
fort. Shouldice patients frequently return to work in a few
days; the average total time off is eight days.
“It is interesting to note that approximately 1 out of
every 100 Shouldice patients is a medical doctor.”
Future Plans
The management of Shouldice is thinking of expanding
the hospital’s capacity to serve considerable unsatisfied
demand. To this effect, the vice president is seriously
considering two options. The first involves adding one
more day of operations (Saturday) to the existing five-
day schedule, which would increase capacity by 20 per-
cent. The second option is to add another floor of rooms
to the hospital, increasing the number of beds by 50 per-
cent. This would require more aggressive scheduling of
the operating rooms.
The administrator of the hospital, however, is con-
cerned about maintaining control over the quality of the
service delivered. He thinks the facility is already getting
very good utilization. The doctors and the staff are happy
with their jobs, and the patients are satisfied with the
service. According to him, further expansion of capacity
might make it hard to maintain the same kind of working
relationships and attitudes.
Questions
Exhibit 5.7 is a room-occupancy table for the existing
system. Each row in the table follows the patients who
checked in on a given day. The columns indicate the
number of patients in the hospital on a given day. For
example, the first row of the table shows that 30 peo-
ple checked in on Monday and were in the hospital for
Monday, Tuesday, and Wednesday. By summing the col-
umns of the table for Wednesday, we see that there are 90
patients staying in the hospital that day.
1. How well is the hospital currently utilizing its beds?
2. Develop a similar table to show the effects of adding
operations on Saturday. (Assume that 30 operations
Strategic Capacity Management Chapter 5 129
would still be performed each day.) How would this
affect the utilization of the bed capacity? Is this
capacity sufficient for the additional patients?
3. Now look at the effect of increasing the number of
beds by 50 percent. How many operations could the
hospital perform per day before running out of bed
capacity? (Assume operations are performed five
days per week, with the same number performed
on each day.) How well would the new resources be
utilized relative to the current operation? Could the
hospital really perform this many operations? Why?
(Hint: Look at the capacity of the 12 surgeons and the
five operating rooms.)
4. Although financial data are sketchy, an estimate from a
construction company indicates that adding bed capac-
ity would cost about $100,000 per bed. In addition, the
rate charged for the hernia surgery varies between about
$900 and $2,000 (U.S. dollars), with an average rate of
$1,300 per operation. The surgeons are paid a flat $600
per operation. Due to all the uncertainties in govern-
ment health care legislation, Shouldice would like to
justify any expansion within a five-year time period.
Beds Required
Check-in Day Monday Tuesday Wednesday Thursday Friday Saturday Sunday
Monday 30 30 30
Tuesday 30 30 30
Wednesday 30 30 30
Thursday 30 30 30
Friday
Saturday
Sunday 30 30 30
Total 60 90 90 90 60 30 30
Practice Exam
In each of the following, name the term defined or answer
the question. Answers are listed at the bottom.
1. The level of capacity for which a process was designed
and at which it operates at minimum cost.
2. A facility has a maximum capacity of 4,000 units
per day using overtime and skipping the daily main-
tenance routine. At 3,500 units per day, the facility
operates at a level where average cost per unit is mini-
mized. Currently, the process is scheduled to operate
at a level of 3,000 units per day. What is the capacity
utilization rate?
3. The concept that relates to gaining efficiency through
the full utilization of dedicated resources, such as peo-
ple and equipment.
4. A facility that limits its production to a single product
or a set of very similar products.
5. When multiple (usually similar) products can be
produced in a facility less expensively than a single
product.
6. The ability to serve more customers than expected.
7. In considering a capacity expansion, we have two
alternatives. The first alternative is expected to cost
$1,000,000 and has an expected profit of $500,000
over the next three years. The second alternative has
an expected cost of $800,000 and an expected profit of
$450,000 over the next three years. Which alternative
should we select, and what is the expected value of the
expansion? Assume a 10 percent interest rate.
8. In a service process such as the checkout counter in a
discount store, what is a good target percent for capac-
ity utilization?
Answers
to
Practice
Exam
1.
Best
operating
level
2.
85.7
percent
3.
Economies
of
scale
4.
Focused
factory
5.
Economies
of
scope
6.
Capacity
cush-
ion
7.
Alternative
1:
Present
value
=
500,000
×
(.909
+
.826
+
.751)
−
1,000,000
=
$243,000;
Alternative
2:
Present
value
=
450,000
×
(.909
+
.826
+
.751)
−
800,000
=
$318,700;
Alternative
2
is
best.
8.
70
percent.
Operations with 90 Beds (30 patients per day)
exhibit 5.7

More Related Content

What's hot

Donner case study om
Donner case study   omDonner case study   om
Donner case study omPratik Patel
 
Donner case Operations Management
Donner case Operations ManagementDonner case Operations Management
Donner case Operations ManagementHarish B
 
Supply Chain Management chap 6
Supply Chain Management chap 6Supply Chain Management chap 6
Supply Chain Management chap 6Umair Arain
 
Kristen's cookie company
Kristen's cookie companyKristen's cookie company
Kristen's cookie companyRachna Gupta
 
Kristen cookie case
Kristen cookie caseKristen cookie case
Kristen cookie casejldolan1
 
American Connector Company
American Connector CompanyAmerican Connector Company
American Connector CompanySubhradeep Mitra
 
Kristen Cookie case study
Kristen Cookie case studyKristen Cookie case study
Kristen Cookie case studyAmit Walawalkar
 
National cranberry case study
National cranberry case studyNational cranberry case study
National cranberry case studyRanjeet Singh
 
Donner Case, Operation Management, HBR case
Donner Case, Operation Management, HBR caseDonner Case, Operation Management, HBR case
Donner Case, Operation Management, HBR casealok kumar
 
HP Supply Chain Optimization
HP Supply Chain OptimizationHP Supply Chain Optimization
HP Supply Chain OptimizationSwapnil Pillai
 
Maccounting midwestofficeproducts
Maccounting midwestofficeproductsMaccounting midwestofficeproducts
Maccounting midwestofficeproductsmuditcool
 
Operations Case Winning Solution SIOM
Operations Case Winning Solution SIOM Operations Case Winning Solution SIOM
Operations Case Winning Solution SIOM Learn2Do
 
Omni channel fulfilment and supply chain management analytic
Omni channel fulfilment and supply chain management analyticOmni channel fulfilment and supply chain management analytic
Omni channel fulfilment and supply chain management analyticAmit Kumar Garg
 
Som national cranberry-cooperative
Som   national cranberry-cooperativeSom   national cranberry-cooperative
Som national cranberry-cooperativeRajendra Inani
 
Shouldice hospital final.ppt original
Shouldice hospital final.ppt originalShouldice hospital final.ppt original
Shouldice hospital final.ppt original96540
 

What's hot (20)

Donner case study om
Donner case study   omDonner case study   om
Donner case study om
 
Donner case Operations Management
Donner case Operations ManagementDonner case Operations Management
Donner case Operations Management
 
Supply Chain Management chap 6
Supply Chain Management chap 6Supply Chain Management chap 6
Supply Chain Management chap 6
 
class1 MBA
class1 MBAclass1 MBA
class1 MBA
 
Kristen's cookie company
Kristen's cookie companyKristen's cookie company
Kristen's cookie company
 
Kristen cookie case
Kristen cookie caseKristen cookie case
Kristen cookie case
 
American Connector Company
American Connector CompanyAmerican Connector Company
American Connector Company
 
Kristen Cookie case study
Kristen Cookie case studyKristen Cookie case study
Kristen Cookie case study
 
National cranberry case study
National cranberry case studyNational cranberry case study
National cranberry case study
 
Shouldice hospital
Shouldice hospitalShouldice hospital
Shouldice hospital
 
Donner Case, Operation Management, HBR case
Donner Case, Operation Management, HBR caseDonner Case, Operation Management, HBR case
Donner Case, Operation Management, HBR case
 
HP Supply Chain Optimization
HP Supply Chain OptimizationHP Supply Chain Optimization
HP Supply Chain Optimization
 
Maccounting midwestofficeproducts
Maccounting midwestofficeproductsMaccounting midwestofficeproducts
Maccounting midwestofficeproducts
 
Benihana
BenihanaBenihana
Benihana
 
Operations Case Winning Solution SIOM
Operations Case Winning Solution SIOM Operations Case Winning Solution SIOM
Operations Case Winning Solution SIOM
 
Omni channel fulfilment and supply chain management analytic
Omni channel fulfilment and supply chain management analyticOmni channel fulfilment and supply chain management analytic
Omni channel fulfilment and supply chain management analytic
 
HP Supply Chain
HP Supply ChainHP Supply Chain
HP Supply Chain
 
Som national cranberry-cooperative
Som   national cranberry-cooperativeSom   national cranberry-cooperative
Som national cranberry-cooperative
 
Shouldice hospital final.ppt original
Shouldice hospital final.ppt originalShouldice hospital final.ppt original
Shouldice hospital final.ppt original
 
Workload balancing
Workload balancingWorkload balancing
Workload balancing
 

Similar to Reading 3 Strategic Capacity Management.pdf

Capacity planning chapter 8
Capacity planning chapter 8Capacity planning chapter 8
Capacity planning chapter 8Yonela Gaba
 
Capacity Planning
Capacity PlanningCapacity Planning
Capacity PlanningMOHD ARISH
 
CHAPTER 3 System and design Capacity.pptx
CHAPTER 3 System and design Capacity.pptxCHAPTER 3 System and design Capacity.pptx
CHAPTER 3 System and design Capacity.pptxPeriMinstrel
 
Group 5 STRATEGY CAPACITY PLANNING (1).pptx
Group 5 STRATEGY CAPACITY PLANNING (1).pptxGroup 5 STRATEGY CAPACITY PLANNING (1).pptx
Group 5 STRATEGY CAPACITY PLANNING (1).pptxUnklabMedia
 
Capacity planning
Capacity planningCapacity planning
Capacity planningRatan479
 
CAPACITY & AGGREGATE PLANNING
CAPACITY & AGGREGATE PLANNINGCAPACITY & AGGREGATE PLANNING
CAPACITY & AGGREGATE PLANNINGVijit Gajbhiye
 
Chapter 5. Supply Planning Meeting Customer DemandAfter we’ve m.docx
Chapter 5. Supply Planning Meeting Customer DemandAfter we’ve m.docxChapter 5. Supply Planning Meeting Customer DemandAfter we’ve m.docx
Chapter 5. Supply Planning Meeting Customer DemandAfter we’ve m.docxrobert345678
 
Capacity resource planning and production scheduling
Capacity resource planning and production schedulingCapacity resource planning and production scheduling
Capacity resource planning and production schedulingdutconsult
 
Capacity Managment
Capacity ManagmentCapacity Managment
Capacity ManagmentNadia Sahar
 
Facility_Capacity_Planning_&_its_Measurement_Final[1] - Copy.pptx
Facility_Capacity_Planning_&_its_Measurement_Final[1] - Copy.pptxFacility_Capacity_Planning_&_its_Measurement_Final[1] - Copy.pptx
Facility_Capacity_Planning_&_its_Measurement_Final[1] - Copy.pptxMeetLalcheta
 
Facility Capacity Planning & its Measurement[1].pptx
Facility Capacity Planning & its Measurement[1].pptxFacility Capacity Planning & its Measurement[1].pptx
Facility Capacity Planning & its Measurement[1].pptxMeetLalcheta
 
Facility Capacity Planning & its Measurement[1] - Copy.pptx
Facility Capacity Planning & its Measurement[1] - Copy.pptxFacility Capacity Planning & its Measurement[1] - Copy.pptx
Facility Capacity Planning & its Measurement[1] - Copy.pptxMeetLalcheta
 
PoV - Navigating the Crude Cycle 2015 vF
PoV - Navigating the Crude Cycle 2015 vFPoV - Navigating the Crude Cycle 2015 vF
PoV - Navigating the Crude Cycle 2015 vFEdwin A. van der Stam
 
CAPACITY PLANNING AND ‎FACILITIES PLANNING
CAPACITY PLANNING AND ‎FACILITIES PLANNINGCAPACITY PLANNING AND ‎FACILITIES PLANNING
CAPACITY PLANNING AND ‎FACILITIES PLANNINGLibcorpio
 

Similar to Reading 3 Strategic Capacity Management.pdf (20)

Capacity planning chapter 8
Capacity planning chapter 8Capacity planning chapter 8
Capacity planning chapter 8
 
Capacity Planning
Capacity PlanningCapacity Planning
Capacity Planning
 
CHAPTER 3 System and design Capacity.pptx
CHAPTER 3 System and design Capacity.pptxCHAPTER 3 System and design Capacity.pptx
CHAPTER 3 System and design Capacity.pptx
 
Capacity planning
Capacity planningCapacity planning
Capacity planning
 
Capacity planning
Capacity planningCapacity planning
Capacity planning
 
Group 5 STRATEGY CAPACITY PLANNING (1).pptx
Group 5 STRATEGY CAPACITY PLANNING (1).pptxGroup 5 STRATEGY CAPACITY PLANNING (1).pptx
Group 5 STRATEGY CAPACITY PLANNING (1).pptx
 
Capacity Management
Capacity ManagementCapacity Management
Capacity Management
 
Capacity planning
Capacity planningCapacity planning
Capacity planning
 
Capacity management
Capacity managementCapacity management
Capacity management
 
CAPACITY & AGGREGATE PLANNING
CAPACITY & AGGREGATE PLANNINGCAPACITY & AGGREGATE PLANNING
CAPACITY & AGGREGATE PLANNING
 
Facility Laout
Facility LaoutFacility Laout
Facility Laout
 
Chapter 5. Supply Planning Meeting Customer DemandAfter we’ve m.docx
Chapter 5. Supply Planning Meeting Customer DemandAfter we’ve m.docxChapter 5. Supply Planning Meeting Customer DemandAfter we’ve m.docx
Chapter 5. Supply Planning Meeting Customer DemandAfter we’ve m.docx
 
Capacity resource planning and production scheduling
Capacity resource planning and production schedulingCapacity resource planning and production scheduling
Capacity resource planning and production scheduling
 
Capacity Managment
Capacity ManagmentCapacity Managment
Capacity Managment
 
Facility_Capacity_Planning_&_its_Measurement_Final[1] - Copy.pptx
Facility_Capacity_Planning_&_its_Measurement_Final[1] - Copy.pptxFacility_Capacity_Planning_&_its_Measurement_Final[1] - Copy.pptx
Facility_Capacity_Planning_&_its_Measurement_Final[1] - Copy.pptx
 
Facility Capacity Planning & its Measurement[1].pptx
Facility Capacity Planning & its Measurement[1].pptxFacility Capacity Planning & its Measurement[1].pptx
Facility Capacity Planning & its Measurement[1].pptx
 
Facility Capacity Planning & its Measurement[1] - Copy.pptx
Facility Capacity Planning & its Measurement[1] - Copy.pptxFacility Capacity Planning & its Measurement[1] - Copy.pptx
Facility Capacity Planning & its Measurement[1] - Copy.pptx
 
PoV - Navigating the Crude Cycle 2015 vF
PoV - Navigating the Crude Cycle 2015 vFPoV - Navigating the Crude Cycle 2015 vF
PoV - Navigating the Crude Cycle 2015 vF
 
CAPACITY PLANNING AND ‎FACILITIES PLANNING
CAPACITY PLANNING AND ‎FACILITIES PLANNINGCAPACITY PLANNING AND ‎FACILITIES PLANNING
CAPACITY PLANNING AND ‎FACILITIES PLANNING
 
Matching Supply and Demand
Matching Supply and DemandMatching Supply and Demand
Matching Supply and Demand
 

Recently uploaded

Lucknow 💋 Escorts in Lucknow - 450+ Call Girl Cash Payment 8923113531 Neha Th...
Lucknow 💋 Escorts in Lucknow - 450+ Call Girl Cash Payment 8923113531 Neha Th...Lucknow 💋 Escorts in Lucknow - 450+ Call Girl Cash Payment 8923113531 Neha Th...
Lucknow 💋 Escorts in Lucknow - 450+ Call Girl Cash Payment 8923113531 Neha Th...anilsa9823
 
Russian Faridabad Call Girls(Badarpur) : ☎ 8168257667, @4999
Russian Faridabad Call Girls(Badarpur) : ☎ 8168257667, @4999Russian Faridabad Call Girls(Badarpur) : ☎ 8168257667, @4999
Russian Faridabad Call Girls(Badarpur) : ☎ 8168257667, @4999Tina Ji
 
Eni 2024 1Q Results - 24.04.24 business.
Eni 2024 1Q Results - 24.04.24 business.Eni 2024 1Q Results - 24.04.24 business.
Eni 2024 1Q Results - 24.04.24 business.Eni
 
Vip Dewas Call Girls #9907093804 Contact Number Escorts Service Dewas
Vip Dewas Call Girls #9907093804 Contact Number Escorts Service DewasVip Dewas Call Girls #9907093804 Contact Number Escorts Service Dewas
Vip Dewas Call Girls #9907093804 Contact Number Escorts Service Dewasmakika9823
 
Sales & Marketing Alignment: How to Synergize for Success
Sales & Marketing Alignment: How to Synergize for SuccessSales & Marketing Alignment: How to Synergize for Success
Sales & Marketing Alignment: How to Synergize for SuccessAggregage
 
VIP Call Girl Jamshedpur Aashi 8250192130 Independent Escort Service Jamshedpur
VIP Call Girl Jamshedpur Aashi 8250192130 Independent Escort Service JamshedpurVIP Call Girl Jamshedpur Aashi 8250192130 Independent Escort Service Jamshedpur
VIP Call Girl Jamshedpur Aashi 8250192130 Independent Escort Service JamshedpurSuhani Kapoor
 
Call Girls In Sikandarpur Gurgaon ❤️8860477959_Russian 100% Genuine Escorts I...
Call Girls In Sikandarpur Gurgaon ❤️8860477959_Russian 100% Genuine Escorts I...Call Girls In Sikandarpur Gurgaon ❤️8860477959_Russian 100% Genuine Escorts I...
Call Girls In Sikandarpur Gurgaon ❤️8860477959_Russian 100% Genuine Escorts I...lizamodels9
 
Call Girls In Connaught Place Delhi ❤️88604**77959_Russian 100% Genuine Escor...
Call Girls In Connaught Place Delhi ❤️88604**77959_Russian 100% Genuine Escor...Call Girls In Connaught Place Delhi ❤️88604**77959_Russian 100% Genuine Escor...
Call Girls In Connaught Place Delhi ❤️88604**77959_Russian 100% Genuine Escor...lizamodels9
 
0183760ssssssssssssssssssssssssssss00101011 (27).pdf
0183760ssssssssssssssssssssssssssss00101011 (27).pdf0183760ssssssssssssssssssssssssssss00101011 (27).pdf
0183760ssssssssssssssssssssssssssss00101011 (27).pdfRenandantas16
 
/:Call Girls In Jaypee Siddharth - 5 Star Hotel New Delhi ➥9990211544 Top Esc...
/:Call Girls In Jaypee Siddharth - 5 Star Hotel New Delhi ➥9990211544 Top Esc.../:Call Girls In Jaypee Siddharth - 5 Star Hotel New Delhi ➥9990211544 Top Esc...
/:Call Girls In Jaypee Siddharth - 5 Star Hotel New Delhi ➥9990211544 Top Esc...lizamodels9
 
Mondelez State of Snacking and Future Trends 2023
Mondelez State of Snacking and Future Trends 2023Mondelez State of Snacking and Future Trends 2023
Mondelez State of Snacking and Future Trends 2023Neil Kimberley
 
Monte Carlo simulation : Simulation using MCSM
Monte Carlo simulation : Simulation using MCSMMonte Carlo simulation : Simulation using MCSM
Monte Carlo simulation : Simulation using MCSMRavindra Nath Shukla
 
A DAY IN THE LIFE OF A SALESMAN / WOMAN
A DAY IN THE LIFE OF A  SALESMAN / WOMANA DAY IN THE LIFE OF A  SALESMAN / WOMAN
A DAY IN THE LIFE OF A SALESMAN / WOMANIlamathiKannappan
 
Lowrate Call Girls In Sector 18 Noida ❤️8860477959 Escorts 100% Genuine Servi...
Lowrate Call Girls In Sector 18 Noida ❤️8860477959 Escorts 100% Genuine Servi...Lowrate Call Girls In Sector 18 Noida ❤️8860477959 Escorts 100% Genuine Servi...
Lowrate Call Girls In Sector 18 Noida ❤️8860477959 Escorts 100% Genuine Servi...lizamodels9
 
2024 Numerator Consumer Study of Cannabis Usage
2024 Numerator Consumer Study of Cannabis Usage2024 Numerator Consumer Study of Cannabis Usage
2024 Numerator Consumer Study of Cannabis UsageNeil Kimberley
 
Lowrate Call Girls In Laxmi Nagar Delhi ❤️8860477959 Escorts 100% Genuine Ser...
Lowrate Call Girls In Laxmi Nagar Delhi ❤️8860477959 Escorts 100% Genuine Ser...Lowrate Call Girls In Laxmi Nagar Delhi ❤️8860477959 Escorts 100% Genuine Ser...
Lowrate Call Girls In Laxmi Nagar Delhi ❤️8860477959 Escorts 100% Genuine Ser...lizamodels9
 
GD Birla and his contribution in management
GD Birla and his contribution in managementGD Birla and his contribution in management
GD Birla and his contribution in managementchhavia330
 
Pharma Works Profile of Karan Communications
Pharma Works Profile of Karan CommunicationsPharma Works Profile of Karan Communications
Pharma Works Profile of Karan Communicationskarancommunications
 

Recently uploaded (20)

Lucknow 💋 Escorts in Lucknow - 450+ Call Girl Cash Payment 8923113531 Neha Th...
Lucknow 💋 Escorts in Lucknow - 450+ Call Girl Cash Payment 8923113531 Neha Th...Lucknow 💋 Escorts in Lucknow - 450+ Call Girl Cash Payment 8923113531 Neha Th...
Lucknow 💋 Escorts in Lucknow - 450+ Call Girl Cash Payment 8923113531 Neha Th...
 
Russian Faridabad Call Girls(Badarpur) : ☎ 8168257667, @4999
Russian Faridabad Call Girls(Badarpur) : ☎ 8168257667, @4999Russian Faridabad Call Girls(Badarpur) : ☎ 8168257667, @4999
Russian Faridabad Call Girls(Badarpur) : ☎ 8168257667, @4999
 
Best Practices for Implementing an External Recruiting Partnership
Best Practices for Implementing an External Recruiting PartnershipBest Practices for Implementing an External Recruiting Partnership
Best Practices for Implementing an External Recruiting Partnership
 
Eni 2024 1Q Results - 24.04.24 business.
Eni 2024 1Q Results - 24.04.24 business.Eni 2024 1Q Results - 24.04.24 business.
Eni 2024 1Q Results - 24.04.24 business.
 
Vip Dewas Call Girls #9907093804 Contact Number Escorts Service Dewas
Vip Dewas Call Girls #9907093804 Contact Number Escorts Service DewasVip Dewas Call Girls #9907093804 Contact Number Escorts Service Dewas
Vip Dewas Call Girls #9907093804 Contact Number Escorts Service Dewas
 
Sales & Marketing Alignment: How to Synergize for Success
Sales & Marketing Alignment: How to Synergize for SuccessSales & Marketing Alignment: How to Synergize for Success
Sales & Marketing Alignment: How to Synergize for Success
 
VIP Call Girl Jamshedpur Aashi 8250192130 Independent Escort Service Jamshedpur
VIP Call Girl Jamshedpur Aashi 8250192130 Independent Escort Service JamshedpurVIP Call Girl Jamshedpur Aashi 8250192130 Independent Escort Service Jamshedpur
VIP Call Girl Jamshedpur Aashi 8250192130 Independent Escort Service Jamshedpur
 
Call Girls In Sikandarpur Gurgaon ❤️8860477959_Russian 100% Genuine Escorts I...
Call Girls In Sikandarpur Gurgaon ❤️8860477959_Russian 100% Genuine Escorts I...Call Girls In Sikandarpur Gurgaon ❤️8860477959_Russian 100% Genuine Escorts I...
Call Girls In Sikandarpur Gurgaon ❤️8860477959_Russian 100% Genuine Escorts I...
 
Call Girls In Connaught Place Delhi ❤️88604**77959_Russian 100% Genuine Escor...
Call Girls In Connaught Place Delhi ❤️88604**77959_Russian 100% Genuine Escor...Call Girls In Connaught Place Delhi ❤️88604**77959_Russian 100% Genuine Escor...
Call Girls In Connaught Place Delhi ❤️88604**77959_Russian 100% Genuine Escor...
 
0183760ssssssssssssssssssssssssssss00101011 (27).pdf
0183760ssssssssssssssssssssssssssss00101011 (27).pdf0183760ssssssssssssssssssssssssssss00101011 (27).pdf
0183760ssssssssssssssssssssssssssss00101011 (27).pdf
 
/:Call Girls In Jaypee Siddharth - 5 Star Hotel New Delhi ➥9990211544 Top Esc...
/:Call Girls In Jaypee Siddharth - 5 Star Hotel New Delhi ➥9990211544 Top Esc.../:Call Girls In Jaypee Siddharth - 5 Star Hotel New Delhi ➥9990211544 Top Esc...
/:Call Girls In Jaypee Siddharth - 5 Star Hotel New Delhi ➥9990211544 Top Esc...
 
Mondelez State of Snacking and Future Trends 2023
Mondelez State of Snacking and Future Trends 2023Mondelez State of Snacking and Future Trends 2023
Mondelez State of Snacking and Future Trends 2023
 
Monte Carlo simulation : Simulation using MCSM
Monte Carlo simulation : Simulation using MCSMMonte Carlo simulation : Simulation using MCSM
Monte Carlo simulation : Simulation using MCSM
 
A DAY IN THE LIFE OF A SALESMAN / WOMAN
A DAY IN THE LIFE OF A  SALESMAN / WOMANA DAY IN THE LIFE OF A  SALESMAN / WOMAN
A DAY IN THE LIFE OF A SALESMAN / WOMAN
 
Lowrate Call Girls In Sector 18 Noida ❤️8860477959 Escorts 100% Genuine Servi...
Lowrate Call Girls In Sector 18 Noida ❤️8860477959 Escorts 100% Genuine Servi...Lowrate Call Girls In Sector 18 Noida ❤️8860477959 Escorts 100% Genuine Servi...
Lowrate Call Girls In Sector 18 Noida ❤️8860477959 Escorts 100% Genuine Servi...
 
2024 Numerator Consumer Study of Cannabis Usage
2024 Numerator Consumer Study of Cannabis Usage2024 Numerator Consumer Study of Cannabis Usage
2024 Numerator Consumer Study of Cannabis Usage
 
Lowrate Call Girls In Laxmi Nagar Delhi ❤️8860477959 Escorts 100% Genuine Ser...
Lowrate Call Girls In Laxmi Nagar Delhi ❤️8860477959 Escorts 100% Genuine Ser...Lowrate Call Girls In Laxmi Nagar Delhi ❤️8860477959 Escorts 100% Genuine Ser...
Lowrate Call Girls In Laxmi Nagar Delhi ❤️8860477959 Escorts 100% Genuine Ser...
 
KestrelPro Flyer Japan IT Week 2024 (English)
KestrelPro Flyer Japan IT Week 2024 (English)KestrelPro Flyer Japan IT Week 2024 (English)
KestrelPro Flyer Japan IT Week 2024 (English)
 
GD Birla and his contribution in management
GD Birla and his contribution in managementGD Birla and his contribution in management
GD Birla and his contribution in management
 
Pharma Works Profile of Karan Communications
Pharma Works Profile of Karan CommunicationsPharma Works Profile of Karan Communications
Pharma Works Profile of Karan Communications
 

Reading 3 Strategic Capacity Management.pdf

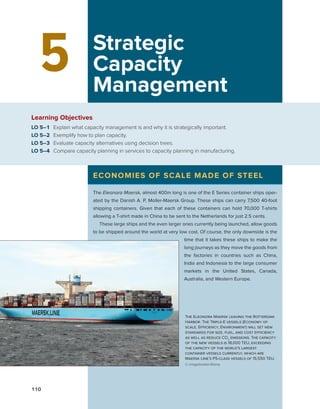
  • 1. 110 5 Strategic Capacity Management Learning Objectives LO 5–1 Explain what capacity management is and why it is strategically important. LO 5–2 Exemplify how to plan capacity. LO 5–3 Evaluate capacity alternatives using decision trees. LO 5–4 Compare capacity planning in services to capacity planning in manufacturing. ECONOMIES OF SCALE MADE OF STEEL The Eleonora Maersk, almost 400m long is one of the E Series container ships oper- ated by the Danish A. P. Moller-Maersk Group. These ships can carry 7,500 40-foot shipping containers. Given that each of these containers can hold 70,000 T-shirts allowing a T-shirt made in China to be sent to the Netherlands for just 2.5 cents. These large ships and the even larger ones currently being launched, allow goods to be shipped around the world at very low cost. Of course, the only downside is the time that it takes these ships to make the long journeys as they move the goods from the factories in countries such as China, India and Indonesia to the large consumer markets in the United States, Canada, ­ Australia, and Western Europe. The Eleonora Maersk leaving the Rotterdam Harbor. The Triple-E vessels (Economy of scale, Efficiency, Environment) will set new standards for size, fuel, and cost efficiency as well as reduce CO2 emissions. The capacity of the new vessels is 18,000 TEU, exceeding the capacity of the world’s largest container vessels currently, which are Maersk Line’s PS-class vessels of 15,550 TEU. © imagebroker/Alamy F.R. Jacobs, R.B. Chase (2018). “Operations and Supply Chain Management,” 15th Edition, McGraw Hill publication. Chapter 5.
  • 2. Strategic Capacity Management Chapter 5 111 A dictionary definition of capacity is “the ability to hold, receive, store, or accommodate.” In a general business sense, it is most frequently viewed as the amount of output that a system is capable of achieving over a specific period of time. In a service setting, this might be the number of customers that can be handled between noon and 1:00 P.M. In manufacturing, this might be the number of automobiles that can be produced in a single shift. When looking at capacity, operations managers need to look at both resource inputs and product outputs. For planning purposes, real (or effective) capacity depends on what is to be produced. For example, a firm that makes multiple products inevitably can produce more of one kind than of another with a given level of resource inputs. Thus, while the managers of an automobile factory may state that their facility has 6,000 production hours available per year, they are also thinking that these hours can be used to make either 150,000 two-door models or 120,000 four-door models (or some mix of the two- and four-door models). This reflects their knowledge of what their current technology and labor force inputs can produce and the product mix that is to be demanded from these resources. While many industries measure and report their capacity in terms of outputs, those whose product mix is very uncertain often express capacity in terms of inputs. For example, hospital capacity is expressed as the number of beds because the number of patients served and the types of services provided will depend on patient needs. An operations and supply chain management view also emphasizes the time dimension of capacity. That is, capacity must also be stated relative to some period of time. This is evi- denced in the common distinction drawn between long-range, intermediate-range, and short- range capacity planning. Capacity planning is generally viewed in three time durations: Long range—greater than one year. Where productive resources (such as buildings, equip- ment, or facilities) take a long time to acquire or dispose of, long-range capacity planning requires top management participation and approval. Intermediate range—monthly or quarterly plans for the next 6 to 18 months. Here, capac- ity may be varied by such alternatives as hiring, layoffs, new tools, minor equipment pur- chases, and subcontracting. Short range—less than one month. This is tied into the daily or weekly scheduling process and involves making adjustments to eliminate the variance between planned and actual output. This includes alternatives such as overtime, personnel transfers, and alternative production routings. In this chapter, our focus is on capacity planning related to the long-term decisions. These involve the purchase of highly capital-intensive items, such as buildings, equipment, and other assets. The medium-term capacity-related decisions are considered as part of the aggregate operations planning decisions, which are the topic of Chapter 19. Short-term capacity planning is discussed in the context of the different types of processes discussed in the book: manufac- turing in Chapter 7, service in Chapter 9, and material requirements planning in Chapter 21. Although there is no one person with the job title “capacity manager,” there are several managerial positions charged with the effective use of capacity. Capacity is a relative term; in an operations management context, it may be defined as the amount of resource inputs avail- able relative to output requirements over a particular period of time. The objective of strategic capacity planning is to provide an approach for determining the overall capacity level of capital-intensive resources—facilities, equipment, and overall labor force size—that best supports the company’s long-term competitive strategy. The capac- ity level selected has a critical impact on the firm’s response rate, its cost structure, its inven- tory policies, and its management and staff support requirements. If capacity is inadequate, a company may lose customers through slow service or by allowing competitors to enter the CAPACITY MANAGEMENT IN OPERATIONS AND SUPPLY CHAIN MANAGEMENT Strategic capacity planning Finding the overall capacity level of capital-intensive resources to best support the firm’s long-term strategy. Explain what capacity management is and why it is strategically important. LO 5–1
  • 3. 112 Section 1 Strategy, Products, and Capacity market. If capacity is excessive, a company may have to reduce prices to stimulate demand; underutilize its workforce; carry excess inventory; or seek additional, less profitable products to stay in business. Capacity Planning Concepts The term capacity implies an attainable rate of output, for example, 480 cars per day, but says nothing about how long that rate can be sustained. Thus, we do not know if this 480 cars per day is a one-day peak or a six-month average. To avoid this problem, the concept of best operating level is used. This is the level of capacity for which the process was designed and thus is the volume of output at which average unit cost is minimized. Determining this mini- mum is difficult because it involves a complex trade-off between the allocation of fixed over- head costs and the cost of overtime, equipment wear, defect rates, and other costs. An important measure is the capacity utilization rate, which reveals how close a firm is to its best operating level: ​ ​ Capacity utilization rate = ​ Capacity used    ______________    Best operating level ​ ​ ​ ​ Capacity utilization rate = ​ 480 ___ 500 ​= .96 or 96%​ The capacity utilization rate is expressed as a percentage and requires that the numerator and denominator be measured in the same units and time periods (such as machine hours/day, bar- rels of oil/day, or dollars of output/day). Economies and Diseconomies of Scale The basic notion of economies of scale is that as a plant gets larger and volume increases, the average cost per unit of output drops. This is partially due to lower operating and capital cost, because a piece of equipment with twice the capacity of another piece typically does not cost twice as much to purchase or operate. Plants also gain efficiencies when they become large enough to fully utilize dedicated resources (people and equipment) for information technol- ogy, material handling, and administrative support. At some point, the size of a plant becomes too large and diseconomies of scale become a problem. These diseconomies may surface in many different ways. For example, maintain- ing the demand required to keep the large facility busy may require significant discounting of the product. The U.S. automobile manufacturers continually face this problem. Another typical example involves using a few large-capacity pieces of equipment. Minimizing equip- ment downtime is essential in this type of operation. M&M Mars, for example, has highly automated, high-volume equip- ment to make M&Ms. A single packaging line moves 2.6 mil- lion M&Ms each hour. Even though direct labor to operate the equipment is very low, the labor required to maintain the equipment is high. In many cases, the size of a plant may be influenced by fac- tors other than the internal equipment, labor, and other capi- tal expenditures. A major factor may be the cost to transport raw materials and finished product to and from the plant. A cement factory, for example, would have a difficult time serv- ing customers more than a few hours from its plant. Similarly, automobile companies such as Ford, Honda, Nissan, and Toy- ota have found it advantageous to locate plants within specific international markets. The anticipated size of these intended markets will largely dictate the size and capacity of the plants. Jaguar, the luxury automobile producer, recently found it had too many plants. Jaguar was employing 8,560 workers in three plants that produced 126,122 cars, about 15 cars per employee. Capacity The output that a system is capable of achieving over a period of time. Best operating level The level of capacity for which the process was designed and the volume of output at which average unit cost is minimized. Capacity utilization rate Measure of how close the firm’s current output rate is to its best operating level (percent). [5.1] Economies of scale Idea that as the plant gets larger and volume increases, the average cost per unit drops. At some point, the plant gets too large and cost per unit increases. The production of M&M’s. M&M’S® is a registered trademark of Mars, Incorporated. This trademark and the photograph depicting M&M’S® chocolate candies are used with permission. Mars, Incorporated is not associated with McGraw-Hill. © Patrick Hertzog/AFP/Getty Images
  • 4. Strategic Capacity Management Chapter 5 113 In comparison, Volvo’s plant in Torslanda, Sweden, was nearly twice as productive, building 158,466 cars with 5,472 workers, or 29 cars per employee. By contrast, BMW AG’s Mini unit made 174,000 vehicles at a single British plant with just 4,500 workers, or 39 cars per employee. Capacity Focus The concept of a focused factory holds that a production facility works best when it focuses on a fairly limited set of production objectives. This means, for example, that a firm should not expect to excel in every aspect of manufacturing performance: cost, quality, delivery speed and reliability, changes in demand, and flexibility to adapt to new products. Rather, it should select a limited set of tasks that contribute the most to corporate objectives. Typically, the focused factory would produce a specific product or related group of products. A focused factory allows capacity to be focused on producing those specific items. The capacity focus concept can be operationalized through the mechanism of plant within a plant—or PWP. A focused factory (Exhibit 5.1) may have several PWPs, each of which may have separate suborganizations, equipment and process policies, workforce management poli- cies, production control methods, and so forth, for different products—even if they are made under the same roof. This, in effect, permits finding the best operating level for each depart- ment of the organization and thereby carries the focus concept down to the operating level. Capacity Flexibility Capacity flexibility means having the ability to rapidly increase or decrease production levels, or to shift production capacity quickly from one product or service to another. Such flexibility is achieved through flexible plants, processes, and workers, as well as through strategies that use the capacity of other organizations. Increasingly, companies are taking the idea of flex- ibility into account as they design their supply chains. Working with suppliers, they can build capacity into their whole systems. Flexible Plants Perhaps the ultimate in plant flexibility is the zero-changeover-time plant. Using movable equipment, knockdown walls, and easily accessible and reroutable utilities, such a plant can quickly adapt to change. An analogy to a familiar service business captures the flavor well: a plant with equipment that is easy to install and easy to tear down and move—like the Ringling Bros. and Barnum & Bailey Circus in the old tent-circus days. Flexible Processes Flexible processes are epitomized by flexible manufacturing systems on the one hand and simple, easily set up equipment on the other. Both of these Plant within a plant (PWP) An area in a larger facility that is dedicated to a specific production objective (for example, product group). This can be used to operationalize the focused factory concept. This company needs to produce two different products. Product A is high volume and standard (there is no variation in how it is made). Product B is low volume and needs to be customized to each order. This plant is divided into three distinct areas that operate independently. The Product Line A area is a high-volume assembly line designed to produce A. B Machine Shop is an area where custom parts are made for product B. Assembly B is where product B is assembled based on each customer order. This factory, with its plants within a plant, can operate more efficiently than if both products were made with a single common production process. Product Line A Assembly – High Volume – Low Variety – Low Skill – Low Volume – High Variety – High Skill B Machine Shop Product Line B Assembly Focused Factories—Plant within a Plant exhibit 5.1 Focused factory A facility designed around a limited set of production objectives. Typically, the focus would relate to a specific product or product group.
  • 5. 114 Section 1 Strategy, Products, and Capacity technological approaches permit rapid low-cost switching from one product to another, enabling what are sometimes referred to as economies of scope. (By definition, economies of scope exist when multiple products can be combined and produced at one facility at a lower cost than they can be produced separately.) Flexible Worke rs Flexible workers have multiple skills and the ability to switch easily from one kind of task to another. They require broader training than specialized workers and need managers and staff support to facilitate quick changes in their work assignments. Economies of scope When multiple products can be produced at lower cost in combination than they can be separately. Employees work on a production line of Dell notebook computers at a new plant of Wistron Group, which is the main partner of Dell and Lenovo, in Chengdu, Sichuan Province of China. © ChinaFotoPress/ChinaFotoPress/Newscom CAPACITY PLANNING Considerations in Changing Capacity Many issues must be considered when adding or decreasing capacity. Three important ones are maintaining system balance, frequency of capacity additions or reductions, and use of external capacity. Maintaini ng System Balance In a perfectly balanced plant with three production stages, the output of stage 1 provides the exact input requirement for stage 2. Stage 2’s output provides the exact input requirement for stage 3, and so on. In practice, however, achieving such a “perfect” design is usually both impossible and undesirable. One reason is that the best operating levels for each stage generally differ. For instance, department 1 may operate most efficiently over a range of 90 to 110 units per month, whereas department 2, the next stage in the process, is most efficient at 75 to 85 units per month, and department 3 works best over a range of 150 to 200 units per month. Another reason is that variability in product demand and the processes themselves may lead to imbalance. There are various ways of dealing with imbalance. One is to add capacity to stages that are bottlenecks. This can be done by temporary measures, such as scheduling overtime, leasing equipment, or purchasing additional capacity through subcontracting. A second way is through the use of buffer inventories in front of the bottleneck stage to ensure it always has something to work on. A third approach involves duplicating or increasing the facilities of one department on which another is dependent. All these approaches are increasingly being applied to supply chain design. This supply planning also helps reduce imbalances for supplier partners and customers. Frequenc y of Capacity Additions There are two types of costs to consider when adding capacity: the cost of upgrading too frequently and that of upgrading too infrequently. Upgrading capacity too frequently is expensive. Direct costs include removing and replacing old equipment and training employees on the new equipment. In addition, the new equipment must be purchased, often for considerably more than the selling price of the old. Finally, there is the opportunity cost of idling the plant or service site during the changeover period. Conversely, upgrading capacity too infrequently is also expensive. Infrequent expansion means that capacity is pur- chased in larger chunks. Any excess capacity that is purchased must be carried as overhead until it is utilized. (Exhibit 5.2 illustrates frequent versus infrequent capacity expansion.) External Sources of Operations and Supply Capacity In some cases, it may be cheaper not to add capacity at all, but rather to use some existing external source of capacity. Two common strategies used by organizations are outsourcing and sharing capacity. An example of outsourcing is Dell Computer using a Chinese company to assemble its notebook computers. An example of sharing capacity is two domestic airlines flying different Exemplify how to plan capacity. LO 5–2
  • 6. Strategic Capacity Management Chapter 5 115 routes with different seasonal demands exchanging aircraft (suitably repainted) when one’s routes are heavily used and the other’s are not. A new twist is airlines sharing routes—using the same flight number even though the airline company may change through the route. Outsourcing is covered in more depth in Chapter 16. Decreasing Capacity Although we normally think in terms of expansions, shedding capacity in response to decreased demand can create significant problems for a firm. Temporary strategies such as scheduling fewer hours or scheduling an extended shutdown period are often used. More permanent reductions in capacity would typically require the sale of equipment or possibly even the liquidation of entire facilities. Determining Capacity Requirements In determining capacity requirements, we must address the demands for individual product lines, individual plant capabilities, and allocation of production throughout the plant network. Typically, this is done according to the following steps: 1. Use forecasting techniques (see Chapter 18) to predict sales for individual products within each product line. 2. Calculate equipment and labor requirements to meet product line forecasts. 3. Project labor and equipment availabilities over the planning horizon. Often, the firm then decides on some capacity cushion that will be maintained between the projected requirements and the actual capacity measured as a percentage in excess of the expected demand. A capacity cushion is an amount of capacity in excess of expected demand. For example, if the expected annual demand on a facility is $10 million in prod- ucts per year and the design capacity is $12 million per year, it has a 20 percent capacity ­ cushion. A 20 percent capacity cushion equates to an 83 percent utilization rate (100 ­ percent/120 percent). When a firm’s design capacity is less than the capacity required to meet its demand, it is said to have a negative capacity cushion. If, for example, a firm has a demand of $12 million in products per year but can produce only $10 million per year, it has a negative capacity cushion of 16.7 percent. We now apply these three steps to an example. Capacity cushion Capacity in excess of expected demand. Volume Capacity level (infrequent expansion) Years Capacity level (frequent expansion) Small chunk Large chunk Demand forecast Frequent versus Infrequent Capacity Expansion exhibit 5.2
  • 7. 116 Section 1 Strategy, Products, and Capacity EXAMPLE 5.1: Determining Capacity Requirements Stewart Company produces two brands of salad dressings: Paul’s and Newman’s. Each is available in bottles and single-serving plastic bags. Management would like to determine yearly equipment and labor requirements for its packing operation for the next five years. The details related to the exact weekly and monthly scheduling of the operations are done at dif- ferent levels in the planning process. The demand for the two flavors and for each packaging option is given in this table. The company has three machines that can each package 150,000 bottles each year (each machine has two operators). It also has five machines that can each package 250,000 plastic bags per year (each of these machines has three operators). These capacity numbers have been adjusted for expected downtime and quality problems. Will the company have enough yearly packag- ing capacity to meet future demand? Year 1 2 3 4 5 Paul’s Bottles (000s) 60 100 150 200 250 Plastic bags (000s) 100 200 300 400 500 Newman’s Bottles (000s) 75 85 95 97 98 Plastic bags (000s) 200 400 600 650 680 Year 1 2 3 4 5 Bottles (000s) 135 185 245 297 348 Plastic bags (000s) 300 600 900 1,050 1,180 SOLUTION Step 1. Use forecasting techniques to predict sales for individual products within each product line. The marketing department, which is now running a promotional campaign for Newman’s dressing, provided the forecast demand values given in the previous table (in thousands) for the next five years. The campaign is expected to continue for the next two years. Step 2. Calculate equipment and labor requirements to meet product line forecasts. Cur- rently, three machines that can package up to 150,000 bottles each per year are available. Each machine requires two operators and can produce bottles of both Newman’s and Paul’s dressings. Six bottle machine operators are available. Also, five machines that can package up to 250,000 plastic bags each per year are available. Three operators are required for each machine, which can produce plastic bags of both Newman’s and Paul’s dressings. Currently, 15 plastic bag machine operators are available. Total product line forecasts can be calculated from the preceding table by adding the yearly demand for bottles and plastic bags as follows. We can now calculate equipment and labor requirements for the current year (year 1). Because the total available capacity for packaging bottles is 450,000/year (3 machines × 150,000 each), we will be using 135,000/450,000 = 0.3 or 30 percent of the available capacity for the current year, or 135,000/150,000 = 0.9 machine. Similarly, we will need 300,000/1,250,000 = 0.24 or 24 percent of the available capacity for plastic bags for the cur- rent year, or 300,000/250,000 = 1.2 machines. The total number of crew required to support our forecast demand for the first year will equal the crew required for the bottle machine plus the crew required for the plastic bag machine. The labor requirement for year 1 is ​ ​ 0.9 bottle machine × 2 operators = 1.8 operators ​      1.2 bag machines × 3 operators = 3.6 operators ​ ​
  • 8. Strategic Capacity Management Chapter 5 117 EXAMPLE 5.2: Decision Trees The owner of Hackers Computer Store is considering what to do with his business over the next five years. Sales growth over the past couple of years has been good, but sales could grow substantially if a major proposed electronics firm is built in his area. Hackers’ owner sees three options. The first is to enlarge his current store, the second is to locate at a new site, and the third is to simply wait and do nothing. The process of expanding or moving would take little time, and, therefore, the store would not lose revenue. If nothing were done the first year and strong growth occurred, then the decision to expand could be reconsidered. Waiting longer than one year would allow competition to move in and would make expansion no longer feasible. Step 3. Project labor and equipment availabilities over the planning horizon. We repeat the preceding calculations for the remaining years. Year 1 2 3 4 5 Bottle Operation Percentage machine capacity utilized 30% 41% 54.4% 66% 77.3% Machine requirement 0.9 1.23 1.63 1.98 2.32 Labor requirement 1.8 2.46 3.26 3.96 4.64 Plastic Bag Operation Percentage machine capacity utilized 24% 48% 72% 84% 94% Machine requirement 1.2 2.4 3.6 4.2 4.7 Labor requirement 3.6 7.2 10.8 12.6 14.1 A positive capacity cushion exists for all five years relative to the availability of machines because the available capacity for both operations always exceeds the expected demand. Stewart Company can now begin to develop the intermediate-range sales and operations plan for the two production lines. This operations plan would need to address the issue of how these machines might actually be scheduled relative to the use of overtime and/or multiple shifts over weekly and monthly time intervals. A convenient way to lay out the steps of a capacity problem is through the use of decision trees. The tree format helps not only in understanding the problem but also in finding a solu- tion. A decision tree is a schematic model of the sequence of steps in a problem and the con- ditions and consequences of each step. In recent years, a few commercial software packages have been developed to assist in the construction and analysis of decision trees. These pack- ages make the process quick and easy. Decision trees are composed of decision nodes with branches extending to and from them. Usually squares represent decision points and circles represent chance events. Branches from decision points show the choices available to the decision maker; branches from chance events show the probabilities for their occurrence. In solving decision tree problems, we work from the end of the tree backward to the start of the tree. As we work back, we calculate the expected values at each step. In calculating the expected value, the time value of money is important if the planning horizon is long. Once the calculations are made, we prune the tree by eliminating from each decision point all branches except the one with the highest payoff. This process continues to the first deci- sion point, and the decision problem is thereby solved. We now demonstrate an application of capacity planning for Hackers Computer Store. USING DECISION TREES TO EVALUATE CAPACITY ALTERNATIVES Evaluate capacity alternatives using decision trees. LO 5–3
  • 9. 118 Section 1 Strategy, Products, and Capacity Alternative Revenue Cost Value Move to new location, strong growth $195,000 × 5 yrs $210,000 $765,000 Move to new location, weak growth $115,000 × 5 yrs $210,000 $365,000 Expand store, strong growth $190,000 × 5 yrs $87,000 $863,000 Expand store, weak growth $100,000 × 5 yrs $87,000 $413,000 Do nothing now, strong growth, expand next year $170,000 × 1 yr + $190,000 × 4 yrs $87,000 $843,000 Do nothing now, strong growth, do not expand next year $170,000 × 5 yrs $0 $850,000 Do nothing now, weak growth $105,000 × 5 yrs $0 $525,000 The assumptions and conditions are as follows: 1. Strong growth as a result of the increased population of computer fanatics from the new electronics firm has a 55 percent probability. 2. Strong growth with a new site would give annual returns of $195,000 per year. Weak growth with a new site would mean annual returns of $115,000. 3. Strong growth with an expansion would give annual returns of $190,000 per year. Weak growth with an expansion would mean annual returns of $100,000. 4. At the existing store with no changes, there would be returns of $170,000 per year if there is strong growth and $105,000 per year if growth is weak. 5. Expansion at the current site would cost $87,000. 6. The move to the new site would cost $210,000. 7. If growth is strong and the existing site is enlarged during the second year, the cost would still be $87,000. 8. Operating costs for all options are equal. SOLUTION We construct a decision tree to advise Hackers’ owner on the best action. Exhibit 5.3 shows the decision tree for this problem. There are two decision points (shown with the square nodes) and three chance occurrences (round nodes). The values of each alternative outcome shown on the right of the diagram in Exhibit 5.4 are calculated as follows. Hackers Computer Store Move Expand Do nothing Strong growth Weak growth Strong growth Weak growth Strong growth Weak growth Expand Do nothing Revenue – Move_Cost Revenue – Move_Cost Revenue – Expansion_Cost Revenue – Expansion_Cost Revenue – Expansion_Cost Revenue .55 .45 .55 .55 .45 .45 Revenue Decision Tree for Hackers Computer Store Problem exhibit 5.3
  • 10. Strategic Capacity Management Chapter 5 119 Hackers Computer Store Move Expand Do nothing Strong growth Weak growth Strong growth Weak growth Strong growth Weak growth Expand Do nothing Revenue – Move_Cost = $365,000 Revenue – Move_Cost = $765,000 Revenue – Expansion_Cost = $413,000 Revenue – Expansion_Cost = $863,000 Revenue – Expansion_Cost = $843,000 Revenue = $850,000 0.550 0.450 0.550 0.550 0.450 0.450 Revenue = $525,000 $660,500 Do nothing; $703,750 $703,750 Do nothing; $850,000 $585,000 Decision Tree Analysis exhibit 5.4 Decision Tree Analysis Using Net Present Value Calculations exhibit 5.5 Hackers Computer Store Move Expand Do nothing Strong growth Weak growth Strong growth Weak growth Strong growth Weak growth Expand Do nothing Revenue – Move_Cost = $166,544 Revenue – Move_Cost = $428,487 Revenue – Expansion_Cost = $240,429 Revenue – Expansion_Cost = $535,116 Revenue – Expansion_Cost = $529,874 Revenue = $556,630 0.550 0.450 0.550 0.550 0.450 0.450 Revenue = $343,801 $402,507 $460,857 Do nothing; $556,630 $310,613 NPV Analysis Rate = 16% Working from the rightmost alternatives, which are associated with the decision of whether to expand, we see that the alternative of doing nothing has a higher value than the expansion alternative. We therefore eliminate the expansion in the second year alternatives. What this means is that if we do nothing in the first year and we experience strong growth, then in the second year it makes no sense to expand. Now we can calculate the expected values associated with our current decision alternatives. We simply multiply the value of the alternative by its probability and sum the values. The expected value for the alternative of moving now is $585,000. The expansion alternative has an expected value of $660,500, and doing nothing now has an expected value of $703,750. Our analysis indicates that our best decision is to do nothing (both now and next year)! Due to the five-year time horizon, it may be useful to consider the time value of the rev- enue and cost streams when solving this problem. If we assume a 16 percent interest rate, the first alternative outcome (move now, strong growth) has a discounted revenue valued at $428,487 (195,000 × 3.274293654) minus the $210,000 cost to move immediately. Exhibit 5.5
  • 11. 120 Section 1 Strategy, Products, and Capacity shows the analysis considering the discounted flows. Details of the calculations are given as follows. The present value table in Appendix E can be used to look up the discount factors. In order to make our calculations agree with those completed by Excel—in Excel, calculate the discount factor = (1 + interest rate)(–years) —we have used discount factors that are calculated to 10 digits of precision. The only calculation that is a little tricky is the one for revenue when we do nothing now and expand at the beginning of next year. In this case, we have a revenue stream of $170,000 the first year, followed by four years at $190,000. The first part of the cal- culation (170,000 × .862068966) discounts the first-year revenue to the present. The next part (190,000 × 2.798180638) discounts the next four years to the start of year 2. We then discount this four-year stream to the present value. Alternative Revenue Cost Value Move to new location, strong growth $195,000 × 3.274293654 $210,000 $428,487 Move to new location, weak growth $115,000 × 3.274293654 $210,000 $166,544 Expand store, strong growth $190,000 × 3.274293654 $87,000 $535,116 Expand store, weak growth $100,000 × 3.274293654 $87,000 $240,429 Do nothing now, strong growth, expand next year $170,000 × .862068966 + $190,000 × 2.798180638 × .862068966 $87,000 × .862068966 $529,874 Do nothing now, strong growth, do not expand next year $170,000 × 3.274293654 $0 $556,630 Do nothing now, weak growth $105,000 × 3.274293654 $0 $343,801 PLANNING SERVICE CAPACITY Capacity Planning in Services versus Manufacturing Although capacity planning in services is subject to many of the same issues as manufactur- ing capacity planning, and facility sizing can be done in much the same way, there are several important differences. Service capacity is more time- and location-dependent, it is subject to more volatile demand fluctuations, and utilization directly impacts service quality. Time Unlike goods, services cannot be stored for later use. As such, in services, managers must consider time as one of their supplies. The capacity must be available to produce a service when it is needed. For example, a customer cannot be given a seat that went unoccupied on a previous airline flight if the current flight is full. Nor can the customer purchase a seat on a particular day’s flight and take it home to be used at some later date. Location In face-to-face settings, the service capacity must be located near the customer. In manufacturing, production takes place, and then the goods are distributed to the customer. With services, however, the opposite is true. The capacity to deliver the service must first be distributed to the customer (either physically or through some communications medium, such as the telephone), then the service can be produced. A hotel room or rental car that is available in another city is not much use to the customer—it must be where the customer is when that customer needs it. Volatility of Demand The volatility of demand on a service delivery system is much higher than that on a manufacturing production system for three reasons. First, as just mentioned, services cannot be stored. This means that inventory cannot smooth the demand as in manufacturing. The second reason is that the customers interact directly with Compare capacity planning in services to capacity planning in manufacturing. LO 5–4
  • 12. Strategic Capacity Management Chapter 5 121 jac66107_ch05_110-129.indd 121 01/11/17 11:55 AM the production system—and these customers often have different needs, will have different levels of experience with the process, and may require a different number of transactions. This contributes to greater variability in the processing time required for each customer and hence greater variability in the minimum capacity needed. The third reason for the greater volatility in service demand is that it is directly affected by consumer behavior. Influences on customer behavior ranging from the weather to a major event can directly affect demand for different services. Go to any restaurant near your campus during spring break and it will probably be almost empty. This behavioral effect can be seen over even shorter time frames, such as the lunch-hour rush at a fast-food restaurant’s drive-through window. Because of this volatility, service capacity is often planned in increments as small as 10 to 30 minutes, as opposed to the one-week increments more common in manufacturing. Capacity Utilization and Service Quality Planning capacity levels for services must consider the day-to-day relationship between ser- vice utilization and service quality. Exhibit 5.6 shows a service situation using waiting line terms (arrival rates and service rates). The term arrival rate refers to the average number of customers that come to a facility during a specific period of time. The service rate is the aver- age number of customers that can be processed over the same period of time when the facility is operating at maximum capacity. The best operating point is near 70 percent of the maxi- mum capacity. This is enough to keep servers busy but allows enough time to serve customers individually and keep enough capacity in reserve so as not to create too many managerial headaches. In the critical zone, customers are processed through the system, but service qual- ity declines. Above the critical zone, where customers arrive at a rate faster than they can be served, the line builds up and it is likely that many customers may never be served. (Details related to how waiting lines operate relative to capacity are presented in Chapter 10, “Waiting Line Analysis and Simulation.”) The optimal utilization rate is very context specific. Low rates are appropriate when both the degree of uncertainty and the stakes are high. For example, hospital emergency rooms and fire departments should aim for low utilization because of the high level of uncertainty and the life-or-death nature of their activities. Relatively predictable services such as commuter trains or service facilities without customer contact (for example, postal sorting operations) can plan to operate much nearer to 100 percent utilization. Interestingly, there is a third group for which high utilization is desirable. All sports teams like sellouts, not only because of the virtually 100 percent contribution margin of each customer, but because a full house creates an atmosphere that pleases customers, motivates the home team to perform better, and boosts future ticket sales. Stage performances and bars share this phenomenon. Typically, a firm can run a factory at a much higher capacity utilization rate than a service facility such as a call center. Less predictable demand requires a lower capacity operating point for good service. KEY IDEAS Mean arrival rate (λ) Zone of nonservice (μ λ) Critical zone Zone of service Mean service rate (μ) ρ = 100% ρ = 70% μ λ Relationship between the Rate of Service Utilization (ρ) and Service Quality exhibit 5.6 J. Haywood–Farmer and J. Nollet, Services Plus: Effective Service Managment (Boucherville, Quebec, Canada: G. Morin Publisher Ltd., 1991), p. 59. Final PDF to printer
  • 13. 122 Section 1 Strategy, Products, and Capacity Ohio State fans cheer the Buckeyes on during the first half of their game against Youngstown State. © Jamie Sabau/Getty Images Concept Connections LO 5–1 Explain what capacity management is and why it is strategically important. Summary ∙ An operations and supply chain management view of capacity emphasizes the time dimension of capacity. ∙ Three time horizons are generally used: long range (greater than a year), intermediate range (next 6 to 18 months), and short range (less than a month). ∙ To distinguish between the absolute maximum capac- ity of the system (the highest output rate attainable) and the rate that is sustainable by the system (that it can be run at efficiently and for a long period of time), the term best operating level is used. The utilization of the system is a measure of how close the system is operating relative to the best level. ∙ When a producing resource, such as a manufactur- ing plant, gets larger and volume increases while the average cost per unit of output simultaneously drops, then the resource is exhibiting economies of scale. ∙ At some point, the resource may be too large and the average cost will start to rise. This is when disecono- mies of scale are a problem. ∙ Focused manufacturing plants are designed to produce multiple products using a concept called plant within a plant to improve economies of scale even though mul- tiple products are produced in the same facility. This type of facility demonstrates the concept of economies of scope. ∙ Having capacity flexibility is often important to meet- ing the needs of a firm’s customers. Key Terms Strategic capacity planning Finding the overall capacity level of capital-intensive resources to best support the firm’s long-term strategy. Capacity The output that a system is capable of achiev- ing over a period of time. Best operating level The level of capacity for which the process was designed and the volume of output at which average unit cost is minimized. Capacity utilization rate Measure of how close the firm’s current output rate is to its best operating level (percent). Economies of scale Idea that as the plant gets larger and volume increases, the average cost per unit drops. At some point, the plant gets too large and cost per unit increases.
  • 14. Strategic Capacity Management Chapter 5 123 Focused factory A facility designed around a limited set of production objectives. Typically, the focus would relate to a specific product or product group. Plant within a plant (PWP) An area in a larger facility that is dedicated to a specific production objective (for example, product group). This can be used to operation- alize the focused factory concept. Economies of scope When multiple products can be produced at lower cost in combination than they can be separately. ​ ​ Capacity utilization rate = ​ Capacity used    ______________    Best operating level ​ ​ ​ ​ ​​ ​ [5.1]​ ​ LO 5–2 Exemplify how to plan capacity. ∙ From a strategic, long-term view, capacity additions or reductions come in chunks (fixed amounts). For example, an additional machine of a certain type is added to the existing pool of machines. Issues involve how frequently and how much capacity is added or removed over time. Summary Key Terms Capacity cushion Capacity in excess of expected demand. LO 5–3 Evaluate capacity alternatives using decision trees. ∙ A useful technique for analyzing capacity problems is the decision tree. ∙ With this format, the sequences of decisions are orga- nized like branches in a tree. ∙ The potential consequences of the decisions are enu- merated and evaluated based on their probability of occurrence and corresponding expected value. Summary LO 5–4 Compare capacity planning in services to capacity planning in manufacturing. ∙ Often, services require that capacity be available immediately and that it be near where the customer resides. For example, a bank needs automated teller machines (ATMs) close to where customers want immediate cash, and enough of them so customers will not have to wait in long lines. ∙ Also, firms that offer services often need to deal with dramatic changes in customer demand over time (for example, the lunch-hour rush at a bank’s drive- through window). Summary Solved Problem E-Education is a new startup that develops and markets MBA courses offered over the Inter- net. The company is currently located in Chicago and employs 150 people. Due to strong growth, the company needs additional office space. The company has the option of leasing additional space at its current location in Chicago for the next two years, but after that will need to move to a new building. Another option the company is considering is moving the entire operation to a small Midwest town immediately. A third option is for the company to lease a new building in Chicago immediately. If the company chooses the first option and leases new space at its current location, it can, at the end of two years, either lease a new building in Chicago or move to the small Midwest town. LO 5–3
  • 15. 124 Section 1 Strategy, Products, and Capacity The following are some additional facts about the alternatives and current situation: 1. The company has a 75 percent chance of surviving the next two years. 2. Leasing the new space for two years at the current location in Chicago would cost $750,000 per year. 3. Moving the entire operation to a Midwest town would cost $1 million. Leasing space would run only $500,000 per year. 4. Moving to a new building in Chicago would cost $200,000, and leasing the new building’s space would cost $650,000 per year. 5. The company can cancel the lease at any time. 6. The company will build its own building in five years, if it survives. 7. Assume all other costs and revenues are the same no matter where the company is located. What should E-Education do? Solution Step 1: Construct a decision tree that considers all of E-Education’s alternatives. The fol- lowing shows the tree that has decision points (with the square nodes) followed by chance occurrences (round nodes). In the case of the first decision point, if the company survives, two additional decision points need consideration. E-Education Stay in Chicago Lease current space for two years Survive (.75) Survive (.75) Lease new space in Chicago Stay in Chicago Lease new space Move to Midwest town Move to Midwest $3,650,000 $3,450,000 $3,112,500 $2,962,500 Fail (.25) Fail (.25) $4,000,000 $1,500,000 $1,500,000 Survive (.75) $3,500,000 $3,125,000 Fail (.25) $2,000,000 Step 2: Calculate the values of each alternative as follows. Alternative Calculation Value Stay in Chicago, lease current space for two years, survive, lease new building in Chicago (750,000) × 2 + 200,000 + (650,000) × 3 = $3,650,000 Stay in Chicago, lease current space for two years, survive, move to Midwest (750,000) × 2 + 1,000,000 + (500,000) × 3 = $4,000,000 Stay in Chicago, lease current space for two years, fail (750,000) × 2 = $1,500,000 Stay in Chicago, lease new building in Chicago, survive 200,000 + (650,000) × 5 = $3,450,000 Stay in Chicago, lease new building in Chicago, fail 200,000 + (650,000) × 2 = $1,500,000 Move to Midwest, survive 1,000,000 + (500,000) × 5 = $3,500,000 Move to Midwest, fail 1,000,000 + (500,000) × 2 = $2,000,000 Working from our rightmost alternatives, the first two alternatives end in decision nodes. If we fail after the first two years, represented by the third alternative, the cost is only $1,500,000. The expected value of the first option of staying in Chicago and leasing space for the first two years is .75 × 3,650,000 + .25 × 1,500,000 = $3,112,500.
  • 16. Strategic Capacity Management Chapter 5 125 The second option, staying in Chicago and leasing a new building now, has an expected value of .75 × 3,450,000 + .25 × 1,500,000 = $2,962,500. Finally, the third option of moving to the Midwest immediately has an expected value of .75 × 3,500,000 + .25 × 2,000,000 = $3,125,000. From this, it looks like the best alternative is to stay in Chicago and lease a new building immediately. Discussion Questions   1. What capacity problems are encountered when a new drug is introduced to the market?   2. List some practical limits to economies of scale. In other words, when should a plant stop growing?  3. What are some capacity balance problems faced by the following organizations or facilities? a. An airline terminal b. A university computing lab c. A clothing manufacturer   4. At first glance, the concepts of the focused factory and capacity flexibility may seem to contradict each other. Do they really?   5. Management may choose to build up capacity in anticipation of demand or in response to developing demand. Cite the advantages and disadvantages of both approaches.   6. What is capacity balance? Why is it hard to achieve? What methods are used to deal with capacity imbalances?   7. What are some reasons for a plant to maintain a capacity cushion? How about a negative capacity cushion?   8. Will the use of decision tree analysis guarantee the best decision for a firm? Why or why not? If not, why bother using it?   9. Consider the example in Exhibit 5.5. Can you think of anything else you might do with that example that would be helpful to the ultimate decision maker? 10. What are some major capacity considerations in a hospital? How do they differ from those of a factory? 11. Refer to Exhibit 5.6. Why is it that the critical zone begins at a utilization rate of about 70 percent in a typical service operation? Draw upon your own experiences as either a customer or a server in common service establishments. LO5–1 LO5–2 LO5–3 LO5–4 Objective Questions 1. A manufacturing shop is designed to operate most efficiently at an output of 550 units per day. In the past month, the plant averaged 490 units per day. What was its capacity utiliza- tion rate last month? (Answer in Appendix D) 2. A company has a factory that is designed so that it is most efficient (average unit cost is minimized) when producing 15,000 units of output each month. However, it has an abso- lute maximum output capability of 17,250 units per month, and can produce as little as 7,000 units per month without corporate headquarters shifting production to another plant. If the factory produces 10,925 units in October, what is the capacity utilization rate in October for this factory? 3. Hoosier Manufacturing operates a production shop that is designed to have the lowest unit production cost at an output rate of 100 units per hour. In the month of July, the company operated the production line for a total of 175 hours and produced 16,900 units of output. What was its capacity utilization rate for the month? 4. AlwaysRain Irrigation, Inc. would like to determine capacity requirements for the next four years. Currently, two production lines are in place for making bronze and plastic sprin- klers. Three types of sprinklers are available in both bronze and plastic: 90-degree nozzle LO5–1 LO5–2
  • 17. 126 Section 1 Strategy, Products, and Capacity sprinklers, 180-degree nozzle sprinklers, and 360-degree nozzle sprinklers. Management has forecast demand for the next four years as follows. Yearly Demand 1 (in 000s) 2 (in 000s) 3 (in 000s) 4 (in 000s) Plastic 90 32 44 55 56 Plastic 180 15 16 17 18 Plastic 360 50 55 64 67 Bronze 90 11 15 18 23 Bronze 180 6 5 6 9 Bronze 360 15 16 17 20 Yearly Demand 1 (in 000s) 2 (in 000s) 3 (in 000s) 4 (in 000s) Plastic 90 32 44 55 56 Plastic 180 15 16 17 18 Plastic 360 50 55 64 67 Bronze 90 7 8 9 10 Bronze 180 3 4 5 6 Bronze 360 11 12 15 18 Both production lines can produce all the different types of nozzles. The bronze machines needed for the bronze sprinklers require two operators and can produce up to 12,000 sprin- klers. The plastic injection molding machine needed for the plastic sprinklers requires four operators and can produce up to 200,000 sprinklers. Three bronze machines and only one injection molding machine are available. What are the capacity requirements for the next four years? (Assume that there is no learning.) 5. Suppose that AlwaysRain Irrigation’s marketing department will undertake an intense ad campaign for the bronze sprinklers, which are more expensive but also more durable than the plastic ones. Forecast demand for the next four years is as follows. What are the capacity implications of the marketing campaign (assume no learning)? 6. In anticipation of the ad campaign, AlwaysRain bought an additional bronze machine. Will this be enough to ensure that adequate capacity is available? 7. Suppose that operators have enough training to operate both the bronze machines and the injection molding machine for the plastic sprinklers. Currently, AlwaysRain has 10 such employees. In anticipation of the ad campaign described in problem 5, management approved the purchase of two additional bronze machines. What are the labor requirement implications? 8. Expando, Inc. is considering the possibility of building an additional factory that would produce a new addition to its product line. The company is currently considering two options. The first is a small facility that it could build at a cost of $6 million. If demand for new products is low, the company expects to receive $10 million in discounted revenues (present value of future revenues) with the small facility. On the other hand, if demand is high, it expects $12 million in discounted revenues using the small facility. The second option is to build a large factory at a cost of $9 million. Were demand to be low, the com- pany would expect $10 million in discounted revenues with the large plant. If demand is high, the company estimates that the discounted revenues would be $14 million. In either case, the probability of demand being high is .40, and the probability of it being low is .60. Not constructing a new factory would result in no additional revenue being generated because the current factories cannot produce these new products. Construct a decision tree to help Expando make the best decision. (Answer in Appendix D) LO5–3
  • 18. Strategic Capacity Management Chapter 5 127   9. A builder has located a piece of property that she would like to buy and eventually build on. The land is currently zoned for four homes per acre, but she is planning to request new zoning. What she builds depends on approval of zoning requests and your analysis of this problem to advise her. With her input and your help, the decision process has been reduced to the following costs, alternatives, and probabilities:    Cost of land: $2 million    Probability of rezoning: .60    If the land is rezoned, there will be additional costs for new roads, lighting, and so on, of $1 million.    If the land is rezoned, the contractor must decide whether to build a shopping cen- ter or 1,500 apartments that the tentative plan shows would be possible. If she builds a shopping center, there is a 70 percent chance that she can sell the shopping center to a large department store chain for $4 million over her construction cost, which excludes the land; and there is a 30 percent chance that she can sell it to an insurance company for $5 million over her construction cost (also excluding the land). If, instead of the shopping center, she decides to build the 1,500 apartments, she places probabilities on the profits as follows: There is a 60 percent chance that she can sell the apartments to a real estate investment corporation for $3,000 each over her construction cost; there is a 40 percent chance that she can get only $2,000 each over her construction cost. (Both exclude the land cost.)    If the land is not rezoned, she will comply with the existing zoning restrictions and simply build 600 homes, on which she expects to make $4,000 over the construction cost on each one (excluding the cost of land).    Draw a decision tree of the problem and determine the best solution and the expected net profit. 10. Owners of a local restaurant are concerned about their ability to provide quality service as they continue to grow and attract more customers. They have collected data from Fri- day and Saturday nights, their busiest times of the week. During these time periods, about 75 customers arrive per hour for service. Given the number of tables and chairs, and the typical time it takes to serve a customer, the owners estimate they can serve, on average, about 100 customers per hour. During these nights, are they in the zone of service, the critical zone, or the zone of nonservice? (Answer in Appendix D) 11. Owners of the restaurant in the prior problem anticipate that in one year their demand will double as long as they can provide good service to their customers. How much will they have to increase their service capacity to stay out of the critical zone? LO5–4 “Shouldice Hospital, the house that hernias built, is a converted country estate which gives the hospital ‘a country club’ appeal.” A quote from American Medical News Shouldice Hospital in Canada is widely known for one thing—hernia repair! In fact, that is the only operation it performs, and it performs a great many of them. Over the past two decades this small 90-bed hospital has aver- aged 7,000 operations annually. Last year, it had a record year and performed nearly 7,500 operations. Patients’ ties to Shouldice do not end when they leave the hospital. Every year, the gala Hernia Reunion dinner (with com- plimentary hernia inspection) draws in over 1,000 former patients, some of whom have been attending the event for over 30 years. A number of notable features in Shouldice’s service delivery system contribute to its success: (1) Shouldice accepts only patients with uncomplicated external her- nias, and uses a superior technique developed for this type of hernia by Dr. Shouldice during World War II. (2) Patients are subject to early ambulation, which pro- motes healing. (Patients literally walk off the operating table and engage in light exercise throughout their stay, which lasts only three days.) (3) Its country club atmo- sphere, gregarious nursing staff, and built-in socializing make a surprisingly pleasant experience out of an inher- ently unpleasant medical problem. Regular times are set aside for tea, cookies, and socializing. All patients are paired up with a roommate with a similar background and interests. Case: Shouldice Hospital—A Cut Above
  • 19. 128 Section 1 Strategy, Products, and Capacity The Production System The medical facilities at Shouldice consist of five oper- ating rooms, a patient recovery room, a laboratory, and six examination rooms. Shouldice performs, on average, 150 operations per week, with patients generally staying at the hospital for three days. Although operations are performed only five days a week, the remainder of the hospital is in operation continuously to attend to recover- ing patients. An operation at Shouldice Hospital is performed by one of the 12 full-time surgeons, and assisted by one of seven part-time assistant surgeons. Surgeons gener­ ally take about one hour to prepare for and perform each hernia operation, and they operate on four patients per day. The surgeons’ day ends at 4 P.M., although they can expect to be on call every 14th night and every 10th weekend. The Shouldice Experience Each patient undergoes a screening exam prior to setting a date for his or her operation. Patients in the Toronto area are encouraged to walk in for the diagnosis. Exami- nations are done between 9 A.M. and 3:30 P.M. Monday through Friday, and between 10 A.M. and 2 P.M. on Sat- urday. Out-of-town patients are mailed a medical infor- mation questionnaire (also available over the Internet), which is used for the diagnosis. A small percentage of the patients who are overweight or otherwise represent an undue medical risk are refused treatment. The remaining patients receive confirmation cards with the scheduled dates for their operations. A patient’s folder is transferred to the reception desk once an arrival date is confirmed. Patients arrive at the clinic between 1 and 3 P.M. the day before their surgery. After a short wait, they receive a brief preoperative examination. They are then sent to an admissions clerk to complete any necessary paperwork. Patients are next directed to one of the two nurses’ sta- tions for blood and urine tests and then are shown to their rooms. They spend the remaining time before orienta- tion getting settled and acquainting themselves with their roommates. Orientation begins at 5 P.M., followed by dinner in the common dining room. Later in the evening, at 9 P.M., patients gather in the lounge area for tea and cookies. Here, new patients can talk with patients who have already had their surgery. Bedtime is between 9:30 and 10 P.M. On the day of the operation, patients with early opera- tions are awakened at 5:30 A.M. for preoperative sedation. The first operations begin at 7:30 A.M. Shortly before an operation starts, the patient is administered a local anes- thetic, leaving him or her alert and fully aware of the pro- ceedings. At the conclusion of the operation, the patient is invited to walk from the operating table to a nearby wheelchair, which is waiting to return the patient to his or her room. After a brief period of rest, the patient is encouraged to get up and start exercising. By 9 P.M. that day, he or she is in the lounge having cookies and tea and talking with new, incoming patients. The skin clips holding the incision together are loos- ened, and some even removed, the next day. The remain- der are removed the following morning just before the patient is discharged. When Shouldice Hospital started, the average hospi- tal stay for hernia surgery was three weeks. Today, many institutions push “same day surgery” for a variety of rea- sons. Shouldice Hospital firmly believes that this is not in the best interests of patients and is committed to its three-day process. Shouldice’s postoperative rehabilita- tion program is designed to enable the patient to resume normal activities with minimal interruption and discom- fort. Shouldice patients frequently return to work in a few days; the average total time off is eight days. “It is interesting to note that approximately 1 out of every 100 Shouldice patients is a medical doctor.” Future Plans The management of Shouldice is thinking of expanding the hospital’s capacity to serve considerable unsatisfied demand. To this effect, the vice president is seriously considering two options. The first involves adding one more day of operations (Saturday) to the existing five- day schedule, which would increase capacity by 20 per- cent. The second option is to add another floor of rooms to the hospital, increasing the number of beds by 50 per- cent. This would require more aggressive scheduling of the operating rooms. The administrator of the hospital, however, is con- cerned about maintaining control over the quality of the service delivered. He thinks the facility is already getting very good utilization. The doctors and the staff are happy with their jobs, and the patients are satisfied with the service. According to him, further expansion of capacity might make it hard to maintain the same kind of working relationships and attitudes. Questions Exhibit 5.7 is a room-occupancy table for the existing system. Each row in the table follows the patients who checked in on a given day. The columns indicate the number of patients in the hospital on a given day. For example, the first row of the table shows that 30 peo- ple checked in on Monday and were in the hospital for Monday, Tuesday, and Wednesday. By summing the col- umns of the table for Wednesday, we see that there are 90 patients staying in the hospital that day. 1. How well is the hospital currently utilizing its beds? 2. Develop a similar table to show the effects of adding operations on Saturday. (Assume that 30 operations
  • 20. Strategic Capacity Management Chapter 5 129 would still be performed each day.) How would this affect the utilization of the bed capacity? Is this capacity sufficient for the additional patients? 3. Now look at the effect of increasing the number of beds by 50 percent. How many operations could the hospital perform per day before running out of bed capacity? (Assume operations are performed five days per week, with the same number performed on each day.) How well would the new resources be utilized relative to the current operation? Could the hospital really perform this many operations? Why? (Hint: Look at the capacity of the 12 surgeons and the five operating rooms.) 4. Although financial data are sketchy, an estimate from a construction company indicates that adding bed capac- ity would cost about $100,000 per bed. In addition, the rate charged for the hernia surgery varies between about $900 and $2,000 (U.S. dollars), with an average rate of $1,300 per operation. The surgeons are paid a flat $600 per operation. Due to all the uncertainties in govern- ment health care legislation, Shouldice would like to justify any expansion within a five-year time period. Beds Required Check-in Day Monday Tuesday Wednesday Thursday Friday Saturday Sunday Monday 30 30 30 Tuesday 30 30 30 Wednesday 30 30 30 Thursday 30 30 30 Friday Saturday Sunday 30 30 30 Total 60 90 90 90 60 30 30 Practice Exam In each of the following, name the term defined or answer the question. Answers are listed at the bottom. 1. The level of capacity for which a process was designed and at which it operates at minimum cost. 2. A facility has a maximum capacity of 4,000 units per day using overtime and skipping the daily main- tenance routine. At 3,500 units per day, the facility operates at a level where average cost per unit is mini- mized. Currently, the process is scheduled to operate at a level of 3,000 units per day. What is the capacity utilization rate? 3. The concept that relates to gaining efficiency through the full utilization of dedicated resources, such as peo- ple and equipment. 4. A facility that limits its production to a single product or a set of very similar products. 5. When multiple (usually similar) products can be produced in a facility less expensively than a single product. 6. The ability to serve more customers than expected. 7. In considering a capacity expansion, we have two alternatives. The first alternative is expected to cost $1,000,000 and has an expected profit of $500,000 over the next three years. The second alternative has an expected cost of $800,000 and an expected profit of $450,000 over the next three years. Which alternative should we select, and what is the expected value of the expansion? Assume a 10 percent interest rate. 8. In a service process such as the checkout counter in a discount store, what is a good target percent for capac- ity utilization? Answers to Practice Exam 1. Best operating level 2. 85.7 percent 3. Economies of scale 4. Focused factory 5. Economies of scope 6. Capacity cush- ion 7. Alternative 1: Present value = 500,000 × (.909 + .826 + .751) − 1,000,000 = $243,000; Alternative 2: Present value = 450,000 × (.909 + .826 + .751) − 800,000 = $318,700; Alternative 2 is best. 8. 70 percent. Operations with 90 Beds (30 patients per day) exhibit 5.7