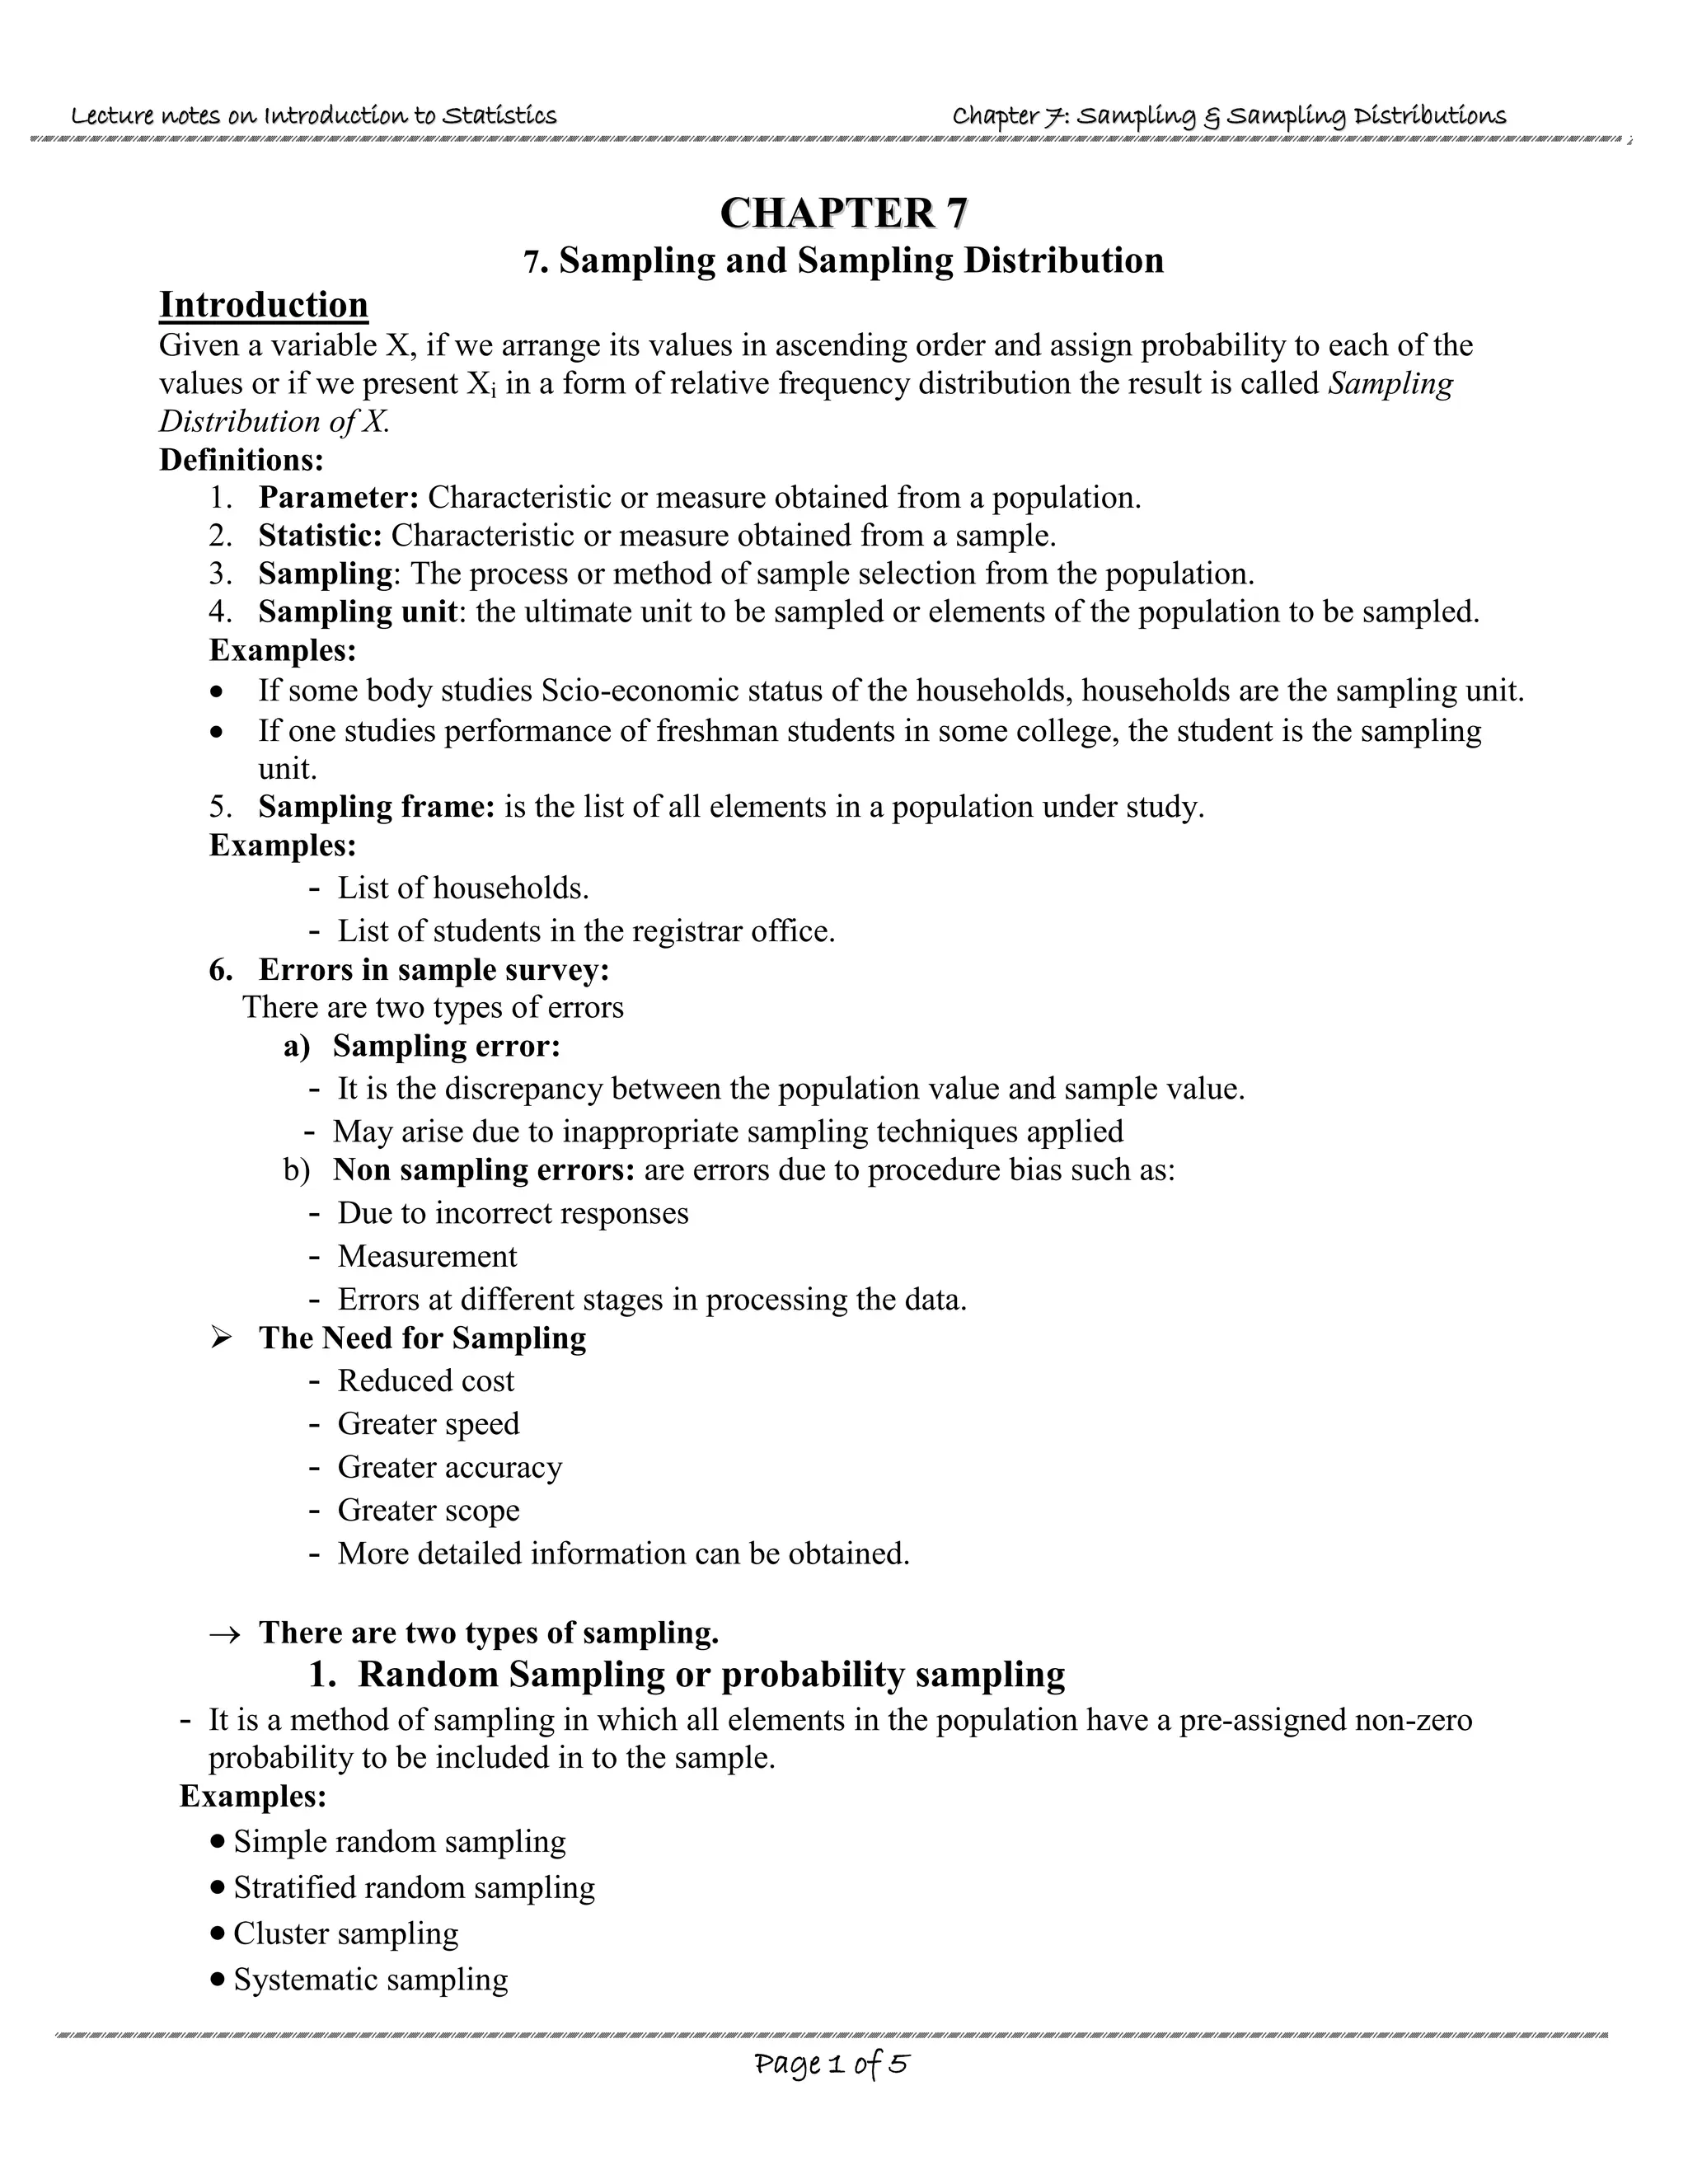
L
Le
ec
ct
tu
ur
re
e n
no
ot
te
es
s o
on
n I
In
nt
tr
ro
od
du
uc
ct
ti
io
on
n t
to
o S
St
ta
at
ti
is
st
ti
ic
cs
s C
Ch
ha
ap
pt
te
er
r 7
7:
: S
Sa
am
mp
pl
li
in
ng
g &
& S
Sa
am
mp
pl
li
in
ng
g D
Di
is
st
tr
ri
ib
bu
ut
ti
io
on
ns
s
Page 1 of 5
C
CH
HA
AP
PT
TE
ER
R 7
7
7. Sampling and Sampling Distribution
Introduction
Given a variable X, if we arrange its values in ascending order and assign probability to each of the
values or if we present Xi in a form of relative frequency distribution the result is called Sampling
Distribution of X.
Definitions:
1. Parameter: Characteristic or measure obtained from a population.
2. Statistic: Characteristic or measure obtained from a sample.
3. Sampling: The process or method of sample selection from the population.
4. Sampling unit: the ultimate unit to be sampled or elements of the population to be sampled.
Examples:
 If some body studies Scio-economic status of the households, households are the sampling unit.
 If one studies performance of freshman students in some college, the student is the sampling
unit.
5. Sampling frame: is the list of all elements in a population under study.
Examples:
- List of households.
- List of students in the registrar office.
6. Errors in sample survey:
There are two types of errors
a) Sampling error:
- It is the discrepancy between the population value and sample value.
- May arise due to inappropriate sampling techniques applied
b) Non sampling errors: are errors due to procedure bias such as:
- Due to incorrect responses
- Measurement
- Errors at different stages in processing the data.
 The Need for Sampling
- Reduced cost
- Greater speed
- Greater accuracy
- Greater scope
- More detailed information can be obtained.
 There are two types of sampling.
1. Random Sampling or probability sampling
- It is a method of sampling in which all elements in the population have a pre-assigned non-zero
probability to be included in to the sample.
Examples:
 Simple random sampling
 Stratified random sampling
 Cluster sampling
 Systematic sampling
L
Le
ec
ct
tu
ur
re
e n
no
ot
te
es
s o
on
n I
In
nt
tr
ro
od
du
uc
ct
ti
io
on
n t
to
o S
St
ta
at
ti
is
st
ti
ic
cs
s C
Ch
ha
ap
pt
te
er
r 7
7:
: S
Sa
am
mp
pl
li
in
ng
g &
& S
Sa
am
mp
pl
li
in
ng
g D
Di
is
st
tr
ri
ib
bu
ut
ti
io
on
ns
s
Page 2 of 5
i. Simple Random Sampling:
- It is a method of selecting items from a population such that every possible sample of specific
size has an equal chance of being selected. In this case, sampling may be with or without
replacement. Or
- All elements in the population have the same pre-assigned non-zero probability to be
included in to the sample.
- Simple random sampling can be done either using the lottery method or table of random
numbers.
ii. Stratified Random Sampling:
- The population will be divided in to non-overlapping but exhaustive groups called strata.
- Simple random samples will be chosen from each stratum.
- Elements in the same strata should be more or less homogeneous while different in different
strata.
- It is applied if the population is heterogeneous.
- Some of the criteria for dividing a population into strata are: Sex (male, female); Age (under
18, 18 to 28, 29 to 39,); Occupation (blue-collar, professional, and other).
iii. Cluster Sampling:
- The population is divided in to non-overlapping groups called clusters.
- A simple random sample of groups or cluster of elements is chosen and all the sampling units
in the selected clusters will be surveyed.
- Clusters are formed in a way that elements with in a cluster are heterogeneous, i.e.
observations in each cluster should be more or less dissimilar.
- Cluster sampling is useful when it is difficult or costly to generate a simple random sample.
For example, to estimate the average annual household income in a large city we use cluster
sampling, because to use simple random sampling we need a complete list of households in
the city from which to sample. To use stratified random sampling, we would again need the
list of households. A less expensive way is to let each block within the city represent a
cluster. A sample of clusters could then be randomly selected, and every household within
these clusters could be interviewed to find the average annual household income.
iv. Systematic Sampling:
- A complete list of all elements with in the population (sampling frame) is required.
- The procedure starts in determining the first element to be included in the sample.
- Then the technique is to take the kth
item from the sampling frame.
- Let, .
int
,
, erval
sampling
n
N
k
size
sample
n
size
population
N 



- Chose any number between 1 and k . Suppose it is j ( )
1 k
j 
 .
- The
th
j unit is selected at first and then etc
k
j
k
j th
th
,....
)
2
(
,
)
( 
 until the required
sample size is reached.
L
Le
ec
ct
tu
ur
re
e n
no
ot
te
es
s o
on
n I
In
nt
tr
ro
od
du
uc
ct
ti
io
on
n t
to
o S
St
ta
at
ti
is
st
ti
ic
cs
s C
Ch
ha
ap
pt
te
er
r 7
7:
: S
Sa
am
mp
pl
li
in
ng
g &
& S
Sa
am
mp
pl
li
in
ng
g D
Di
is
st
tr
ri
ib
bu
ut
ti
io
on
ns
s
Page 3 of 5
2. Non Random Sampling or non-probability sampling
- It is a sampling technique in which the choice of individuals for a sample depends on the basis of
convenience, personal choice or interest.
Examples:
 Judgment sampling.
 Convenience sampling
 Quota Sampling.
1. Judgment Sampling
- In this case, the person taking the sample has direct or indirect control over which items are
selected for the sample.
2. Convenience Sampling
- In this method, the decision maker selects a sample from the population in a manner that is
relatively easy and convenient.
3. Quota Sampling
- In this method, the decision maker requires the sample to contain a certain number of items
with a given characteristic. Many political polls are, in part, quota sampling.
Note: .
, size
sample
n
size
population
N
let 

1.Suppose simple random sampling is used
 We have
n
N possible samples if sampling is with replacement.
 We have 







n
N
possible samples if sampling is with out replacement.
2. After this on wards, we consider that samples are drawn from a given population using
simple random sampling.
Sampling Distribution of the sample mean
- Sampling distribution of the sample mean is a theoretical probability distribution that shows the
functional relation ship between the possible values of a given sample mean based on samples of
size n and the probability associated with each value, for all possible samples of size n drawn from
that particular population.
- There are commonly three properties of interest of a given sampling distribution.
 Its Mean
 Its Variance
 Its Functional form.
Steps for the construction of Sampling Distribution of the mean
1. From a finite population of size N , randomly draw all possible samples of size n .
2. Calculate the mean for each sample.
3. Summarize the mean obtained in step 2 in terms of frequency distribution or relative frequency
distribution.
L
Le
ec
ct
tu
ur
re
e n
no
ot
te
es
s o
on
n I
In
nt
tr
ro
od
du
uc
ct
ti
io
on
n t
to
o S
St
ta
at
ti
is
st
ti
ic
cs
s C
Ch
ha
ap
pt
te
er
r 7
7:
: S
Sa
am
mp
pl
li
in
ng
g &
& S
Sa
am
mp
pl
li
in
ng
g D
Di
is
st
tr
ri
ib
bu
ut
ti
io
on
ns
s
Page 4 of 5
Example: Suppose we have a population of size 5

N , consisting of the age of five children: 6, 8,
10, 12, and 14. Take samples of size 2 with replacement and construct sampling distribution of the
sample mean.
Solution: 2
,
5 
 n
N
 We have 25
52


n
N possible samples since sampling is with replacement.
Step 1: Draw all possible samples:
6 8 10 12 14
6 (6, 6) (6, 8) (6, 10) (6, 12) (6, 14)
8 (8,6) (8,8) (8,10) (8,12) (8,14)
10 (10,6) (10,8) (10,10) (10,12) (10,14)
12 (12,6) (12,8) (12,10) (12,12) (12,14)
14 (12,6) (14,8) (12,10) (12,12) (12,14)
Step 2: Calculate the mean for each sample:
Step 3: Summarize the mean obtained in step 2 in terms of frequency distribution.
a) Find the mean of ,
X say X


 




 10
25
250
i
i
i
X
f
f
X
b) Find the variance of X , say
2
X
 ,
2
2
2
4
25
100
)
(


 






i
i
X
i
X
f
f
X
6 8 10 12 14
6 6 7 8 9 10
8 7 8 9 10 11
10 8 9 10 11 12
12 9 10 11 12 13
14 10 11 12 13 14
X Frequency
6 1
7 2
8 3
9 4
10 5
11 4
12 3
13 2
14 1
L
Le
ec
ct
tu
ur
re
e n
no
ot
te
es
s o
on
n I
In
nt
tr
ro
od
du
uc
ct
ti
io
on
n t
to
o S
St
ta
at
ti
is
st
ti
ic
cs
s C
Ch
ha
ap
pt
te
er
r 7
7:
: S
Sa
am
mp
pl
li
in
ng
g &
& S
Sa
am
mp
pl
li
in
ng
g D
Di
is
st
tr
ri
ib
bu
ut
ti
io
on
ns
s
Page 5 of 5
Remark:
1. In general if sampling is with replacement
n
X
2
2 
 
2. If sampling is with out replacement









1
2
2
N
n
N
n
X


3. In any case the sample mean is unbiased estimator of the population mean. i.e.


 

 )
(X
E
X (Show!)
- Sampling may be from a normally distributed population or from a non-normally distributed
population.
- When sampling is from a normally distributed population, the distribution of X will posses the
following property.
1. The distribution of X will be normal
2. The mean of X is equal to the population mean , i.e. 
 
X
3. The variance of X is equal to the population variance divided by the sample size,
i.e.
n
X
2
2 
 
)
1
,
0
(
~
)
,
(
~
2
N
n
X
Z
n
N
X








Central Limit Theorem
Given a population of any functional form with mean  and finite variance
2
 , the sampling
distribution of X , computed from samples of size n from the population will be approximately
normally distributed with mean  and variance
n
2

, when the sample size is large.

Chapter-7-Sampling & sampling Distributions.pdf

  • 1.
    L Le ec ct tu ur re e n no ot te es s o on nI In nt tr ro od du uc ct ti io on n t to o S St ta at ti is st ti ic cs s C Ch ha ap pt te er r 7 7: : S Sa am mp pl li in ng g & & S Sa am mp pl li in ng g D Di is st tr ri ib bu ut ti io on ns s Page 1 of 5 C CH HA AP PT TE ER R 7 7 7. Sampling and Sampling Distribution Introduction Given a variable X, if we arrange its values in ascending order and assign probability to each of the values or if we present Xi in a form of relative frequency distribution the result is called Sampling Distribution of X. Definitions: 1. Parameter: Characteristic or measure obtained from a population. 2. Statistic: Characteristic or measure obtained from a sample. 3. Sampling: The process or method of sample selection from the population. 4. Sampling unit: the ultimate unit to be sampled or elements of the population to be sampled. Examples:  If some body studies Scio-economic status of the households, households are the sampling unit.  If one studies performance of freshman students in some college, the student is the sampling unit. 5. Sampling frame: is the list of all elements in a population under study. Examples: - List of households. - List of students in the registrar office. 6. Errors in sample survey: There are two types of errors a) Sampling error: - It is the discrepancy between the population value and sample value. - May arise due to inappropriate sampling techniques applied b) Non sampling errors: are errors due to procedure bias such as: - Due to incorrect responses - Measurement - Errors at different stages in processing the data.  The Need for Sampling - Reduced cost - Greater speed - Greater accuracy - Greater scope - More detailed information can be obtained.  There are two types of sampling. 1. Random Sampling or probability sampling - It is a method of sampling in which all elements in the population have a pre-assigned non-zero probability to be included in to the sample. Examples:  Simple random sampling  Stratified random sampling  Cluster sampling  Systematic sampling
  • 2.
    L Le ec ct tu ur re e n no ot te es s o on nI In nt tr ro od du uc ct ti io on n t to o S St ta at ti is st ti ic cs s C Ch ha ap pt te er r 7 7: : S Sa am mp pl li in ng g & & S Sa am mp pl li in ng g D Di is st tr ri ib bu ut ti io on ns s Page 2 of 5 i. Simple Random Sampling: - It is a method of selecting items from a population such that every possible sample of specific size has an equal chance of being selected. In this case, sampling may be with or without replacement. Or - All elements in the population have the same pre-assigned non-zero probability to be included in to the sample. - Simple random sampling can be done either using the lottery method or table of random numbers. ii. Stratified Random Sampling: - The population will be divided in to non-overlapping but exhaustive groups called strata. - Simple random samples will be chosen from each stratum. - Elements in the same strata should be more or less homogeneous while different in different strata. - It is applied if the population is heterogeneous. - Some of the criteria for dividing a population into strata are: Sex (male, female); Age (under 18, 18 to 28, 29 to 39,); Occupation (blue-collar, professional, and other). iii. Cluster Sampling: - The population is divided in to non-overlapping groups called clusters. - A simple random sample of groups or cluster of elements is chosen and all the sampling units in the selected clusters will be surveyed. - Clusters are formed in a way that elements with in a cluster are heterogeneous, i.e. observations in each cluster should be more or less dissimilar. - Cluster sampling is useful when it is difficult or costly to generate a simple random sample. For example, to estimate the average annual household income in a large city we use cluster sampling, because to use simple random sampling we need a complete list of households in the city from which to sample. To use stratified random sampling, we would again need the list of households. A less expensive way is to let each block within the city represent a cluster. A sample of clusters could then be randomly selected, and every household within these clusters could be interviewed to find the average annual household income. iv. Systematic Sampling: - A complete list of all elements with in the population (sampling frame) is required. - The procedure starts in determining the first element to be included in the sample. - Then the technique is to take the kth item from the sampling frame. - Let, . int , , erval sampling n N k size sample n size population N     - Chose any number between 1 and k . Suppose it is j ( ) 1 k j   . - The th j unit is selected at first and then etc k j k j th th ,.... ) 2 ( , ) (   until the required sample size is reached.
  • 3.
    L Le ec ct tu ur re e n no ot te es s o on nI In nt tr ro od du uc ct ti io on n t to o S St ta at ti is st ti ic cs s C Ch ha ap pt te er r 7 7: : S Sa am mp pl li in ng g & & S Sa am mp pl li in ng g D Di is st tr ri ib bu ut ti io on ns s Page 3 of 5 2. Non Random Sampling or non-probability sampling - It is a sampling technique in which the choice of individuals for a sample depends on the basis of convenience, personal choice or interest. Examples:  Judgment sampling.  Convenience sampling  Quota Sampling. 1. Judgment Sampling - In this case, the person taking the sample has direct or indirect control over which items are selected for the sample. 2. Convenience Sampling - In this method, the decision maker selects a sample from the population in a manner that is relatively easy and convenient. 3. Quota Sampling - In this method, the decision maker requires the sample to contain a certain number of items with a given characteristic. Many political polls are, in part, quota sampling. Note: . , size sample n size population N let   1.Suppose simple random sampling is used  We have n N possible samples if sampling is with replacement.  We have         n N possible samples if sampling is with out replacement. 2. After this on wards, we consider that samples are drawn from a given population using simple random sampling. Sampling Distribution of the sample mean - Sampling distribution of the sample mean is a theoretical probability distribution that shows the functional relation ship between the possible values of a given sample mean based on samples of size n and the probability associated with each value, for all possible samples of size n drawn from that particular population. - There are commonly three properties of interest of a given sampling distribution.  Its Mean  Its Variance  Its Functional form. Steps for the construction of Sampling Distribution of the mean 1. From a finite population of size N , randomly draw all possible samples of size n . 2. Calculate the mean for each sample. 3. Summarize the mean obtained in step 2 in terms of frequency distribution or relative frequency distribution.
  • 4.
    L Le ec ct tu ur re e n no ot te es s o on nI In nt tr ro od du uc ct ti io on n t to o S St ta at ti is st ti ic cs s C Ch ha ap pt te er r 7 7: : S Sa am mp pl li in ng g & & S Sa am mp pl li in ng g D Di is st tr ri ib bu ut ti io on ns s Page 4 of 5 Example: Suppose we have a population of size 5  N , consisting of the age of five children: 6, 8, 10, 12, and 14. Take samples of size 2 with replacement and construct sampling distribution of the sample mean. Solution: 2 , 5   n N  We have 25 52   n N possible samples since sampling is with replacement. Step 1: Draw all possible samples: 6 8 10 12 14 6 (6, 6) (6, 8) (6, 10) (6, 12) (6, 14) 8 (8,6) (8,8) (8,10) (8,12) (8,14) 10 (10,6) (10,8) (10,10) (10,12) (10,14) 12 (12,6) (12,8) (12,10) (12,12) (12,14) 14 (12,6) (14,8) (12,10) (12,12) (12,14) Step 2: Calculate the mean for each sample: Step 3: Summarize the mean obtained in step 2 in terms of frequency distribution. a) Find the mean of , X say X          10 25 250 i i i X f f X b) Find the variance of X , say 2 X  , 2 2 2 4 25 100 ) (           i i X i X f f X 6 8 10 12 14 6 6 7 8 9 10 8 7 8 9 10 11 10 8 9 10 11 12 12 9 10 11 12 13 14 10 11 12 13 14 X Frequency 6 1 7 2 8 3 9 4 10 5 11 4 12 3 13 2 14 1
  • 5.
    L Le ec ct tu ur re e n no ot te es s o on nI In nt tr ro od du uc ct ti io on n t to o S St ta at ti is st ti ic cs s C Ch ha ap pt te er r 7 7: : S Sa am mp pl li in ng g & & S Sa am mp pl li in ng g D Di is st tr ri ib bu ut ti io on ns s Page 5 of 5 Remark: 1. In general if sampling is with replacement n X 2 2    2. If sampling is with out replacement          1 2 2 N n N n X   3. In any case the sample mean is unbiased estimator of the population mean. i.e.       ) (X E X (Show!) - Sampling may be from a normally distributed population or from a non-normally distributed population. - When sampling is from a normally distributed population, the distribution of X will posses the following property. 1. The distribution of X will be normal 2. The mean of X is equal to the population mean , i.e.    X 3. The variance of X is equal to the population variance divided by the sample size, i.e. n X 2 2    ) 1 , 0 ( ~ ) , ( ~ 2 N n X Z n N X         Central Limit Theorem Given a population of any functional form with mean  and finite variance 2  , the sampling distribution of X , computed from samples of size n from the population will be approximately normally distributed with mean  and variance n 2  , when the sample size is large.