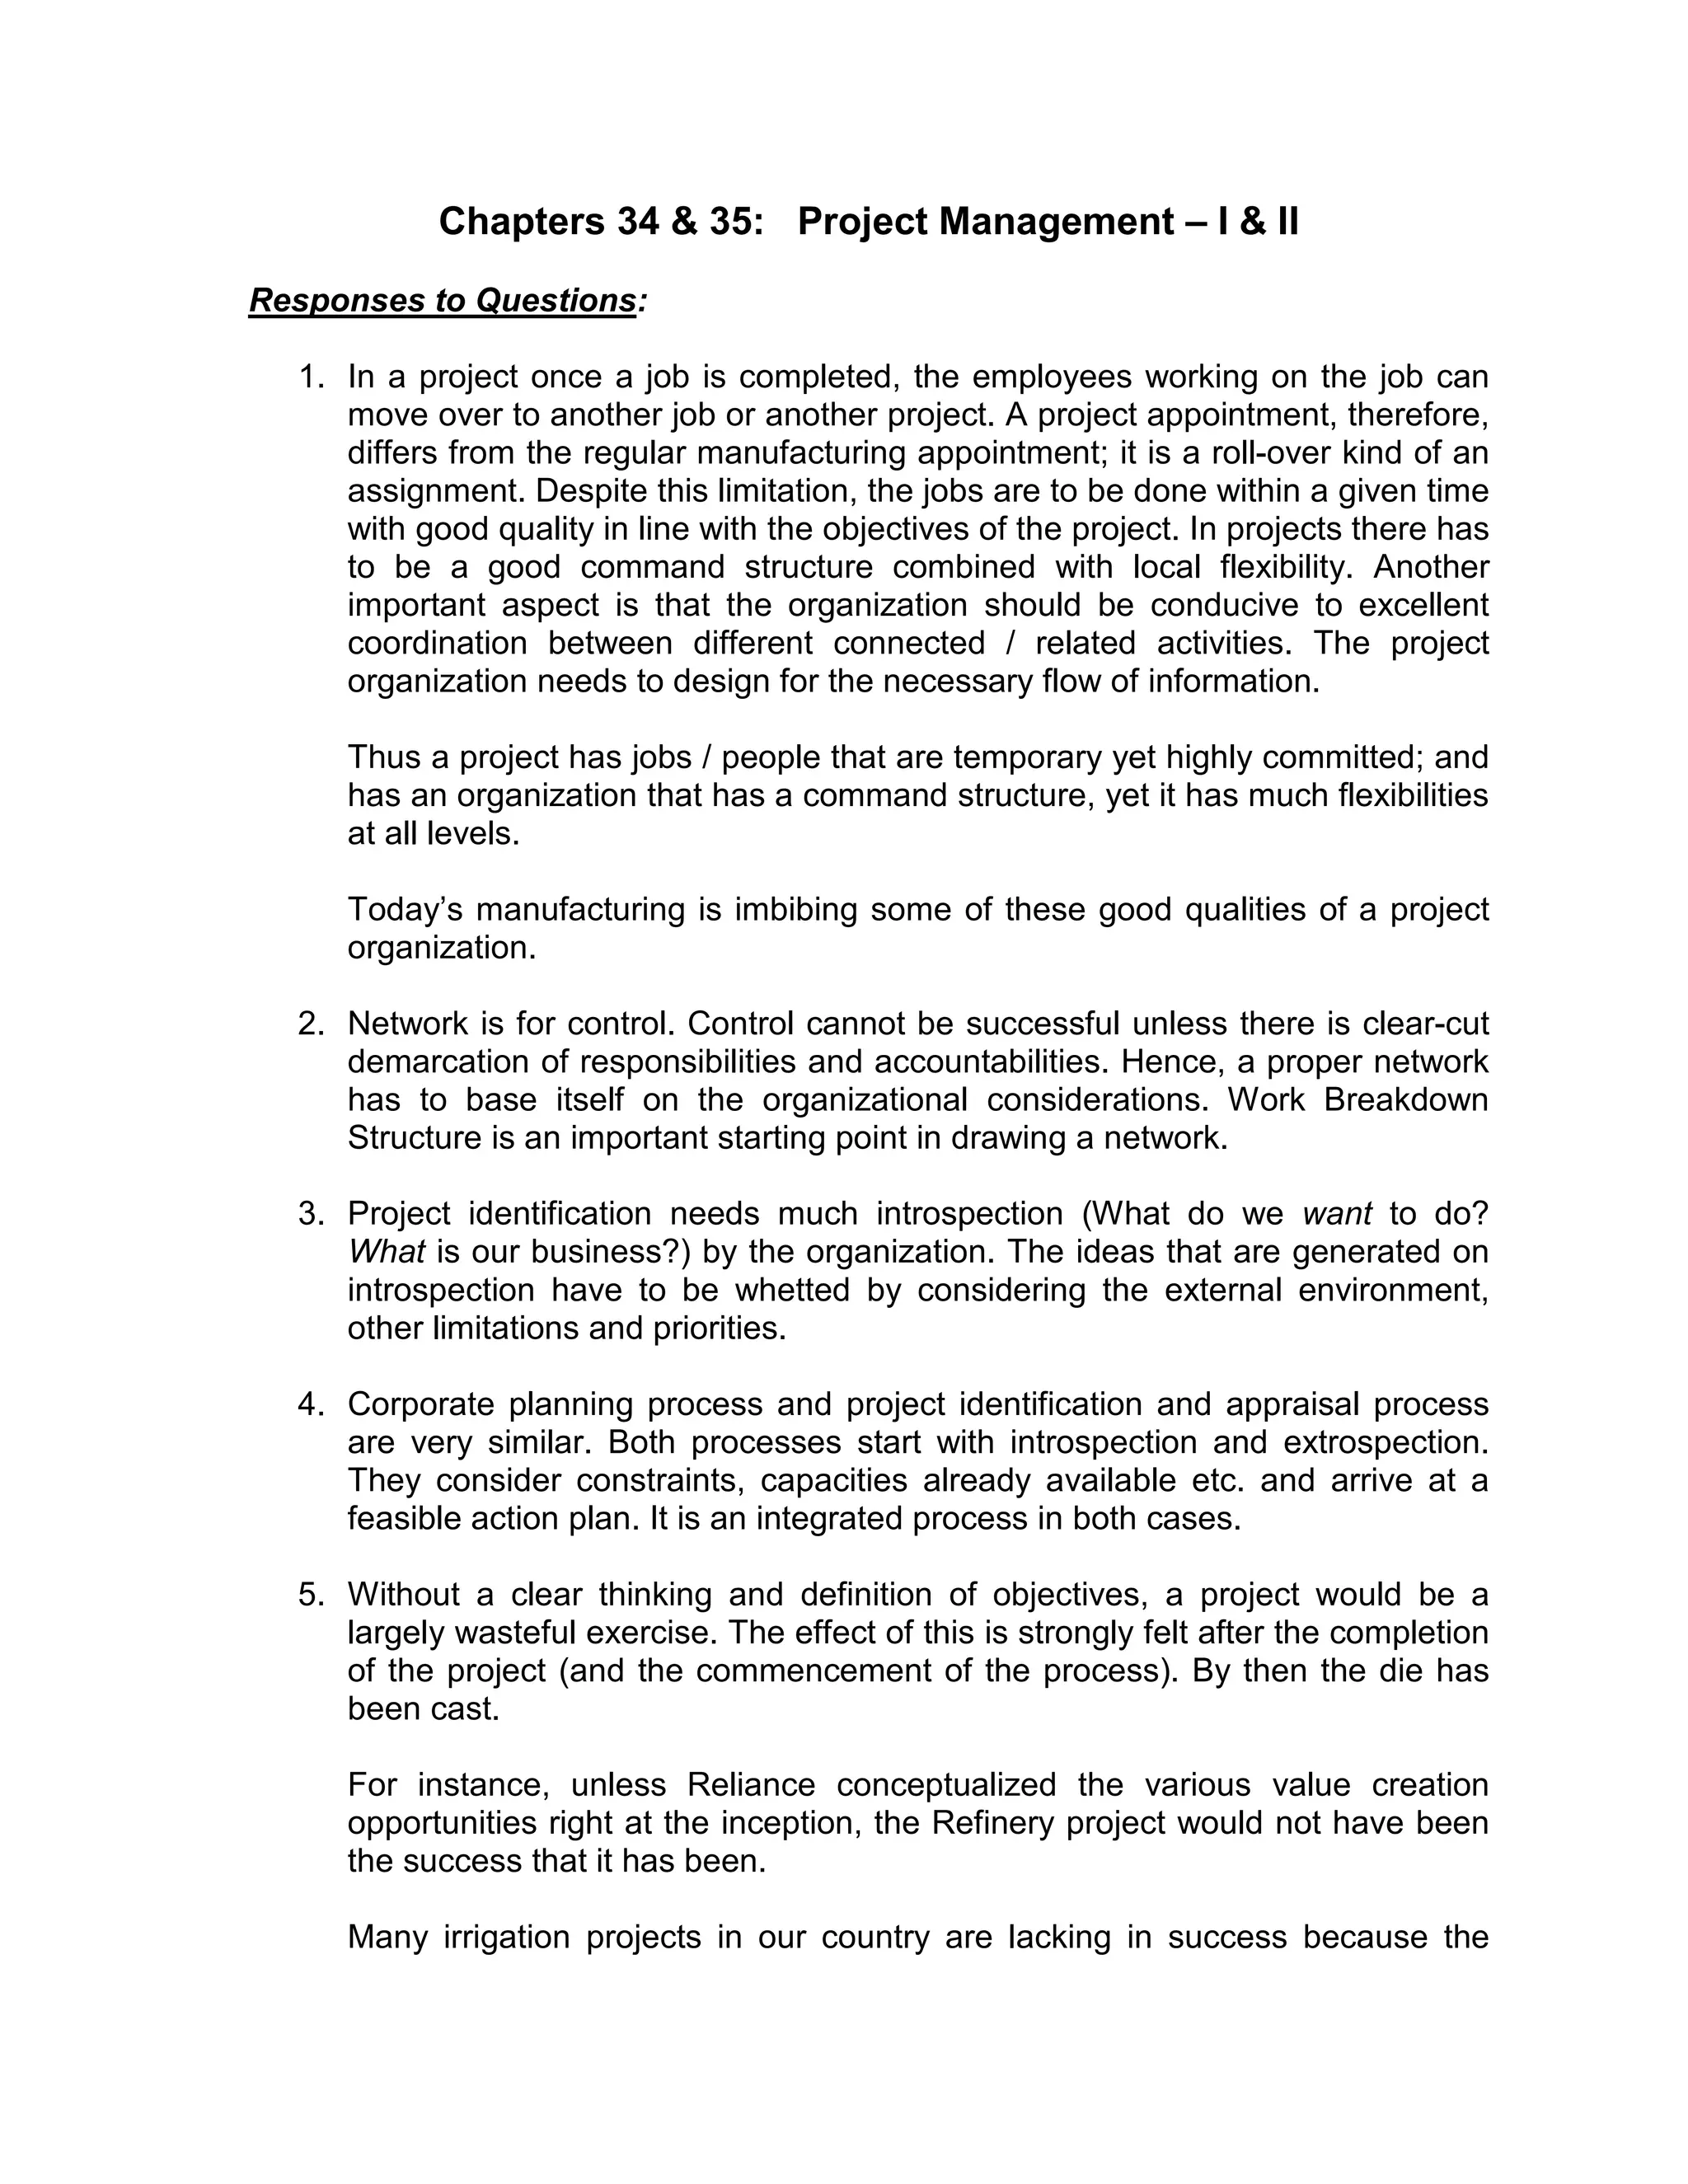
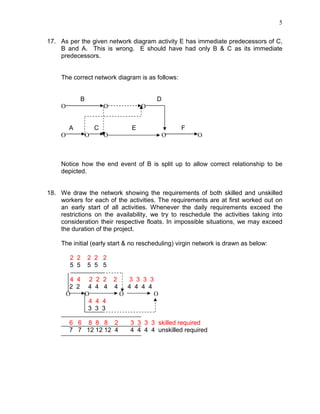
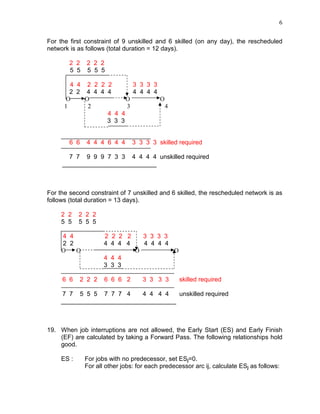
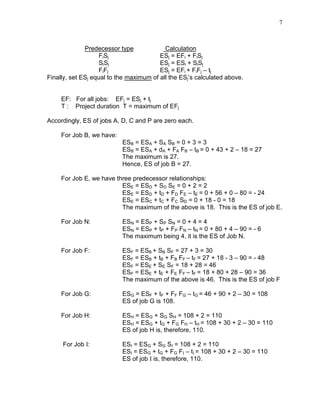
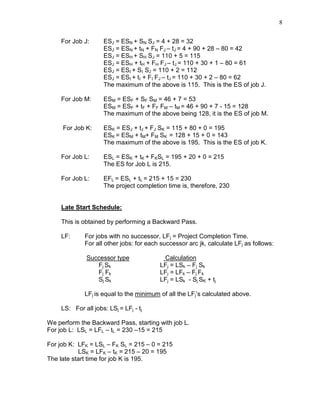
This document contains responses to questions about project management. It discusses key aspects of project organization including temporary job assignments, a command structure with flexibility, and good information flow. It also covers work breakdown structures, resource constraints, critical path analysis, float utilization, and updating project schedules as new information becomes available.
Constructing a network
1 Introduction and definitions:
-Activity and Project
-Project Management Process
-Network
2 Situations in network diagram
-Concurrent activities
-Predecessors and Successors Activities
-Dummy Activity
3 Errors to be Avoided in constructing a network
4 Rules in constructing a network
When I was preparing my PMP exam it was really hard for me to understand this CPM concept. I watched tons of videos and read blogs but nothing was working for me. But eventually, after a hard practice, I cracked the way out.
This presentation was given by Gary Palmer on Wednesday 2nd April 2014. Airbus in Bristol very kindly hosted the event which was well attended by almost 80 of the local APM membership and project management community.
An introductory-level presentation to critical chain project management (CCPM), primarily aimed at those new to the subject.
Critical chain project management (CCPM) is fast emerging as a major step change in project management, dramatically improving project speed and predictability. Although currently relatively little-known in the UK, it has become well-established and highly successful in America, India and Japan, and is predicted to become a dominant methodology within the next few years.
CCPM changes many typical project management practices and behaviours, and by these changes removes the in-built inefficiencies in ‘traditional’ project management, enabling projects to run faster and with more effective protection against uncertainty, whilst providing much improved visibility of progress and monitoring both at the single project and multi-project (programme and portfolio) levels.
This presentation introduces the main principles of CCPM and compares and contrasts them with current project management practices, with an overview of CCPM’s history and development, use of the methods in programme and portfolio situations, current adoption in industry, and implementation considerations.
MGT 3302, Introduction to Project Management 1 Cou.docxadkinspaige22
MGT 3302, Introduction to Project Management 1
Course Learning Outcomes for Unit V
Upon completion of this unit, students should be able to:
1. Describe the components of a basic project schedule.
1.1 Illustrate components of a project schedule, including a Gantt chart and network activity
diagram.
Course/Unit
Learning Outcomes
Learning Activity
1.1
Unit Lesson
Chapter 6, pp. 214–232
Unit V Course Project
Required Unit Resources
Chapter 6: Resource Utilization, pp. 214–232
Unit Lesson
In this unit, we are discussing resource planning and resource utilization, which goes hand-in-hand with
creating and managing a Gantt chart. In order to efficiently manage our resources and make full use of our
Gantt chart, we need to have finalized our estimated durations and our predecessors. In this unit’s
assignment, you will create a finalized list of activities with durations and predecessors, a network activity
diagram based on that finalized list, and a Gantt chart.
As a reminder, for our fair project, the predecessors and durations are shown below.
Activity # Description Predecessors Estimated
Duration (days)
A Determine some potential dates for the fair. None 5
B Research potential available locations for a
tent and space for 300 employees.
A 3
C Discuss potential locations and cost. B 2
D Decide on a location. C 1
E Reserve the location. D 4
F Research companies that have fun day
activities, such as dunking booths.
A 1
G Discuss potential activities and cost. F 1
H Reserve the activities. G 2
I Gather a list of all other items needed (e.g.,
tables, chairs, garbage cans).
E, N, H 7
J Research potential companies that will
provide food, including lunch and fun fair
food.
A 1
K Discuss food options and cost. J 2
L Determine a potential menu. K 1
M Determine a company to hire. L 1
N Order food. M 1
O Communicate fun day to all employees. I 1
UNIT V STUDY GUIDE
Resource Utilization
MGT 3302, Introduction to Project Management 2
UNIT x STUDY GUIDE
Title
Our simplified activity network sequence, based on those predecessors, looks like the graphic below.
But, what if we had other constraints to consider? What if there were only two people in our organization that
could perform activities B, F, and J? This would mean that we have additional constraints on our resources
that we must plan for and manage.
Resource Planning
In resource planning, there are many approaches to establishing a sequence for your activities. For example,
a technically constrained activity sequence is a sequence of activities that takes technical constraints into
consideration. For example, you cannot design a new software application until you have the requirements.
You cannot write the code until you have the technical specs from the designer. So, one activity needs to be
complete before another activity begins. This is the general basis of the curren.
PMGT 510Principles of Project ManagementGroup Assign.docxstilliegeorgiana
PMGT 510
Principles of Project Management
Group Assignment 9
Part1
Staffing management is much the same as it sounds; it is an approach to deal with the staff on a team or project. The staffing management plan will state when work force will be dropped or added to the project or when they have finished their bit if they will be moved to another level of the project, or if their business is finished. A decent instrument to demonstrate this management plan is to utilize an asset histogram. This will outwardly put the staffing management intend to utilize. An obligation task network would be a decent method to appear and clear up the jobs and duties regarding errands expected to finish the project.
When performing resource leveling, it is helpful for the project manager to consult both the Critical path schedule and resource histogram.
The two techniques for compressing a schedule are:
First schedule compression approach is Fast Tracking. In fast-tracking schedule compression system, basic way exercises are performed in parallel rather than arrangement. This is conceivable just the exercises are not in required reliance. Since, if two exercises are relying upon one another essentially, you can't do these two exercises in parallel. For example, you can't begin testing of a screen before finishing advancement. If basic way exercises are relying upon one another due to asset reliance or if there is an optional reliance, you can fast track those exercises to finish remaining exercises faster.
Second schedule compression system is crashing. In crashing schedule compression strategy, there is an exchange off among expense and schedule. On the off chance that the extension is the equivalent and project is behind schedule, another alternative for compacting the schedule is putting additional assets on residual exercises of the project. In such a case that it is conceivable to appoint more than one asset on an action, movement span will diminish individually. This will total the project faster. In any case, since these additional assets were not in the underlying arrangement, there will be an extra expense if crashing is utilized for schedule compression.
When crashing a project schedule, describe the two criteria that are considered when considering which activities will be sped up.
First criteria: Since the critical path indicates the completion time, so choose the right activities for the critical path and is very important.
Second criteria: Some activities can speed up and some cannot, so knowing which activates are worth speed up this can minimize the daily cost and the overall spending.
Part 2: Project network/schedule -scheduling and compressing a schedule (30 points)
You’ve been asked to manage a project that includes conducting a two-week (10 working days) computer training class. Using the information in Table below, complete the following:
Activity
Immediate Predecessor
Normal Time (days)
Normal Cost
Crashed Time (days)
Crash ...
PrintNetwork Diagrams and Resource UtilizationIntroduction B.docxChantellPantoja184
Print
Network Diagrams and Resource Utilization
Introduction | Building a Network Diagram | Building an AIB Manually | AIB Simulation | Resource Constrained Planning | Resource Leveling | Adding or Modifying Resources | Summary
Introduction
Back to Top
Last week, we learned more about how to begin planning a project. We established the project charter, scope statement, work breakdown structure, and created the activity list. This week, we will talk about one of the most important aspects of project management—building a project schedule. We'll use a tool called a network diagram. There are several ways to build a network diagram. In this course, we will use the Activity in Box (AIB) method.
Building a Network Diagram
Back to Top
Now that we know what needs to be done, we need to sequence all of the activities and establish a network diagram. With the concept of a network diagram, you will be able to determine: (1) a project's scheduled completion time, (2) the slack or float of project activities, and (3) the critical path of your project.
Depending on the size of the project, the network may be built in pieces or as a large group. Either way, the step-by-step process to build a project network is used.
Build a Project Network (or a Partial Network)
1. Brainstorm activities that are required to complete the work packages, recording those activities on Post-it notes (without regard to sequencing).
2. Sequence those activities. Determine:
· The order of activities
· Which activities can occur at the same time
· Which activities need dependencies
1. Mandatory: requires the completion of another task.
2. Discretionary: a best practice or convenience. However, the subsequent task can begin if the discretionary dependency is not completed.
3. External: from another project or process, such as permits.
4. Internal: dependencies within the control of the project team.
3. Put the notes on a wall using the above information.
4. Build a network using the notes.
Next, the activities are assigned to the people who will be doing the work. They build duration estimates for the activities. The most accurate estimates are built using actuals from previous, similar projects. Then, the activities can be loaded into an automated scheduling tool like Microsoft Project. At that point, you will be able to determine the project's scheduled completion time, the slack or float of project activities, and the critical path of your project.
Building an AIB Manually
Back to Top
The good thing about using a tool like Microsoft Project is that it makes it easy to build a network diagram. The bad thing about the tool is that it makes it so easy; project managers don't always understand what they are doing, and cannot see when they have made a mistake. They just plug in the activities and move on.
It's like adding—you should first do it manually, and then use a calculator. Every project manager should know how to build an AIB manually so that he or she really understands the.
Critical Path Explained With 7 Q&As and a Free Excel TemplateSHAZEBALIKHAN1
The critical path method is the most used project management technique. Learn the CPM with 7 FAQs ranging from definition to method, process, tests. The attached excel sheet (hyperlinked in the article) explains the implementation of CPM in a project schedule.
Free float and total float - PMP/CAPM from PMIMudassir Iqbal
https://www.mudassiriqbal.net/project-management-terms-and-concepts
There are many concepts and definitions which require special attention by all PMP Aspirants as the terminologies are largely used interchangeably in the real world.
Taming an Unruly Schedule with the 14 Point Schedule AssessmentAcumen
This paper discusses why the emerging 14 Point Schedule Assessment, developed by the Defense Contract Management Agency (DCMA), is fast becoming an established standard within the scheduling community across multiple industries.
The Team Member and Guest Experience - Lead and Take Care of your restaurant team. They are the people closest to and delivering Hospitality to your paying Guests!
Make the call, and we can assist you.
408-784-7371
Foodservice Consulting + Design
The case study discusses the potential of drone delivery and the challenges that need to be addressed before it becomes widespread.
Key takeaways:
Drone delivery is in its early stages: Amazon's trial in the UK demonstrates the potential for faster deliveries, but it's still limited by regulations and technology.
Regulations are a major hurdle: Safety concerns around drone collisions with airplanes and people have led to restrictions on flight height and location.
Other challenges exist: Who will use drone delivery the most? Is it cost-effective compared to traditional delivery trucks?
Discussion questions:
Managerial challenges: Integrating drones requires planning for new infrastructure, training staff, and navigating regulations. There are also marketing and recruitment considerations specific to this technology.
External forces vary by country: Regulations, consumer acceptance, and infrastructure all differ between countries.
Demographics matter: Younger generations might be more receptive to drone delivery, while older populations might have concerns.
Stakeholders for Amazon: Customers, regulators, aviation authorities, and competitors are all stakeholders. Regulators likely hold the greatest influence as they determine the feasibility of drone delivery.
Artificial intelligence (AI) offers new opportunities to radically reinvent the way we do business. This study explores how CEOs and top decision makers around the world are responding to the transformative potential of AI.
Senior Project and Engineering Leader Jim Smith.pdfJim Smith
I am a Project and Engineering Leader with extensive experience as a Business Operations Leader, Technical Project Manager, Engineering Manager and Operations Experience for Domestic and International companies such as Electrolux, Carrier, and Deutz. I have developed new products using Stage Gate development/MS Project/JIRA, for the pro-duction of Medical Equipment, Large Commercial Refrigeration Systems, Appliances, HVAC, and Diesel engines.
My experience includes:
Managed customized engineered refrigeration system projects with high voltage power panels from quote to ship, coordinating actions between electrical engineering, mechanical design and application engineering, purchasing, production, test, quality assurance and field installation. Managed projects $25k to $1M per project; 4-8 per month. (Hussmann refrigeration)
Successfully developed the $15-20M yearly corporate capital strategy for manufacturing, with the Executive Team and key stakeholders. Created project scope and specifications, business case, ROI, managed project plans with key personnel for nine consumer product manufacturing and distribution sites; to support the company’s strategic sales plan.
Over 15 years of experience managing and developing cost improvement projects with key Stakeholders, site Manufacturing Engineers, Mechanical Engineers, Maintenance, and facility support personnel to optimize pro-duction operations, safety, EHS, and new product development. (BioLab, Deutz, Caire)
Experience working as a Technical Manager developing new products with chemical engineers and packaging engineers to enhance and reduce the cost of retail products. I have led the activities of multiple engineering groups with diverse backgrounds.
Great experience managing the product development of products which utilize complex electrical controls, high voltage power panels, product testing, and commissioning.
Created project scope, business case, ROI for multiple capital projects to support electrotechnical assembly and CPG goods. Identified project cost, risk, success criteria, and performed equipment qualifications. (Carrier, Electrolux, Biolab, Price, Hussmann)
Created detailed projects plans using MS Project, Gant charts in excel, and updated new product development in Jira for stakeholders and project team members including critical path.
Great knowledge of ISO9001, NFPA, OSHA regulations.
User level knowledge of MRP/SAP, MS Project, Powerpoint, Visio, Mastercontrol, JIRA, Power BI and Tableau.
I appreciate your consideration, and look forward to discussing this role with you, and how I can lead your company’s growth and profitability. I can be contacted via LinkedIn via phone or E Mail.
Jim Smith
678-993-7195
jimsmith30024@gmail.com
Oprah Winfrey: A Leader in Media, Philanthropy, and Empowerment | CIO Women M...CIOWomenMagazine
This person is none other than Oprah Winfrey, a highly influential figure whose impact extends beyond television. This article will delve into the remarkable life and lasting legacy of Oprah. Her story serves as a reminder of the importance of perseverance, compassion, and firm determination.
Production & Operation Management Chapter 34, 35[1]
1. Chapters 34 & 35: Project Management – I & II
Responses to Questions:
1. In a project once a job is completed, the employees working on the job can
move over to another job or another project. A project appointment, therefore,
differs from the regular manufacturing appointment; it is a roll-over kind of an
assignment. Despite this limitation, the jobs are to be done within a given time
with good quality in line with the objectives of the project. In projects there has
to be a good command structure combined with local flexibility. Another
important aspect is that the organization should be conducive to excellent
coordination between different connected / related activities. The project
organization needs to design for the necessary flow of information.
Thus a project has jobs / people that are temporary yet highly committed; and
has an organization that has a command structure, yet it has much flexibilities
at all levels.
Today’s manufacturing is imbibing some of these good qualities of a project
organization.
2. Network is for control. Control cannot be successful unless there is clear-cut
demarcation of responsibilities and accountabilities. Hence, a proper network
has to base itself on the organizational considerations. Work Breakdown
Structure is an important starting point in drawing a network.
3. Project identification needs much introspection (What do we want to do?
What is our business?) by the organization. The ideas that are generated on
introspection have to be whetted by considering the external environment,
other limitations and priorities.
4. Corporate planning process and project identification and appraisal process
are very similar. Both processes start with introspection and extrospection.
They consider constraints, capacities already available etc. and arrive at a
feasible action plan. It is an integrated process in both cases.
5. Without a clear thinking and definition of objectives, a project would be a
largely wasteful exercise. The effect of this is strongly felt after the completion
of the project (and the commencement of the process). By then the die has
been cast.
For instance, unless Reliance conceptualized the various value creation
opportunities right at the inception, the Refinery project would not have been
the success that it has been.
Many irrigation projects in our country are lacking in success because the
2. 2
objectives have not been considered and incorporated into the project right at
the beginning. It then becomes just a civil engineering exercise done to
precision and no more.
6. All projects need a social cost benefit analysis (SCBA) done during their initial
formulation stage. The need is even more acute for projects of the
government/public system. Ultimately, all projects have to be for the good of
the society. This needs to be assessed right in the formulation stage.
Impact analysis is about (i) environmental / ecological impact, (ii) economic
impact and (iii) socio-cultural impact. ‘Impact’ is the long term effect. Along
with or as a part of SCBA, this impact analysis needs to be carried out.
7. Project Evaluation is the ‘hindsight’, a retrospective appraisal of: (i) What was
intended versus what has been achieved? (ii) What went right and what went
wrong? (iii) What lessons can be learnt for future projects / programmes?
Whereas, Project Appraisal is about ‘selection’ of projects through technical
and financial evaluation. Thus, Project Appraisal is at the beginning of a
project management process while Project Evaluation is after the project is
over.
8. An ‘activity’ is the smallest subdivision of the work of the project that makes
‘control’ sense.
Without management control, a breakdown of the packets of work would be
rather meaningless. The jobs would be rather meaningless. The jobs would
be unimplementable and uncontrollable. A network could turn out to be
farcical.
9. Without proper estimation of time for the activities, a realistic time schedule
cannot be drawn. The analysis of the slacks and the time scheduling of
resources will be exercises in futility.
10. The 3 time estimates are used in PERT, whereas CPM uses only 1 single
time estimate. The merit of PERT (and 3 time estimates) is that it comes up
with the ‘probabilities’ of completion of activities/milestones/project by a given
date. PERT (and 3 time estimates) provides this additional dimension. The
probabilities would also tell us as to which activities are more liable to become
’critical’. Some people see a merit in “3 estimates are better than just 1”; this
is, of course, a simplistic view.
3. 3
The de-merits are:
(i) In practice, it is difficult to get 3 time estimates - that too optimistic,
pessimistic and modal.
(ii) Probabilities and probabilistic critical paths make the issue
complicated and, hence, less practicable.
11. More than the ‘path’, we are concerned about critical activities which are the
bottleneck jobs. These cannot be delayed without delaying the entire project.
So, the activities on the critical path need to be watched carefully and
controlled.
Yes, there can be more than 1 critical path.
12.The ‘Total Float’, if used completely, would make the succeeding activities
critical. For this reason, it is not desirable to utilize this float completely,
although the information that so much float is there is helpful. Whereas, ‘Free
Float’ can be utilized completely without disturbing the succeeding activities.
Therefore, in case of slippages in time, Free Float is first made use of before
resorting to Total Float.
One may use the floats judiciously. The person responsible for only one
activity, such as a supervisor can be given only the Independent Float
information or at the most the Free Float information. The information
regarding Total Float is liable not to be understood properly and may
generate unnecessary complacency. At other levels of management also only
the Free Float may be used first, and the Total float may be used only
exceptionally and with the permission of the Project Manager.
13.The final schedule can be obtained only after the Resource Analysis is
performed. The initial Time Analysis is done with the assumption of the
availability of the resources without any constraints. The practical schedule
can only be obtained after the limits on resources are also taken into account
through the Resource Analysis.
14.CPM considers only the Finish to Start relationship between two activities.
This can be a significant handicap while considering civil works.
Secondly, a CPM analysis is only as good as its estimates of time and
resource requirements. Estimates, particularly the ‘time estimates’ are at the
hear of any CPM analysis.
15.CPM charts need to be updated frequently when the project is in force,
PERT/CPM charts can never be totally stable. The students’ visit to the
project cannot wait until the charts are stable, because they never will be.
4. 4
16.The CPM diagram is drawn and time analysis performed as given in the
network below.
9 A 11 D 5 H 14 J
O O O O
20 B 4 F 2 G
O O O
10 C 10 E 18 I
O O
24 K 6 L
O
The floats are as in the table below:
Activity TF FF IF
A 4 0 0
B 0 0 0
C 5 0 0
D 4 4 0
E 5 4 -1
F 0 0 0
G 3 0 0
H 0 0 0
I 1 1 0
J 0 0 0
K 1 0 0
L 13 13 12
The total float is zero for activities B, F, H and J. These are the critical activities.
O O 9 13
24 25
24 2510 15
20 20
29 29 43 4324 24
24 24 26 29
5. 5
17. As per the given network diagram activity E has immediate predecessors of C,
B and A. This is wrong. E should have had only B & C as its immediate
predecessors.
The correct network diagram is as follows:
B D
O O O
A C E F
O O O O O
Notice how the end event of B is split up to allow correct relationship to be
depicted.
18. We draw the network showing the requirements of both skilled and unskilled
workers for each of the activities. The requirements are at first worked out on
an early start of all activities. Whenever the daily requirements exceed the
restrictions on the availability, we try to reschedule the activities taking into
consideration their respective floats. In impossible situations, we may exceed
the duration of the project.
The initial (early start & no rescheduling) virgin network is drawn as below:
2 2 2 2 2
5 5 5 5 5
4 4 2 2 2 2 3 3 3 3
2 2 4 4 4 4 4 4 4 4
O O O O
4 4 4
3 3 3
6 6 8 8 8 2 3 3 3 3 skilled required
7 7 12 12 12 4 4 4 4 4 unskilled required
6. 6
For the first constraint of 9 unskilled and 6 skilled (on any day), the rescheduled
network is as follows (total duration = 12 days).
2 2 2 2 2
5 5 5 5 5
4 4 2 2 2 2 3 3 3 3
2 2 4 4 4 4 4 4 4 4
O O O O
1 2 3 4
4 4 4
3 3 3
6 6 4 4 4 6 4 4 3 3 3 3 skilled required
7 7 9 9 9 7 3 3 4 4 4 4 unskilled required
___________________________
For the second constraint of 7 unskilled and 6 skilled, the rescheduled network is as
follows (total duration = 13 days).
2 2 2 2 2
5 5 5 5 5
4 4 2 2 2 2 3 3 3 3
2 2 4 4 4 4 4 4 4 4
O O O O
4 4 4
3 3 3
6 6 2 2 2 6 6 6 2 3 3 3 3 skilled required
7 7 5 5 5 7 7 7 4 4 4 4 4 unskilled required
_________________________________
19. When job interruptions are not allowed, the Early Start (ES) and Early Finish
(EF) are calculated by taking a Forward Pass. The following relationships hold
good.
ES : For jobs with no predecessor, set ESj=0.
For all other jobs: for each predecessor arc ij, calculate ESj as follows:
7. 7
Predecessor type Calculation
FiSj ESj = EFi + FiSj
SiSj ESj = ESi + SiSj
FiFj ESj = EFi + FiFj – tj
Finally, set ESj equal to the maximum of all the ESj’s calculated above.
EF: For all jobs: EFj = ESj + tj
T : Project duration T = maximum of EFj
Accordingly, ES of jobs A, D, C and P are zero each.
For Job B, we have:
ESB = ESA + SA SB = 0 + 3 = 3
ESB = ESA + dA + FA FB – tB = 0 + 43 + 2 – 18 = 27
The maximum is 27.
Hence, ES of job B = 27.
For Job E, we have three predecessor relationships:
ESE = ESD + SD SE = 0 + 2 = 2
ESE = ESD + tD + FD FE – tE = 0 + 56 + 0 – 80 = - 24
ESE = ESC + tC + FC SD = 0 + 18 - 0 = 18
The maximum of the above is 18. This is the ES of job E.
For Job N: ESN = ESP + SP SN = 0 + 4 = 4
ESN = ESP + tP + FP FN – tN = 0 + 80 + 4 – 90 = - 6
The maximum being 4, it is the ES of Job N.
For Job F: ESF = ESB + SB SF = 27 + 3 = 30
ESF = ESB + tB + FB FF – tF = 27 + 18 - 3 – 90 = - 48
ESF = ESE + SE SF = 18 + 28 = 46
ESF = ESE + tE + FE FF – tF = 18 + 80 + 28 – 90 = 36
The maximum of the above is 46. This is the ES of job F
For Job G: ESG = ESF + tF + FF FG – tG = 46 + 90 + 2 – 30 = 108
ES of job G is 108.
For Job H: ESH = ESG + SG SH = 108 + 2 = 110
ESH = ESG + tG + FG FH – tH = 108 + 30 + 2 – 30 = 110
ES of job H is, therefore, 110.
For Job I: ESI = ESG + SG SI = 108 + 2 = 110
ESI = ESG + tG + FG FI – tI = 108 + 30 + 2 – 30 = 110
ES of job I is, therefore, 110.
8. 8
For Job J: ESJ = ESN + SN SJ = 4 + 28 = 32
ESJ = ESN + tN + FN FJ – tJ = 4 + 90 + 28 – 80 = 42
ESJ = ESH + SH SJ = 110 + 5 = 115
ESJ = ESH + tH + FH FJ – tJ = 110 + 30 + 1 – 80 = 61
ESJ = ESI + SI SJ = 110 + 2 = 112
ESJ = ESI + tI + FI FJ – tJ = 110 + 30 + 2 – 80 = 62
The maximum of the above is 115. This is the ES of job J.
For Job M: ESM = ESF + SF SM = 46 + 7 = 53
ESM = ESF + tF + FF FM – tM = 46 + 90 + 7 - 15 = 128
The maximum of the above being 128, it is the ES of job M.
For Job K: ESK = ESJ + tJ + FJ SK = 115 + 80 + 0 = 195
ESK = ESM + tM+ FM SK = 128 + 15 + 0 = 143
The maximum of the above is 195. This is the ES of job K.
For Job L: ESL = ESK + tK + FKSL = 195 + 20 + 0 = 215
The ES for Job L is 215.
For Job L: EFL = ESL + tL = 215 + 15 = 230
The project completion time is, therefore, 230
Late Start Schedule:
This is obtained by performing a Backward Pass.
LF: For jobs with no successor, LFj = Project Completion Time.
For all other jobs: for each successor arc jk, calculate LFj as follows:
Successor type Calculation
Fj Sk LFj = LSk – Fj Sk
Fj Fk LFj = LFk – Fj Fk
Sj Sk LFj = LSk - Sj SK + tj
LFj is equal to the minimum of all the LFj’s calculated above.
LS: For all jobs: LSj = LFj - tj
We perform the Backward Pass, starting with job L.
For job L: LSL = LFL – tL = 230 –15 = 215
For job K: LFK = LSL – FK SL = 215 – 0 = 215
LSK = LFK – tK = 215 – 20 = 195
The late start time for job K is 195.
9. 9
For job M: LFM = LSK – FM SK = 195 – 0 = 195
LSM = LFM – tM = 195 – 15 = 180
The late start time for job M is 180.
For job J: LFJ = LSK – FJ FK = 195 – 0 = 195
LSJ = LFJ – tJ = 195 – 80 = 115
The late start time for job J is 115.
For job I: LFI = LSJ – SI SJ + tI = 115 – 2 + 30 = 143
LFI = LFJ – FI FJ = 195 – 2 = 193
The minimum of the above is 143, which is the LF for job I.
LSI = LFI – tI = 143 – 30 = 113.
For job H: LFH = LSJ – SH SJ + tH = 115 – 5 + 30 = 140
LFH= LFJ – FH FJ = 195 – 1 = 194
The minimum of the above is 140, which is the LF for job H.
LSH = LFH – tH = 140 – 30 = 110.
For job N: LFN = LSJ – SN SJ + tN = 115 – 28 + 90 = 177
LFN = LFJ – FN FJ = 195 – 28 = 167
The minimum of the above is 167, which is the LF for job N.
LSN = LFN – tN = 167 – 90 = 77.
For job G: LFG = LSI – SG SI + tG = 113 – 2 + 30 = 141
LFG = LFI – FG FI = 143 - 2 = 141
LFG = LSH – SG SH + tG = 140 – 2 + 30 = 168
LFG = LFH – FG FH = 140 - 2 = 138
The minimum of the above is 138, which is the LF for job G.
LSG = LFG – tG = 138 – 30 = 108.
For job F: LFF = LSM – SF SM + tF = 180 – 7 + 90 = 263
LFF = LFM – FF FM = 195 – 7 = 188
LFF = LFG – FF FG = 138 – 2 = 136
The minimum of the above is 136, which is the LF for job F.
LSF = LFF – tF = 136 – 90 = 46.
For job E: LFE = LSF – SE SF + tE = 46 – 28 + 80 = 98
LFE = LFF – FE FF = 136 – 28 = 108
Hence, LF for job E is 98.
LSE = LFE – tE = 98 – 80 = 18
For job B: LFB = LSF – SB SF + tB = 46 – 3 + 18 = 61
LFB = LFF – FB FF = 136 – 3 = 133
Hence, LFB = 61 and LSB = LFB – tB = 61 – 18 = 43
For job A: LFA = LSB – SA SB + tA = 43 – 3 + 43 = 83
10. 10
LFA = LFB – FA FB = 61 – 2 = 59
Hence, LFA = 59 and LSA = 59 – 43 = 16
For job D: LFD = LSE – SD SE + tD = 18 – 2 + 56 = 72
LFD = LFE – FD FE = 98 – 0 = 98
The minimum of the above is 72, which is the LF for job D.
LSD = LFD – tD = 72 – 56 = 16.
For job C: LFC = LSE – FC SE = 18 – 0 = 18
LSC = LFC – tC = 18 – 18 = 0
For job P: LFP = LSN – SP SN + tP = 77 – 4 + 80 =153
LFP = LFN – FP FN = 167 – 4 = 163
The minimum of the above is 153, which is the LF for job P.
LSP = LFP – tP = 153 – 80 = 73.
A table of Early Start (ES) and Late Start (LS) for the different jobs is furnished
below. The total slack (LSj – ESj) is also noted.
JOB ES LS TOTAL SLACK
(LS – ES)
A 0 16 16
B 27 43 16
C 0 0 0
D 0 16 16
P 0 73 73
E 18 18 0
N 4 77 73
F 46 46 0
G 108 108 0
H 110 110 0
I 110 113 3
J 115 115 0
M 128 180 52
K 195 195 0
L 215 215 0
11. 11
CHAPTER 34 & 35: Project Management – I & II
Objective Questions
1. The problem with Social Cost Benefit Analysis is that :
a. some benefits and costs are not measurable in monetary terms.
b. it is difficult to allocate the expected benefits amongst different
projects.
c. the time preference rate of interest is an assumption.
√d. all of the above.
2. Social Cost Benefit Analysis is useful for :
a. Government or public sector projects.
b. Private sector projects.
√c. all of the above.
d. none of the above.
3. In CPM, a ‘critical activity’ is defined as one whose :
√a. total float is zero.
b. free float is zero.
c. duration is the longest.
d. none of the above.
4. Activity sequencing depends upon :
a. technological constraints
b. normal availability of resources
√c. all of the above
d. none of the above
5. Three time estimates are used by :
√a. PERT
b. CPM
c. Precedence Network
d. None of the above.
6. CPM uses :
√a. 1 time estimate
b. 2 time estimates
c. 3 times estimates
d. none of the above
7. The main difference between PERT and CPM is :
a. PERT uses Activity on Node diagram, whereas CPM uses Activity on
Arrow diagram.
12. 12
b. PERT is event-oriented whereas CPM is activity-oriented.
c. PERT lays emphasis on cost, whereas CPM lays emphasis on time.
√d. PERT is probabilistic, while CPM is deterministic.
8. PERT / CPM network can be used for :
a. Project appraisal
b. Project implementation
c. Project monitoring and control
√d. all of the above
9. An activity can become critical by consuming its :
√a. Total float fully.
b. Free float partially.
c. Any or all of the above.
d. None of the above.
10. Free float is always :
a. equal to or more than Independent Float.
b. equal to or less than Total Float.
√c. a & b
d. none of the above.
11.The 3 time estimates in network analysis assume that :
√a. The differences in time are attributable to difficulties inherent in
performing the tasks.
b. The differences in time arise due to the limits in resource availability.
c. a & b
d. none of the above.
12. For projects in the ‘service’ sector :
a. PERT can be used.
b. CPM can be used.
√c. all of the above.
d. none of the above.
Check the following network. Activities A & B each have a time duration of 7
and C & D each have 9.
B O
7
A D
O O O
7 9
C
9
13. 13
13. The dummy activity in the above diagram has a total float of :
a. 0 (Zero)
√b. 2
c. 4
d. none of the above
14. The dummy activity has a free float of :
a. 0 (Zero)
√b. 2
c. 4
d. none of the above
15. The dummy activity in the above diagram is required for :
√a. showing correct sequencing relationship.
b. nomenclature purpose.
c. a & b
d. none of the above.
16. ‘Index of criticality’ is encountered in :
a. CPM
√b. PERT
c. Precedence Network
d. all of the above
17. Early Start Schedule and Late Start Schedule can differ in their :
a. available floats
b. required resources
√ c. a & b
d. none of the above
18. Work Breakdown Structure is used in arriving at :
a. the daily resource requirements.
√b. the list of activities.
c. a reschedule of the project.
d. none of the above.
19. Ford and Fulkerson’s Method is used in :
a. resource leveling
b. resource smoothing
c. computing criticality index
√d. numbering the events
14. 14
20. Under PERT, the activity duration is assumed to follow a :
a. Poisson distribution
b. Normal distribution
√ c. Beta distribution
d. Negative exponential distribution
21. When job interruptions are allowed :
a. the different segments of an activity will have different slacks.
b. the critical path may consist of activity segments.
√ c. a & b
d. none of the above.