Download to read offline
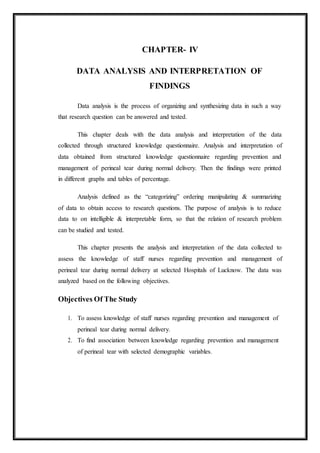


This chapter analyzed data collected from 250 staff nurses through a structured questionnaire on prevention and management of perineal tears during delivery. It found that 38% of nurses had good knowledge, 34% had average knowledge, and 28% had poor knowledge. Knowledge was higher regarding management than prevention. Statistical analysis found significant associations between knowledge levels and educational qualification, work experience, experience in the labor room, and previous knowledge. However, there were no significant associations with age or gender.