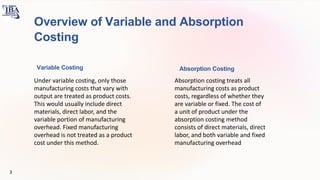
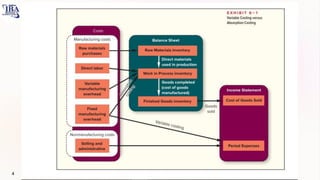
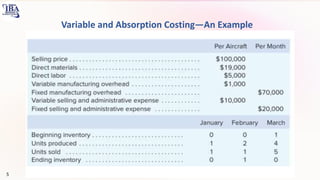
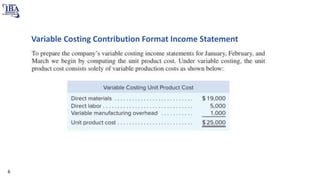
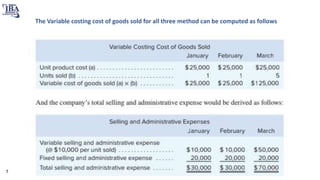
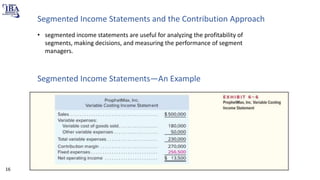
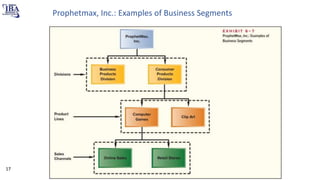
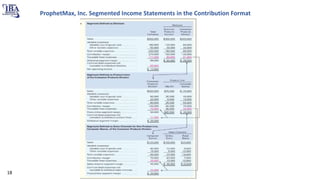
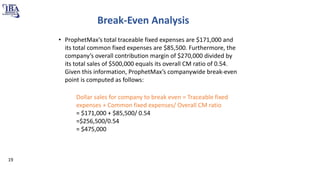
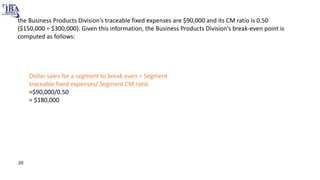
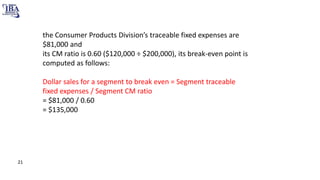
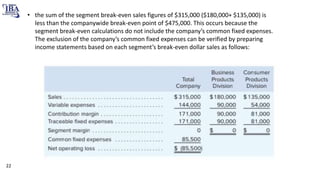
This PowerPoint presentation on variable costing and segment reporting provides a comprehensive overview of these important concepts in managerial accounting. It covers the principles of variable costing, including its advantages and disadvantages, and delves into how variable costing differs from absorption costing. Additionally, the presentation explains the importance of segment reporting in evaluating the financial performance of different business segments within an organization. It includes examples, case studies, and visual aids to enhance understanding and engagement.
Welcome to Chapter 6 of our comprehensive accounting series! In this presentation, we dive into the fascinating world of variable and absorption costing, exploring the principles and techniques behind cost allocation in financial reporting.Through this presentation, we aim to equip students and professionals alike with a solid understanding of variable and absorption costing, enabling them to make informed financial decisions.By examining real-world examples and case studies, we provide practical insights into the application of variable and absorption costing, ensuring students can effectively apply these concepts in their future careers.Whether you're a student seeking clarity on cost allocation methods or a professional looking to enhance your financial acumen, this presentation will serve as a valuable resource. Access the slides now and deepen your understanding of variable and absorption costing!Remember, knowledge is power, and understanding these fundamental accounting principles will contribute to your success in the complex world of finance. Happy learning!
the document is on Cost volume profit analysis.
(Cost-volume-profit (CVP) analysis is used to determine how changes in costs and volume affect a company's operating income and net income.)
To understand the basic concepts of marginal cost and marginal costing.
To understand the difference between the Absorption costing and Marginal Costing.
To learn the practical applications of Marginal costing.
To understand Breakeven charts & Limitation
Dear students get fully solved assignments
Send your semester & Specialization name to our mail id :
“ help.mbaassignments@gmail.com ”
or
Call us at : 08263069601
Company 1Company #1Income StatementBalance SheetAll numbers in thoLynellBull52
Company 1Company #1Income StatementBalance SheetAll numbers in thousandsAll numbers in thousandsRevenue20182017Period Ending20182017Total Revenue14,134,73212,866,757Current AssetsCost of Revenue9,510,2388,668,505Cash And Cash Equivalents1,290,2941,111,599Gross Profit4,624,4944,198,252Short Term Investments512-Operating ExpensesNet Receivables87,86875,154Selling General and Administrative2,576,0982,395,608Inventory1,641,7351,512,886Total Operating Expenses12,086,33611,064,113Other Current Assets11,84713,642Operating Income or Loss2,048,3961,802,644Total Current Assets3,151,1572,813,049Income from Continuing OperationsLong Term Investments7121,288Total Other Income/Expenses Net-7,676-16,488Property Plant and Equipment2,382,4642,328,048Earnings Before Interest and Taxes2,048,3961,802,644Other Assets187,718166,966Interest Expense-18,847-19,569Deferred Long Term Asset Charges--Income Before Tax2,040,7201,786,156Total Assets5,722,0515,309,351Income Tax Expense677,967668,502Current LiabilitiesNet Income1,362,7531,117,654Accounts Payable1,059,8441,021,735Short/Current Long Term Debt84,973-Other Current Liabilities9,90224,559Total Current Liabilities1,926,4021,752,506Long Term Debt311,994396,493Other Liabilities434,347412,335Total Liabilities2,672,7432,561,334Stockholders' EquityPreferred Stock--Common Stock3,7963,919Retained Earnings2,071,4001,801,138Treasury Stock-318,252-272,755Capital Surplus1,292,3911,215,806Total Stockholder Equity3,049,3082,748,017Net Tangible Assets3,049,3082,748,017
Company 2Company #2Income StatementBalance SheetAll numbers in thousandsAll numbers in thousandsRevenue20182017Period Ending20182017Total Revenue38,972,93435,864,664Current AssetsCost of Revenue27,831,17725,502,167Cash And Cash Equivalents3,030,2002,758,477Gross Profit11,141,75710,362,497Short Term Investments-506,165Operating ExpensesNet Receivables860,000327,166Selling General and Administrative6,923,5646,375,071Inventory4,579,0004,187,243Total Operating Expenses34,754,74131,877,238Other Current Assets-12,217Operating Income or Loss4,218,1933,987,426Total Current Assets8,469,2008,485,727Income from Continuing OperationsLong Term Investments--Total Other Income/Expenses Net-44,982-130,838Property Plant and Equipment5,255,2005,006,053Earnings Before Interest and Taxes4,218,1933,987,426Goodwill97,600100,069Interest Expense-8,860-64,295Intangible Assets-144,900Income Before Tax4,173,2113,856,588Other Assets504,000321,266Income Tax Expense1,113,4131,248,640Deferred Long Term Asset Charges-6,558Net Income3,059,7982,607,948Total Assets14,326,00014,058,015Current LiabilitiesAccounts Payable2,644,1002,488,373Short/Current Long Term Debt--Other Current Liabilities-1,429,136Total Current Liabilities5,531,3005,125,537Long Term Debt2,233,6002,230,607Other Liabilities1,512,5001,331,645Total Liabilities9,277,4008,909,706Stockholders' EquityPreferred Stock--Common Stock5,048,600628,009Retained Earnings-4,962,159Treasury Stock--441,859Capital Surplus--Other Stockholder Equity--4 ...
Palestine last event orientationfvgnh .pptxRaedMohamed3
An EFL lesson about the current events in Palestine. It is intended to be for intermediate students who wish to increase their listening skills through a short lesson in power point.
More Related Content
Similar to Chapter # 6 (Variable costing and segment reporting - Managerial Accounting 17th edition).pptx
To understand the basic concepts of marginal cost and marginal costing.
To understand the difference between the Absorption costing and Marginal Costing.
To learn the practical applications of Marginal costing.
To understand Breakeven charts & Limitation
Dear students get fully solved assignments
Send your semester & Specialization name to our mail id :
“ help.mbaassignments@gmail.com ”
or
Call us at : 08263069601
Company 1Company #1Income StatementBalance SheetAll numbers in thoLynellBull52
Company 1Company #1Income StatementBalance SheetAll numbers in thousandsAll numbers in thousandsRevenue20182017Period Ending20182017Total Revenue14,134,73212,866,757Current AssetsCost of Revenue9,510,2388,668,505Cash And Cash Equivalents1,290,2941,111,599Gross Profit4,624,4944,198,252Short Term Investments512-Operating ExpensesNet Receivables87,86875,154Selling General and Administrative2,576,0982,395,608Inventory1,641,7351,512,886Total Operating Expenses12,086,33611,064,113Other Current Assets11,84713,642Operating Income or Loss2,048,3961,802,644Total Current Assets3,151,1572,813,049Income from Continuing OperationsLong Term Investments7121,288Total Other Income/Expenses Net-7,676-16,488Property Plant and Equipment2,382,4642,328,048Earnings Before Interest and Taxes2,048,3961,802,644Other Assets187,718166,966Interest Expense-18,847-19,569Deferred Long Term Asset Charges--Income Before Tax2,040,7201,786,156Total Assets5,722,0515,309,351Income Tax Expense677,967668,502Current LiabilitiesNet Income1,362,7531,117,654Accounts Payable1,059,8441,021,735Short/Current Long Term Debt84,973-Other Current Liabilities9,90224,559Total Current Liabilities1,926,4021,752,506Long Term Debt311,994396,493Other Liabilities434,347412,335Total Liabilities2,672,7432,561,334Stockholders' EquityPreferred Stock--Common Stock3,7963,919Retained Earnings2,071,4001,801,138Treasury Stock-318,252-272,755Capital Surplus1,292,3911,215,806Total Stockholder Equity3,049,3082,748,017Net Tangible Assets3,049,3082,748,017
Company 2Company #2Income StatementBalance SheetAll numbers in thousandsAll numbers in thousandsRevenue20182017Period Ending20182017Total Revenue38,972,93435,864,664Current AssetsCost of Revenue27,831,17725,502,167Cash And Cash Equivalents3,030,2002,758,477Gross Profit11,141,75710,362,497Short Term Investments-506,165Operating ExpensesNet Receivables860,000327,166Selling General and Administrative6,923,5646,375,071Inventory4,579,0004,187,243Total Operating Expenses34,754,74131,877,238Other Current Assets-12,217Operating Income or Loss4,218,1933,987,426Total Current Assets8,469,2008,485,727Income from Continuing OperationsLong Term Investments--Total Other Income/Expenses Net-44,982-130,838Property Plant and Equipment5,255,2005,006,053Earnings Before Interest and Taxes4,218,1933,987,426Goodwill97,600100,069Interest Expense-8,860-64,295Intangible Assets-144,900Income Before Tax4,173,2113,856,588Other Assets504,000321,266Income Tax Expense1,113,4131,248,640Deferred Long Term Asset Charges-6,558Net Income3,059,7982,607,948Total Assets14,326,00014,058,015Current LiabilitiesAccounts Payable2,644,1002,488,373Short/Current Long Term Debt--Other Current Liabilities-1,429,136Total Current Liabilities5,531,3005,125,537Long Term Debt2,233,6002,230,607Other Liabilities1,512,5001,331,645Total Liabilities9,277,4008,909,706Stockholders' EquityPreferred Stock--Common Stock5,048,600628,009Retained Earnings-4,962,159Treasury Stock--441,859Capital Surplus--Other Stockholder Equity--4 ...
Palestine last event orientationfvgnh .pptxRaedMohamed3
An EFL lesson about the current events in Palestine. It is intended to be for intermediate students who wish to increase their listening skills through a short lesson in power point.
We all have good and bad thoughts from time to time and situation to situation. We are bombarded daily with spiraling thoughts(both negative and positive) creating all-consuming feel , making us difficult to manage with associated suffering. Good thoughts are like our Mob Signal (Positive thought) amidst noise(negative thought) in the atmosphere. Negative thoughts like noise outweigh positive thoughts. These thoughts often create unwanted confusion, trouble, stress and frustration in our mind as well as chaos in our physical world. Negative thoughts are also known as “distorted thinking”.
Embracing GenAI - A Strategic ImperativePeter Windle
Artificial Intelligence (AI) technologies such as Generative AI, Image Generators and Large Language Models have had a dramatic impact on teaching, learning and assessment over the past 18 months. The most immediate threat AI posed was to Academic Integrity with Higher Education Institutes (HEIs) focusing their efforts on combating the use of GenAI in assessment. Guidelines were developed for staff and students, policies put in place too. Innovative educators have forged paths in the use of Generative AI for teaching, learning and assessments leading to pockets of transformation springing up across HEIs, often with little or no top-down guidance, support or direction.
This Gasta posits a strategic approach to integrating AI into HEIs to prepare staff, students and the curriculum for an evolving world and workplace. We will highlight the advantages of working with these technologies beyond the realm of teaching, learning and assessment by considering prompt engineering skills, industry impact, curriculum changes, and the need for staff upskilling. In contrast, not engaging strategically with Generative AI poses risks, including falling behind peers, missed opportunities and failing to ensure our graduates remain employable. The rapid evolution of AI technologies necessitates a proactive and strategic approach if we are to remain relevant.
The Roman Empire A Historical Colossus.pdfkaushalkr1407
The Roman Empire, a vast and enduring power, stands as one of history's most remarkable civilizations, leaving an indelible imprint on the world. It emerged from the Roman Republic, transitioning into an imperial powerhouse under the leadership of Augustus Caesar in 27 BCE. This transformation marked the beginning of an era defined by unprecedented territorial expansion, architectural marvels, and profound cultural influence.
The empire's roots lie in the city of Rome, founded, according to legend, by Romulus in 753 BCE. Over centuries, Rome evolved from a small settlement to a formidable republic, characterized by a complex political system with elected officials and checks on power. However, internal strife, class conflicts, and military ambitions paved the way for the end of the Republic. Julius Caesar’s dictatorship and subsequent assassination in 44 BCE created a power vacuum, leading to a civil war. Octavian, later Augustus, emerged victorious, heralding the Roman Empire’s birth.
Under Augustus, the empire experienced the Pax Romana, a 200-year period of relative peace and stability. Augustus reformed the military, established efficient administrative systems, and initiated grand construction projects. The empire's borders expanded, encompassing territories from Britain to Egypt and from Spain to the Euphrates. Roman legions, renowned for their discipline and engineering prowess, secured and maintained these vast territories, building roads, fortifications, and cities that facilitated control and integration.
The Roman Empire’s society was hierarchical, with a rigid class system. At the top were the patricians, wealthy elites who held significant political power. Below them were the plebeians, free citizens with limited political influence, and the vast numbers of slaves who formed the backbone of the economy. The family unit was central, governed by the paterfamilias, the male head who held absolute authority.
Culturally, the Romans were eclectic, absorbing and adapting elements from the civilizations they encountered, particularly the Greeks. Roman art, literature, and philosophy reflected this synthesis, creating a rich cultural tapestry. Latin, the Roman language, became the lingua franca of the Western world, influencing numerous modern languages.
Roman architecture and engineering achievements were monumental. They perfected the arch, vault, and dome, constructing enduring structures like the Colosseum, Pantheon, and aqueducts. These engineering marvels not only showcased Roman ingenuity but also served practical purposes, from public entertainment to water supply.
This is a presentation by Dada Robert in a Your Skill Boost masterclass organised by the Excellence Foundation for South Sudan (EFSS) on Saturday, the 25th and Sunday, the 26th of May 2024.
He discussed the concept of quality improvement, emphasizing its applicability to various aspects of life, including personal, project, and program improvements. He defined quality as doing the right thing at the right time in the right way to achieve the best possible results and discussed the concept of the "gap" between what we know and what we do, and how this gap represents the areas we need to improve. He explained the scientific approach to quality improvement, which involves systematic performance analysis, testing and learning, and implementing change ideas. He also highlighted the importance of client focus and a team approach to quality improvement.
Extraction Of Natural Dye From Beetroot (Beta Vulgaris) And Preparation Of He...SachinKumar945617
If you want to make , ppt, dissertation/research, project or any document edit service
DM me on what's app 8434381558
E-mail sachingone220@gmail.com
I will take charge depend upon how much pages u want
Basic Civil Engineering Notes of Chapter-6, Topic- Ecosystem, Biodiversity Green house effect & Hydrological cycle
Types of Ecosystem
(1) Natural Ecosystem
(2) Artificial Ecosystem
component of ecosystem
Biotic Components
Abiotic Components
Producers
Consumers
Decomposers
Functions of Ecosystem
Types of Biodiversity
Genetic Biodiversity
Species Biodiversity
Ecological Biodiversity
Importance of Biodiversity
Hydrological Cycle
Green House Effect
2. Table of Contents
• Explain How Variable Costing Differ from Absorption Costing and
Compute Unit product cost
• Prepare Income Statement using Both variable and absorption Costing
• Reconcile Variable Costing and Absorption Costing Net operating Income.
• Prepare a segmented Income Statement That differentiate Traceable
Fixed Cost From Common Cost and Use itTo mae dicision .
• Commute Companywide and Segmented Breakeven Point For a Company
with Traceable Fixed Cost.
2
3. Overview of Variable and Absorption
Costing
Variable Costing
Under variable costing, only those
manufacturing costs that vary with
output are treated as product costs.
This would usually include direct
materials, direct labor, and the
variable portion of manufacturing
overhead. Fixed manufacturing
overhead is not treated as a product
cost under this method.
Absorption Costing
Absorption costing treats all
manufacturing costs as product
costs, regardless of whether they
are variable or fixed. The cost of
a unit of product under the
absorption costing method
consists of direct materials, direct
labor, and both variable and fixed
manufacturing overhead
3
9. • how Weber Light Aircraft computed its variable costing net operating income for each month is
to focus on the contribution margin per aircraft sold, which is computed as follows:
9
10. • The variable costing net operating income for each period can always be computed by
multiplying the number of units sold by the contribution margin per unit and then
subtracting total fixed expenses. For Weber Light Aircraft these computations would
appear as follows:
10
11. Absorption Costing Income Statement
• The first step in preparing Weber’s absorption costing income statements for January,
February, and March is to determine the company’s unit product costs for each month as
follows:
11
12. Absorption Costing Income Statement
• the company’s absorption costing net operating income in each month would be
determined as shown in Exhibit 6–3.
12
13. Reconciliation of Variable Costing with Absorption Costing Income
• Variable costing and absorption costing net operating incomes can be
reconciled by determining how much fixed manufacturing overhead was
deferred in, or released from, inventories during the period:
13
16. Segmented Income Statements and the Contribution Approach
• segmented income statements are useful for analyzing the profitability of
segments, making decisions, and measuring the performance of segment
managers.
Segmented Income Statements—An Example
16
19. Break-Even Analysis
• ProphetMax’s total traceable fixed expenses are $171,000 and
its total common fixed expenses are $85,500. Furthermore, the
company’s overall contribution margin of $270,000 divided by
its total sales of $500,000 equals its overall CM ratio of 0.54.
Given this information, ProphetMax’s companywide break-even
point is computed as follows:
Dollar sales for company to break even = Traceable fixed
expenses + Common fixed expenses/ Overall CM ratio
= $171,000 + $85,500/ 0.54
=$256,500/0.54
= $475,000
19
20. • the Business Products Division’s traceable fixed expenses are $90,000 and its CM ratio is 0.50
($150,000 ÷ $300,000). Given this information, the Business Products Division’s break-even point is
computed as follows:
Dollar sales for a segment to break even = Segment
traceable fixed expenses/ Segment CM ratio
=$90,000/0.50
= $180,000
20
21. the Consumer Products Division’s traceable fixed expenses are
$81,000 and
its CM ratio is 0.60 ($120,000 ÷ $200,000), its break-even point is
computed as follows:
Dollar sales for a segment to break even = Segment traceable
fixed expenses / Segment CM ratio
= $81,000 / 0.60
= $135,000
21
22. • the sum of the segment break-even sales figures of $315,000 ($180,000+ $135,000) is
less than the companywide break-even point of $475,000. This occurs because the
segment break-even calculations do not include the company’s common fixed expenses.
The exclusion of the company’s common fixed expenses can be verified by preparing
income statements based on each segment’s break-even dollar sales as follows:
22
23. About Sukkur IBA University Kandhkot Campus
Sukkur IBA University – Kandhkot Campus has been
established to offer access to quality education to the people
of underprivileged areas of Pakistan. With its geographical
importance in Kandhkot city, the campus provides easy
access to the students hailing from south Punjab, northern
Sindh, and south-east Baluchistan. The campus offers
admission in various programs including undergraduate,
foundation semester, summer program, and short courses.
Undergraduate programs offered in three important
disciplines:
Bachelor of Business Administration
Bachelor of Computer Science
Bachelor of Education