Downloaded 78 times
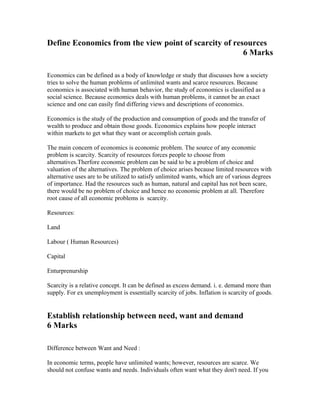


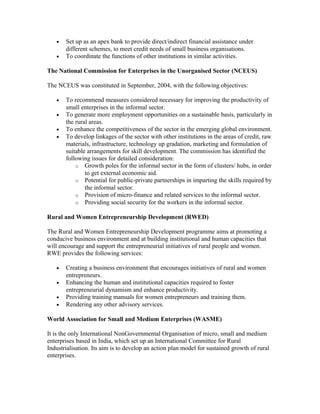
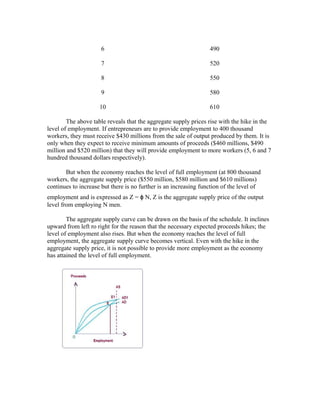
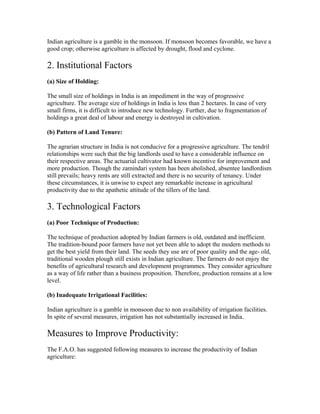
![3. Monopolistic Competition: Monopolistic competition, also called
competitive market, where there is a large number of firms, each having a
small proportion of the market share and slightly differentiated products.
Monopolistic competition is a type of imperfect competition such that many
producers sell products that are differentiated from one another as goods but not
perfect substitutes (such as from branding, quality, or location). In monopolistic
competition, a firm takes the prices charged by its rivals as given and ignores the
impact of its own prices on the prices of other firms.[1]
4 . Oligopoly: In which a market is dominated by a small number of firms that
together control the majority of the market share.
Duopoly, a special case of an oligopoly with two firms.
Monopsony, when there is only one buyer in a market.
Oligopsony, a market where many sellers can be present but meet only a
few buyers.
An oligopoly is a market form in which a market or industry is dominated by a
small number of sellers (oligopolists). A general lack of competition can lead to
higher costs for consumers. Because there are few sellers, each oligopolist is
likely to be aware of the actions of the others. The decisions of one firm
influence, and are influenced by, the decisions of other firms. Strategic planning
by oligopolists needs to take into account the likely responses of the other market
participants.](https://image.slidesharecdn.com/economicsquestionpapers-140622191726-phpapp02/85/IIIE-SECTION-A-ECONOMICS-NOTES-Economics-question-papers-4-320.jpg)
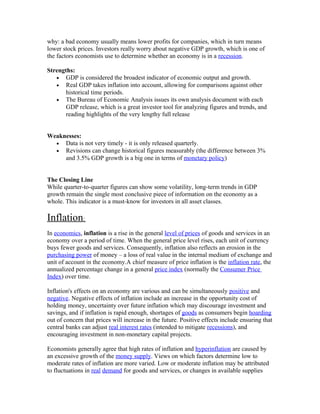
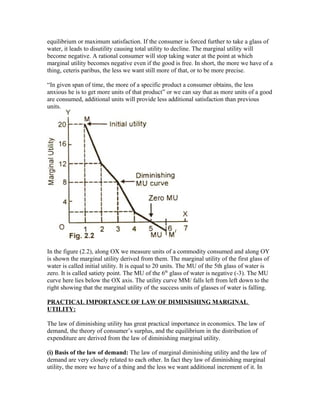
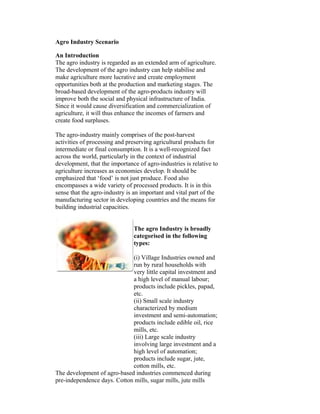
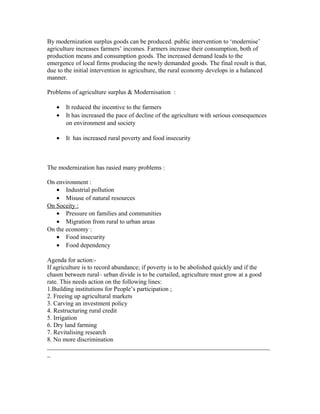
![CHARECTERSTICS :
Perfect Competition Monopoly Monopolistic
Competition
Oligopoly
Infinite buyers and
sellers who are willing
to supply and buy a
product at a ceratin
price.
Single seller There are many
producers and
many consumers
in the market,
and no business
has total control
over the market
price
An oligopoly
maximizes
profits by
producing where
marginal revenue
equals marginal
costs
Zero entry and exit
barriers – Easy to enter
or exit the market
High Barriers
to Entry
There are few barriers to
entry and exit. Entry and exit:
Barriers to entry
are high
Perfect factor mobility Price
Discriminatio
n
Consumers
perceive that
there are non-
price differences
among the
competitors'
products.
Oligopolies are
price setters
rather than price
takers
Perfect information Price Maker Producers have a
degree of control
over price
"Few" – a
"handful" of
sellers.[3]
There
are so few firms
that the actions
of one firm can
influence the
actions of the
other firms
Zero transaction costs Oligopolies can
retain long run
abnormal profits.
High barriers of
entry prevent
sideline firms
from entering
market to capture
excess profits](https://image.slidesharecdn.com/economicsquestionpapers-140622191726-phpapp02/85/IIIE-SECTION-A-ECONOMICS-NOTES-Economics-question-papers-5-320.jpg)


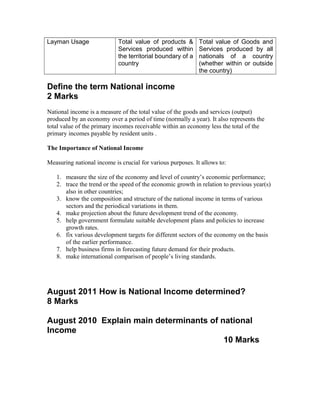


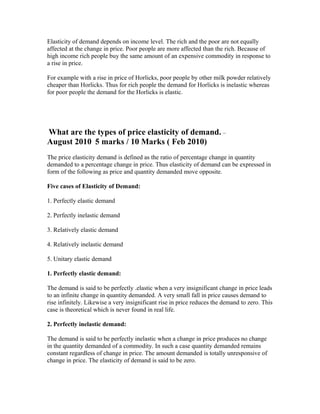


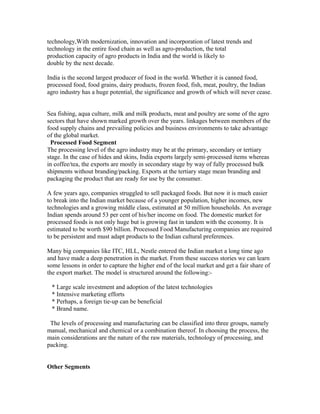


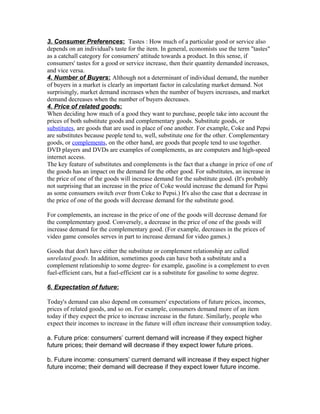
![Febraury 2010 What do you understand by
agricultural productivity ? Why is it low in India ?
5 + 15 marks
Agricultural productivity is measured as the ratio of agricultural outputs to agricultural
inputs. While individual products are usually measured by weight, their varying densities
make measuring overall agricultural output difficult. Therefore, output is usually
measured as the market value of final output, which excludes intermediate products such
as corn feed used in the meat industry. This output value may be compared to many
different types of inputs such as labour and land (yield). These are called partial measures
of productivity. Agricultural productivity may also be measured by what is termed total
factor productivity (TFP). This method of calculating agricultural productivity compares
an index of agricultural inputs to an index of outputs. This measure of agricultural
productivity was established to remedy the shortcomings of the partial measures of
productivity; notably that it is often hard to identify the factors cause them to change.
Changes in TFP are usually attributed to technological improvements.
The productivity of a region's farms is important for many reasons. Aside from providing
more food, increasing the productivity of farms affects the region's prospects for growth
and competitiveness on the agricultural market, income distribution and savings, and
labour migration. An increase in a region's agricultural productivity implies a more
efficient distribution of scarce resources. As farmers adopt new techniques and
differences in productivity arise, the more productive farmers benefit from an increase in
their welfare while farmers who are not productive enough will exit the market to seek
success elsewhere.[6]
As a region's farms become more productive, its comparative advantage in agricultural
products increases, which means that it can produce these products at a lower opportunity
cost than can other regions. Therefore, the region becomes more competitive on the
world market, which means that it can attract more consumers since they are able to buy
more of the products offered for the same amount of money.
Increases in agricultural productivity lead also to agricultural growth and can help to
alleviate poverty in poor and developing countries, where agriculture often employs the
greatest portion of the population. As farms become more productive, the wages earned
by those who work in agriculture increase. At the same time, food prices decrease and
food supplies become more stable. Labourers therefore have more money to spend on
food as well as other products. This also leads to agricultural growth. People see that](https://image.slidesharecdn.com/economicsquestionpapers-140622191726-phpapp02/85/IIIE-SECTION-A-ECONOMICS-NOTES-Economics-question-papers-55-320.jpg)
![there is a greater opportunity earn their living by farming and are attracted to agriculture
either as owners of farms themselves or as labourers.[7]
However, it is not only the people employed in agriculture who benefit from increases in
agricultural productivity. Those employed in other sectors also enjoy lower food prices
and a more stable food supply. Their wages may also increase.[7]
Agricultural productivity is becoming increasingly important as the world population
continues to grow. India, one of the world's most populous countries, has taken steps in
the past decades to increase its land productivity. Forty years ago, North India produced
only wheat, but with the advent of the earlier maturing high-yielding wheats and rices,
the wheat could be harvested in time to plant rice. This wheat/rice combination is now
widely used throughout the Punjab, Haryana, and parts of Uttar Pradesh. The wheat yield
of three tons and rice yield of two tons combine for five tons of grain per hectare, helping
to feed India's 1.1 billion people.
The causes for low productivity of Indian agriculture can be divided into 3 broad
categories, namely, (1) General factors, (2) Institutional factors and (3) Technological
factors.
1. General Factors
(a) Overcrowding in Agriculture:
The increasing pressure of population on land is an important demographic factor
responsible for low yield in agriculture. The area of cultivated land per cultivator has
declined from 0.43 hectare in 1901 to 0.23 hectare in 1981 despite an expansion of area
under cultivation. Hence, agricultural sector has become overcrowded and this has
adversely affected the agricultural productivity.
(b) Discouraging Rural Atmosphere: The Indian farmers, living in rural areas are
generally tradition-bound, illiterate, ignorant, superstitious and conservative. Their
attitude of apathy and neglect keeps the system of cultivation primitive. The farmers are
not prepared to accept anything new as a consequence of which modernization of
agriculture becomes difficult.
(c) Inadequate non-firm Services:
Shortage of finance, marketing and storage facilities are also responsible for agricultural
backwardness in India. The co-operatives and other institutional agencies have not been
able to eliminate the village money lenders. Storage facilities for farmers are not still
available to preserve their agricultural product for a better price.
(d) Natural Calamities:](https://image.slidesharecdn.com/economicsquestionpapers-140622191726-phpapp02/85/IIIE-SECTION-A-ECONOMICS-NOTES-Economics-question-papers-56-320.jpg)
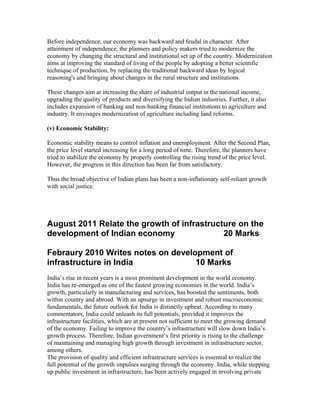
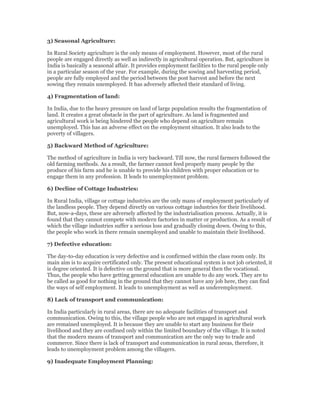
![1. The farmers should be provided with a stable price for their agricultural products at a
remunerative level.
2. There should be an expansion of adequate marketing facilities to sell the agricultural
product.
3. The land tenure system should be changed in favour of the cultivator.
4. There should be a provision of cheap credit on reasonable terms especially to small
farmers for better techniques of production.
5. The modern inputs like fertilisers. Pesticides and improved seeds should be made
available to the farmers at reasonable prices.
6. There should be provisions of education, research and extension of agro-economic
services to spread the knowledge of improved methods of farming.
7. The State should make provision for the development of resources which are not
possible in the part of individual farmers e.g. large scale irrigation, land reclamation or
resettlement projects.
8. There should be an extension of land used and intensification and utilisation of land
already in use through improved and scientific implements.
August 2010 Discuss Various factors responsible for
economic development in India
20 Marks
The economic development in India followed socialist-inspired policies for most of its
independent history, including state-ownership of many sectors; extensive regulation and
red tape known as "Licence Raj"; and isolation from the world economy. India's per
capita income increased at only around 1% annualized rate in the three decades after
Independence.[1]
Since the mid-1980s, India has slowly opened up its markets through
economic liberalization. After more fundamental reforms since 1991 and their renewal in
the 2000s, India has progressed towards a free market economy.
In the late 2000s, India's growth reached 7.5%, which will double the average income in
a decade.
Analysts say that if India pushed more fundamental market reforms, it could sustain the
rate and even reach the government's 2011 target of 10%](https://image.slidesharecdn.com/economicsquestionpapers-140622191726-phpapp02/85/IIIE-SECTION-A-ECONOMICS-NOTES-Economics-question-papers-58-320.jpg)
![The economic growth has been driven by the expansion of services that have been
growing consistently faster than other sectors. It is argued that the pattern of Indian
development has been a specific one and that the country may be able to skip the
intermediate industrialization-led phase in the transformation of its economic structure.
Serious concerns have been raised about the jobless nature of the economic growth.[
Favorable macroeconomic performance has been a necessary but not sufficient condition
for the significant reduction of poverty among the Indian population. The rate of poverty
decline has not been higher in the post-reform period (since 1991). The improvements in
some other non-economic dimensions of social development have been even less
favourable. The most pronounced example is an exceptionally high and persistent level of
child malnutrition
The progress of economic reforms in India is followed closely. The World Bank suggests
that the most important priorities are public sector reform, infrastructure, agricultural and
rural development, removal of labor regulations, reforms in lagging states, and
HIV/AIDS
India ranks second worldwide in farm output. Agriculture and allied sectors like forestry,
logging and fishing accounted for 18.6% of the GDP in 2005, employed 60% of the total
workforce[6]
and despite a steady decline of its share in the GDP, is still the largest
economic sector and plays a significant role in the overall socio-economic development
of India. Yields per unit area of all crops have grown since 1950, due to the special
emphasis placed on agriculture in the five-year plans and steady improvements in
irrigation, technology, application of modern agricultural practices and provision of
agricultural credit and subsidies since the green revolution.
• Agriculture development
• Emphasis on Industrial output
Aug 2010 Bring out the place of Agriculture in Indian
Economy 20 Marks
Agriculture plays an important role in Indian economomy. It contributes 30 % GDP.
With gradual industrialization, the share of agriculture has declined. It is the leading
industry for employing close to two thirds of the country’s working population.](https://image.slidesharecdn.com/economicsquestionpapers-140622191726-phpapp02/85/IIIE-SECTION-A-ECONOMICS-NOTES-Economics-question-papers-59-320.jpg)


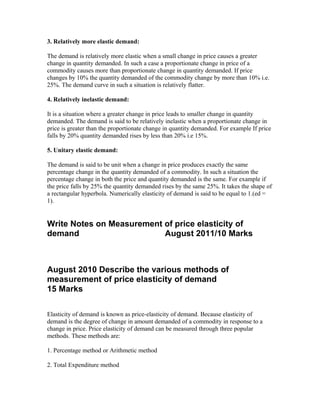
![August 2010 Write notes on Consumption Function
10 Marks
the consumption function is a single mathematical function used to express consumer
spending. It was developed by John Maynard Keynes
The function is used to calculate the amount of total consumption in an economy. It is
made up of autonomous consumption that is not influenced by current income and
induced consumption that is influenced by the economy's income level. This function
can be written in a variety of ways, an example being . This is
probably the most simplistic form of the consumption function.
The simple consumption function is shown as the affine function:
where
• C = total consumption,
• c0 = autonomous consumption (c0 > 0),
• c1 is the marginal propensity to consume (ie the induced consumption) (0 < c1 <
1), and
• Yd
= disposable income (income after government intervention – benefits, taxes
and transfer payments – or Y + (G – T)).
Autonomous consumption represents consumption when income is zero. In estimation,
this is usually assumed to be positive. The marginal propensity to consume (MPC), on the
other hand measures the rate at which consumption is changing when income is
changing. In a geometric fashion, the MPC is actually the slope of the consumption
function.
The MPC is assumed to be positive. Thus, as income increases, consumption increases.
However, Keynes mentioned that the increases (for income and consumption) are not
equal. According to him, "as income increases, consumption increases but not by as
much as the increase in income".
The Keynesian consumption function is also known as the absolute income hypothesis, as
it only bases consumption on current income and ignores potential future income (or lack
of). Criticism of this assumption lead to the development of Milton Friedman's permanent
income hypothesis and Franco Modigliani's life cycle hypothesis. More recent theoretical
approaches[1]
are based on behavioral economics and suggest that a number of
behavioural principles can be taken as microeconomic foundations for a behaviourally-
based aggregate consumption function.](https://image.slidesharecdn.com/economicsquestionpapers-140622191726-phpapp02/85/IIIE-SECTION-A-ECONOMICS-NOTES-Economics-question-papers-70-320.jpg)


![industrialisation and urbanisation have fuelled an increased demand for energy. It is estimated
that
if India continues to grow at the current rate, the Indian economy would emerge as the second
largest in the world, next only to China, by the year 2050. It is therefore expected that, the
demand
for energy would also rise substantially in the future.
Feb 2010 Define Wealth and explain its features
2 + 8 Marks
Wealth means abundance of valuable resources or material possessions.
According to Adam smith wealth is Annual produce of the land and labour of the society
This "produce" is, at its simplest, that which satisfies human needs and wants of utility. In
popular usage, wealth can be described as an abundance of items of economic value, or
the state of controlling or possessing such items, usually in the form of money, real estate
and personal property. An individual who is considered wealthy, affluent, or rich is
someone who has accumulated substantial wealth relative to others in their society or
reference group. In economics, net wealth refers to the value of assets owned minus the
value of liabilities owed at a point in time. Wealth can be categorized into three principal
categories: personal property, including homes or automobiles; monetary savings, such as
the accumulation of past income; and the capital wealth of income producing assets,
including real estate, stocks, bonds, and businesses
'Wealth' refers to some accumulation of resources (net asset value), whether abundant or
not. 'Richness' refers to an abundance of such resources (income or flow). A wealthy
individual, community, or nation thus has more accumulated resources (capital) than a
poor one. The opposite of wealth is destitution. The opposite of richness is poverty.
The term implies a social contract on establishing and maintaining ownership in relation
to such items which can be invoked with little or no effort and expense on the part of the
owner. The concept of wealth is relative and not only varies between societies, but varies
between different sections or regions in the same society. A personal net worth of US
$10,000 in most parts of the United States would certainly not place a person among the
wealthiest citizens of that locale. However, such an amount would constitute an
extraordinary amount of wealth in impoverished developing countries.
Concepts of wealth also vary across time. Modern labor-saving inventions and the
development of the sciences have enabled the poorest sectors of today's society to enjoy a
standard of living equivalent if not superior to the wealthy of the not-too-distant past.
This comparative wealth across time is also applicable to the future; given this trend[citation
needed]
of human advancement, it is likely that the standard of living that the wealthiest
enjoy today will be considered impoverished by future generations.](https://image.slidesharecdn.com/economicsquestionpapers-140622191726-phpapp02/85/IIIE-SECTION-A-ECONOMICS-NOTES-Economics-question-papers-73-320.jpg)


Economics can be defined as the study of how societies allocate scarce resources to satisfy unlimited wants. It deals with production, distribution, and consumption of goods and services, as well as the transfer of wealth. As economics involves human behavior, it is considered a social science rather than an exact science. The main focus of economics is scarcity - the gap between limited resources and unlimited wants. Scarcity forces people and societies to make choices about how to use resources.