1. Using our interactive population graphics, match each of the ag.docxjackiewalcutt
1. Using our interactive population graphics, match each of the age-sex population pyramids (labeled A through F) with the appropriate description.
(Points : 1)
Potential Matches:
1 : a country at close to zero population growth (Norway 1992)
2 : a country with many temporary immigrant workers (Qatar 1986)
3 : a country that shows the demographic effects of World War II (Russia 1992)
4 : a country that has undergone a recent shift from high to low fertility (China 1990)
5 : a country with declining population (Italy 1991)
6 : a country with rapid population growth (Tanzania 1985)
Answer
: A (top left)
: B (top center)
: C (top right)
: D (bottom left)
: E (bottom center)
: F (bottom right)
Question 2. 2. This is the first of four questions based on the interactive India-demographics tool. These graphs allow you to visualize the future population of India, as it changes throughout the 21st Century, under a variety of scenarios regarding changing fertility rates. All the scenarios start in 2000 with the following conditions:
· a total population of 1.014 billion
· a total fertility rate of 3.4
· a crude birth rate of 26.4 per thousand
· a crude death rate of 8.9 per thousand
Based on these numbers, what was India's rate of natural increase (i.e., annual population growth excluding net migration) in 2005? Note that you don't need to actually use the linked website to answer this question, since all of the numbers you need to calculate an answer are included above. (Points : 1)
0.55%
0.95%
1.75%
2.40%
3.10%
Question 3. 3. This is the second question based on the interactive India-demographics tool. One way we might establish a baseline for comparing alternative scenarios is to assume that the starting conditions persist indefinitely into the future. To do this using our tool, set the "Final Total Fertility Rate" to 3.4.
You'll see from the graphs, that this effectively freezes India in the middle of its demographic transition--longer life expectancies and lower death rates than in the pre-modern era, but birth rates hovering at a relatively high 24 or 25 per thousand. If this were actually to happen, the model shows us that India would end the century with a population of more than 3.6 billion! In what year would India's population first eclipse the two billion mark, double its turn-of-the-century size? (Points : 1)
2020
2030
2040
2050
2060
Question 4. 4. This is the third question based on the interactive India-demographics tool. In the previous question we tested one extreme scenario: fixing India's fertility rate at present levels. The opposite extreme would involve a sudden drop in fertility to well below the modern replacement rate, as actually has happened in much of Europe and East Asia. To view this scenario, set the "Final Total Fertility Rate" to 1.5, and leave the "Years to Achieve Final TFR" at zero.
You'll see from ...
Population Dynamics Lab ReportUse the following formula to c.docxharrisonhoward80223
Population Dynamics
Lab Report
Use the following formula to complete the charts below: pf = pi * ert
Where:
pf = final population
pi = initial population
e = a physical constant whose value is 2.7183
r = rate of growth
t = time (doubling time)
Change the rate of growth into a decimal by dividing by 100.
Use either your calculator that has an ex function or the calculator found on the following website: http://www.math.com/students/calculators/source/scientific.htm
Example:
pi = 5.2 X 10⁹ (initial population of 5.2 billion people in developing countries)
t = 39 years (from table 1)
r = 1.8% (from table 1)
r = 1.8% = 0.018
Multiply r and t 0.018 * 39 = 0.702
Pf = 5.2 * (e0.702)
On calculator, enter 0.702, then INV, then ex
Pf = 5.2 * (2.02)
Pf = 10.49 or 10.5 X 10⁹
Or 10.5 billion people
Table 1: Growth Rates and Doubling Times for Various Countries
Region
Growth Rate (%)
Doubling Time (years)
World
1.4
50
Developed Countries
0.4
175
Developing Countries
1.8
39
Africa
2.5
28
Asia
1.6
44
United States
1.0
70
Mexico
1.7
41
Europe
0.2
350
Russia
0.3
233
Oceania
1.5
47
Exercise One:
Part A: Using information from table 1, fill in the chart below and then calculate the final population for each.
Part B: Using information from table 1, fill in Part B of the chart but use the developed countries’ doubling time.
Region
r (%)
dt (years)
Pi (X 109)
Pf (X 109)
A
Developing
4.7
Developed
1.2
United States
0.303
Mexico
0.107
Africa
0.048
B
Developing
**
4.7
**Use doubling time of developed countries
Exercise Two:
Calculate the final population for developed nations where (r) starts at 0.6 and decreases by 0.1 percent every ten years until (r) = 0.0 percent (ZPG). The final population becomes the initial population for the next ten year period.
r (%)
t (years)
Pi (X 109)
Pf (X 109)
0.6
10
1.2
0.5
10
0.4
10
0.3
10
0.2
10
0.1
10
0.0
10
Calculate the final population for developing nations where (r) starts at 2.0 percent and decreases by 0.4 percent every ten years until (r) = 0.0 percent (ZPG). Remember, the final population becomes the initial population for the next ten years.
r (%)
t (years)
Pi (X 109)
Pf (X 109)
2.0
10
4.7
1.6
10
1.2
10
0.8
10
0.4
10
0.2
10
0.0
10
Using information from exercise one, answer the following questions.
1. Which country/region (do not consider the first three lines of information) has the highest growth rate? The lowest? How do you account for this difference?
2. Why do some countries/regions have a shorter or lower doubling time?
3. What would happen to the final population of developing countries if their growth rate is maintained over a developed countries doubling time?
Using information from exercise two, answer the following questions:
1. How do the final populations of developed regions and developing regions compare when zero population growth is reached?
2. Why were the growth rates used in this exercise differen.
Importance Of Population Growth
The Problem Of Population And Growth Essay
Population Growth And Economic Development
Population Growth Essay
The Impacts Of Population Growth
Causes Of Population Growth
Human Population Growth
Advantages And Disadvantages Of Population Growth
Reflection Paper On Population Growth
Population Growth in Perspective Essays
Effects Of Exponential Population Growth
Cause Of Population Growth In The United States
Factors Affecting Human Population Growth
The Impacts Of Population Growth
Urbanization Of Urban Population Growth Essay
Us Population Essay example
Population Growth And The Population Essay
Population Growth Essay
Advantages And Disadvantages Of Population Essay
The Human Population Essay
The Population Problem Essay
Population Growth Essay
Why The Human Population Grow So Fast
Essay on World Population
Population And Its Effects On The World
Global Environmental Issues Of The World
Essay on Population Growth and Standard of Living
Advantages And Disadvantages Of Population Growth
Essay on The Problems of Over Population
World Population Data Sheet At A Glance
Essay on Population Demographics
World Population Essay
The World Population Data Sheet Reported
Population Growth in Perspective Essays
The Human Population Challenge: From “Population Bomb” to “Demographic Crisis”Toni Menninger
A presentation about the Human Population Challenge developed for students in sustainability, including current data, basic demographic concepts, and a discussion of sustainability related issues.
The presentation "Growth in a Finite World" is closely related and precedes this lecture. The presentation "Energy Sustainability" is also suitable as a follow-up lecture.
VN stelt vervangingsmigratie als superoplossing voorThierry Debels
De Verenigde Naties stelt wereldwijd vervangingsmigratie (replacement migration) voor als oplossing voor een afnemende bevolking. De enige vraag is hoeveel migranten er per land nodig zijn.
Human Geography: Overpopulation Essay
Essay on Overpopulation
Overpopulation Essay
Causes of Overpopulation Essay
Essay On Overpopulation
Overpopulation Research Paper
Speech On Overpopulation
What Are The Effects Of Overpopulation
Arguments Against Human Overpopulation
Overpopulation Satire
Overpopulation : The Problem Of Overpopulation
The Negative Effects Of Overpopulation
Effects Of Overpopulation Essay
Essay on The Problems of Over Population
Overpopulation Essay
Cause And Effect Essay On Overpopulation
Overpopulation’s Effect on Environment Essay
Overpopulation Essay
Overpopulation Essay
Overpopulation And Family Planning
Individual Project
Medical Technology
Wed, 9/6/17
Numeric
100
0
4–6 pages not including title page and reference page.
View objectives for this assignment
My Work:
Assignment Description
The use of health information technology (HIT) has increased dramatically over the past decade, resulting in the federal government enacting several pieces of legislation such as the Health Insurance Portability and Accountability Act (HIPAA) of 1996 and the Health Information Technology for Economic and Clinical Health (HITECH) Act of 2009. Continuing to build on your proposal for a healthcare facility from Weeks 1 and 2, you are assigned to research and discuss the following:
Discuss the financial and health benefits that can be realized by implementing an electronic health record (EHR).
Research and explain the estimated cost of implementing an EHR and the estimated cost of managing an EHR over the long run.
Discuss current security concerns surrounding HIT and the EHR.
Discuss how electronic health records can be used for decision-making and problem-solving.
Choose 1 piece of federal legislation (e.g., HIPAA, HITECH Act, Meaningful Use), and discuss the requirements that legislation imposes on the use of HIT and the EHR.
Note:
You must use at least 4 scholarly references.
.
Individual Project
The Post-Watergate Era
Wed, 3/8/17
Numeric
250
0
2-3 pages
View objectives for this assignment
Go To:
Assignment Details
Scenario
Learning Materials
Reading Assignment
My Work:
Online Deliverables:
Submissions
Looking for tutoring?
Go to Smarthinking
Collapse All |
Expand All
Assignment Details
Assignment Description
There’s an old adage that says that history is always written by the winners. Although this is not always the case, it is true that people's sense of historical events is often influenced by the viewpoints of the historians who write about them.
During the Watergate scandal in 1974, many policy pundits wrote columns demanding that President Richard Nixon resign from the presidency because he was, in their view, clearly culpable for the Watergate break-ins. Not all pundits felt this way, however. Click
here
and
here
to read articles that offer differing views of President Nixon at the height of the Watergate scandal.
Complete the following for this assignment:
Step 1:
Summarize the arguments made in each of the two articles regarding the conduct of President Nixon. How might each of the author’s views impact the reader’s understanding of the Watergate crisis?
Step 2:
Describe how the Watergate events changed American views toward politics and politicians. In your view, how did these events change the press coverage of politicians?
Step 3:
Speculate about how the Watergate event coverage might have been different (better or worse) in the age of social media and smartphones. Would it have lasted as long? Why or why not? Are these innovations in technology helpful or harmful to the way that people understand current events?
At least 2 credible sources are required for this assignment. Your sources should be cited using APA format; both in-text citations and references. Please use the CTU Undergraduate Writing Style Guide for assistance on APA formatting.
References
Burch, D. (1974, May 14).
In defense of Richard Nixon
. Retrieved from The Harvard Crimson Web site: http://www.thecrimson.com/article/1974/5/14/in-defense-of-richard-nixon-pithe/
The Washington Post. (1973, May 1).
Editorial: Watergate: The unfinished business
. Retrieved from http://www.washingtonpost.com/wp-srv/national/longterm/watergate/articles/050173-2.htm
Other Information
Instructor's Comments:
Unit 3 Individual Project Essentials
Due Wednesday, March 8 by 11:59 PM Central Time
2 – 3 pages of content (your writing, not including references, headers, etc. )
Double-spaced, 12 pt font, Times New Roman
2 credible references (in addition to the two articles you must read), so 4 sources in total
In-text citations AND reference list
Summarize the arguments in each article and how they might impact a person’s view of Watergate
Describe how Watergate impacted how politicians and politics are viewed by Americans and how the press report on politicians.
How would Watergate be covered in the age of social media and smartphones?
.
Individual ProjectArticulating the Integrated PlanWed, 31.docxEstelaJeffery653
Individual Project
Articulating the Integrated Plan
Wed, 3/15/17
Numeric
150
0
See assignment details
Assignment Objectives
Demonstrate understanding of the use of a broad set of digital communication tools.
Determine the use of available tools for integrated marketing on the internet.
Assess which tools should be the most effective for promoting their specific new business ventures.
Create a digital marketing plan for inclusion into the business plan.
Key Assignment Draft
Throughout this course, you have articulated several aspects of marketing your planned new venture. Compile all of your writing and research, and insert it into your business plan framework. This compilation should include the following sections:
Expanded Market Environment
Marketing Mix
Digital Marketing Plan
Social Media Strategy
Financials (adjusted and expanded to account for marketing expense and success)
Be sure to integrate your mission and vision into your marketing plan. Consistency is important to your success.
Add the following sections to your plan:
Digital Marketing Policy (content standards, disclosure requirements, and other standards)
At least 1 of the following:
Philanthropy
People
Participation
Note:
Each section should be no longer than 1,500 words. Depending on the venture marketing approach, the marketing mix and digital marketing strategy documents will vary in length, detail, and complexity. In general terms, most business plan sections should be between 500–1,000 words.
.
More Related Content
Similar to Chapter 1PopulationPrudent men should judge of future
Importance Of Population Growth
The Problem Of Population And Growth Essay
Population Growth And Economic Development
Population Growth Essay
The Impacts Of Population Growth
Causes Of Population Growth
Human Population Growth
Advantages And Disadvantages Of Population Growth
Reflection Paper On Population Growth
Population Growth in Perspective Essays
Effects Of Exponential Population Growth
Cause Of Population Growth In The United States
Factors Affecting Human Population Growth
The Impacts Of Population Growth
Urbanization Of Urban Population Growth Essay
Us Population Essay example
Population Growth And The Population Essay
Population Growth Essay
Advantages And Disadvantages Of Population Essay
The Human Population Essay
The Population Problem Essay
Population Growth Essay
Why The Human Population Grow So Fast
Essay on World Population
Population And Its Effects On The World
Global Environmental Issues Of The World
Essay on Population Growth and Standard of Living
Advantages And Disadvantages Of Population Growth
Essay on The Problems of Over Population
World Population Data Sheet At A Glance
Essay on Population Demographics
World Population Essay
The World Population Data Sheet Reported
Population Growth in Perspective Essays
The Human Population Challenge: From “Population Bomb” to “Demographic Crisis”Toni Menninger
A presentation about the Human Population Challenge developed for students in sustainability, including current data, basic demographic concepts, and a discussion of sustainability related issues.
The presentation "Growth in a Finite World" is closely related and precedes this lecture. The presentation "Energy Sustainability" is also suitable as a follow-up lecture.
VN stelt vervangingsmigratie als superoplossing voorThierry Debels
De Verenigde Naties stelt wereldwijd vervangingsmigratie (replacement migration) voor als oplossing voor een afnemende bevolking. De enige vraag is hoeveel migranten er per land nodig zijn.
Human Geography: Overpopulation Essay
Essay on Overpopulation
Overpopulation Essay
Causes of Overpopulation Essay
Essay On Overpopulation
Overpopulation Research Paper
Speech On Overpopulation
What Are The Effects Of Overpopulation
Arguments Against Human Overpopulation
Overpopulation Satire
Overpopulation : The Problem Of Overpopulation
The Negative Effects Of Overpopulation
Effects Of Overpopulation Essay
Essay on The Problems of Over Population
Overpopulation Essay
Cause And Effect Essay On Overpopulation
Overpopulation’s Effect on Environment Essay
Overpopulation Essay
Overpopulation Essay
Overpopulation And Family Planning
Individual Project
Medical Technology
Wed, 9/6/17
Numeric
100
0
4–6 pages not including title page and reference page.
View objectives for this assignment
My Work:
Assignment Description
The use of health information technology (HIT) has increased dramatically over the past decade, resulting in the federal government enacting several pieces of legislation such as the Health Insurance Portability and Accountability Act (HIPAA) of 1996 and the Health Information Technology for Economic and Clinical Health (HITECH) Act of 2009. Continuing to build on your proposal for a healthcare facility from Weeks 1 and 2, you are assigned to research and discuss the following:
Discuss the financial and health benefits that can be realized by implementing an electronic health record (EHR).
Research and explain the estimated cost of implementing an EHR and the estimated cost of managing an EHR over the long run.
Discuss current security concerns surrounding HIT and the EHR.
Discuss how electronic health records can be used for decision-making and problem-solving.
Choose 1 piece of federal legislation (e.g., HIPAA, HITECH Act, Meaningful Use), and discuss the requirements that legislation imposes on the use of HIT and the EHR.
Note:
You must use at least 4 scholarly references.
.
Individual Project
The Post-Watergate Era
Wed, 3/8/17
Numeric
250
0
2-3 pages
View objectives for this assignment
Go To:
Assignment Details
Scenario
Learning Materials
Reading Assignment
My Work:
Online Deliverables:
Submissions
Looking for tutoring?
Go to Smarthinking
Collapse All |
Expand All
Assignment Details
Assignment Description
There’s an old adage that says that history is always written by the winners. Although this is not always the case, it is true that people's sense of historical events is often influenced by the viewpoints of the historians who write about them.
During the Watergate scandal in 1974, many policy pundits wrote columns demanding that President Richard Nixon resign from the presidency because he was, in their view, clearly culpable for the Watergate break-ins. Not all pundits felt this way, however. Click
here
and
here
to read articles that offer differing views of President Nixon at the height of the Watergate scandal.
Complete the following for this assignment:
Step 1:
Summarize the arguments made in each of the two articles regarding the conduct of President Nixon. How might each of the author’s views impact the reader’s understanding of the Watergate crisis?
Step 2:
Describe how the Watergate events changed American views toward politics and politicians. In your view, how did these events change the press coverage of politicians?
Step 3:
Speculate about how the Watergate event coverage might have been different (better or worse) in the age of social media and smartphones. Would it have lasted as long? Why or why not? Are these innovations in technology helpful or harmful to the way that people understand current events?
At least 2 credible sources are required for this assignment. Your sources should be cited using APA format; both in-text citations and references. Please use the CTU Undergraduate Writing Style Guide for assistance on APA formatting.
References
Burch, D. (1974, May 14).
In defense of Richard Nixon
. Retrieved from The Harvard Crimson Web site: http://www.thecrimson.com/article/1974/5/14/in-defense-of-richard-nixon-pithe/
The Washington Post. (1973, May 1).
Editorial: Watergate: The unfinished business
. Retrieved from http://www.washingtonpost.com/wp-srv/national/longterm/watergate/articles/050173-2.htm
Other Information
Instructor's Comments:
Unit 3 Individual Project Essentials
Due Wednesday, March 8 by 11:59 PM Central Time
2 – 3 pages of content (your writing, not including references, headers, etc. )
Double-spaced, 12 pt font, Times New Roman
2 credible references (in addition to the two articles you must read), so 4 sources in total
In-text citations AND reference list
Summarize the arguments in each article and how they might impact a person’s view of Watergate
Describe how Watergate impacted how politicians and politics are viewed by Americans and how the press report on politicians.
How would Watergate be covered in the age of social media and smartphones?
.
Individual ProjectArticulating the Integrated PlanWed, 31.docxEstelaJeffery653
Individual Project
Articulating the Integrated Plan
Wed, 3/15/17
Numeric
150
0
See assignment details
Assignment Objectives
Demonstrate understanding of the use of a broad set of digital communication tools.
Determine the use of available tools for integrated marketing on the internet.
Assess which tools should be the most effective for promoting their specific new business ventures.
Create a digital marketing plan for inclusion into the business plan.
Key Assignment Draft
Throughout this course, you have articulated several aspects of marketing your planned new venture. Compile all of your writing and research, and insert it into your business plan framework. This compilation should include the following sections:
Expanded Market Environment
Marketing Mix
Digital Marketing Plan
Social Media Strategy
Financials (adjusted and expanded to account for marketing expense and success)
Be sure to integrate your mission and vision into your marketing plan. Consistency is important to your success.
Add the following sections to your plan:
Digital Marketing Policy (content standards, disclosure requirements, and other standards)
At least 1 of the following:
Philanthropy
People
Participation
Note:
Each section should be no longer than 1,500 words. Depending on the venture marketing approach, the marketing mix and digital marketing strategy documents will vary in length, detail, and complexity. In general terms, most business plan sections should be between 500–1,000 words.
.
Individual Multilingualism Guidelines1)Where did the a.docxEstelaJeffery653
Individual Multilingualism Guidelines
1)
Where did the author conduct her study and what were some of the language varieties spoken there?
2)
What was the author’s overall argument about bilingual linguistic abilities, as opposed to older views?
3)
What were some major linguistic patterns at home?
4)
Choose ONE of the three profile cases: Provide an example of how one of the subjects switched between Spanish and English according to grammatical and social norms.
5)
What was one factor for the continued influence of Spanish vs. increased use of English among the families studied, respectively?
answer these questions in 2 pages
.
Individual Implementation Strategiesno new messagesObjectives.docxEstelaJeffery653
Individual: Implementation Strategies
no new messages
Objectives:
Using the paper started in Week One, add an additional 3 to 4 pages (1,050 to 1,400 words) describing your strategies for managing the project as follows: Develop a project communication plan to describe how stakeholders and managers will be kept informed regarding project progress. This will include the form of communication (status reports, meetings, etc.), frequency, and specific project milestones that will aid in determining where the implementation stands. Describe the various kinds of documentation that will be required to support the future system operation, including both user and technical documentation. Describe the Change Control Process that will be employed on the project to properly manage any disruptions to the progress of the project. Evaluate out-sourcing of implementation tasks, using consulting services versus performing them in-house, describing the costs, benefits, and challenges associated with each option. Incorporate feedback from your previous assignments. Format your paper consistent with APA guidelines. Update your project plan to include the tasks associated with this week's assignment. Zip your assignment into one file. Click the Assignment Files tab to submit your ZIP file of this week's assignments.
Using the paper started in Week One,
add
an additional 3 to 4 pages (1,050 to 1,400 words) describing your strategies for managing the project as follows:
Develop a project communication plan to describe how stakeholders and managers will be kept informed regarding project progress. This will include the form of communication (status reports, meetings, etc.), frequency, and specific project milestones that will aid in determining where the implementation stands.
Describe the various kinds of documentation that will be required to support the future system operation, including both user and technical documentation.
Describe the Change Control Process that will be employed on the project to properly manage any disruptions to the progress of the project.
Evaluate out-sourcing of implementation tasks, using consulting services versus performing them in-house, describing the costs, benefits, and challenges associated with each option.
Incorporate
feedback from your previous assignments.
Format
your paper consistent with APA guidelines.
Update
your project plan to include the tasks associated with this week's assignment.
Zip
your assignment into one file.
Click
the Assignment Files tab to submit your ZIP file of this week's assignments.
.
Individual Refine and Finalize WebsiteDueJul 02View m.docxEstelaJeffery653
Individual: Refine and Finalize Website
Due
Jul 02
View more
»
Expand view
Simple web forms can be used for order forms, a subscription to a newsletter, or a request for contact.
Using the course software,
refine
and
finalize
your website by doing the following:
Add a simple web form.
Use division or a table to structure the form elements.
Finalize a navigation system between the pages.
Note
: Utilizing the server-side elements offered in the textbook for testing forms is allowable.
Validate
your HTML code using the Markup Validation Service on the W3C
®
website, (www.w3.org) prior to submitting your web page(s).
Submit
your website files in a compressed (zipped) folder to the Assignment Files tab.
.
Individual Cultural Communication Written Assignment (Worth 20 of .docxEstelaJeffery653
Individual Cultural Communication Written Assignment (Worth 20% of Final Grade)
Complete a written paper (on a word document) about your culture. This paper requires correct grammar, punctuation, and APA format.
Requirements:
Use the following questions below as a template and address all questions within your written assignment.
The paper is worth 100 points (20%) of your course grade. A minimum of
Three (3)
references are required. References can come from a refereed journal article, course textbook, and or an Internet source.
You are expected to report on your cultural topic in a Four -Five pages (
Excluding Title and Reference Page
) typed word document. The assignment should be typed out on a Word Document with no larger than size 12 font, font names that should be used, times new roman or
Calabria
(not both), normal margins (no more than 1 inch), double spaced.
The following should be included in your assignment.
Assignment Layout:
1. Title Page:
Student Name (First and Last), Student Panther ID Number and Title
2. Introduction:
Describe what is Cultural Competency
Identify and describe your cultural ancestry. If you have more than one cultural ancestry, chose the one with which you most closely associate.
3. Assignment Content (Body of Paper):
Explore and describe the willingness of individuals in your culture to share thoughts, feelings, and ideas. Can you identify any area of discussion that would be considered taboo?
Explore and describe the practice and meaning of touch in your culture. Include information regarding touch between family members, friends, members of the opposite sex, and health-care providers.
Identify and describe personal spatial and distancing strategies used when communicating with others in your culture. Discuss differences between friends and families versus strangers.
Discuss your culture’s use of eye contact. Include information regarding practices between family members, friends, strangers, and persons of different age groups.
Explore and describe the meaning of gestures and facial expressions in your culture. Do specific gestures or facial expressions have special meanings? How are emotions displayed?
Discuss if there are acceptable ways of standing and greeting people in your culture?
Discuss the prevailing temporal relation of your culture. Is the culture’s
worldview
past, present, or future oriented? Prevailing temporal relations meaning, how do your culture perceive
healthcare
in general. Does your culture utilize certain remedies? Are they more relax about receiving proper
healthcare
? Do they seek a
healthcare
provider if their health is failing? How often they try to seek medical attention?
Discuss the impact of your culture in
healthcare
or within a
healthcare
setting.
4. Conclusion (Closing thoughts):
Discuss your closing thoughts (hypnotically), on how will your culture perceive
healthcare
in the future.
Discuss how being culturally competent will have an effect on you as a f.
Individual Project
The Basic Marketing Plan
Wed, 3/1/17
Numeric
100
0
1,200–1,500 words
Assignment Objectives
Demonstrate understanding of the use of a broad set of digital communication tools.
Determine the use of available tools for integrated marketing on the internet.
Assess which tools should be the most effective for promoting their specific new business ventures.
For this assignment, you will create a marketing mix document with the following 5 sections:
Product:
This section includes features, options, brand name, packaging, and service characteristics.
Price:
This section includes a pricing schedule, discounts, relative pricing, payment terms, and credit.
Place:
This section includes location, channels, in-store, on-shelf locations, on-site locations, and market coverage.
Promotion:
This section includes promoting, public relations (PR), and selling.
People, participation, or philanthropy:
This section includes information of your choosing.
.
Individual ProjectFinancial Procedures in a Health Care Organiza.docxEstelaJeffery653
Individual Project
Financial Procedures in a Health Care Organization
Wed, 7/26/17
2–3 pages; APA format, no errors. 100% turnitin check. NO Plagerism. On time.
healthinsurance companies provide the majority of the payment for medical services that clinics and physicians deliver. After the care has been delivered, the medical record is reviewed for completeness, codes are applied, and the billing office submits the claim to the insurance company or other third party payer for payment. There are several steps to take when submitting a claim form to the insurance company for reimbursement. The result of a clean claim is proper reimbursement for the services the facility has provided.
Discuss the following:
What does it mean to submit a clean claim?
List all of the information that is important before the claim can be submitted.
Discuss some of the reasons why a claim may be rejected.
State various reasons for the importance of a clean claim submission.
Address the consequences of not submitting a clean claim.
What steps should be taken to check the claim status?
As the practice manager, how would you ensure that the claims process results in clean claim submission and very few claim rejections.
.
Individual Expanded Website PlanView more »Expand view.docxEstelaJeffery653
Individual: Expanded Website Plan
View more
»
Expand view
A Site Map is a diagram, similar to an organizational chart, which shows a visual mapping of your site and how the pages will be linked together.
Add
a Site Map to your website plan.
.
Individual Expanded Website PlanDueJul 02View more .docxEstelaJeffery653
Individual: Expanded Website Plan
Due
Jul 02
View more
»
Expand view
Expand
your website plan.
Select
at least three interactive features that could be added to your site.
Identify
the following:
What purpose would each feature serve for your site and its visitors?
How would you construct these features?
Note
: The form created in the next individual activity, "Individual: Refine and Finalize Website" can be included as one of the interactive features.
.
Individual Communicating to Management Concerning Information Syste.docxEstelaJeffery653
Individual: Communicating to Management Concerning Information Systems
Due
Apr 17, 11:59 PM
View more
»
Expand view
Resources:
"Presentation Fundamentals" with Tatiana Kolovou on Lynda.com, Instructions for Completing a Video
Technology managers look for three critical fundamental skills from the IT professions hired today:
The ability to communicate effectively both verbally and in writing across all stakeholder levels
The ability to work in a team
The ability to think critically
You are on your second interview for a position in an Information Services Department. You will be presenting to a group of your peers, so they can see if you have good presentation skills. Your task is to:
Create a presentation containing eight to ten presentation slides including Introduction, Conclusion, and Reference slides.
Include speaker notes with each slide.
Describe one of the following type of systems:
A Transaction Processing System (For example, POS, ATM, Online Ordering)
A Functional Department System (For example, HRIS, Finance, CRM)
An Enterprise Resource Planning System
Describe the components or subsytems of the system and what business function they address.
Identify one vendor or open source solution for the system you chose to describe.
Discuss why you chose this system and how it will affect the overall business functions of the organization.
Note.
Be sure to include supportive graphics and appropriate backgrounds and styles. All references need to adhere to APA guidelines and images should not be copyrighted unless cited properly.
.
Individual Case Analysis-MatavIn max 4 single-spaced total pag.docxEstelaJeffery653
Individual Case Analysis-
Matav
In max 4 single-spaced total pages, please answer the following questions:
What is Matav’s strategy? Has it been successful?
Does Matav have competitive advantages in its domestic market?
Do Matav’s international expansion plans make sense?
If you were a member of the strategy group, what would you recommend to Andras Balogh?
DUE SUNDAY APRIL 2, 2017.
.
Individual Assignment Report Format• Report should contain not m.docxEstelaJeffery653
Individual Assignment Report Format
• Report should contain not more than 2,000 words, excluding cover page, content page and appendices. Indicate the total word-count at the end of your report.
• Report should be written with 12-pts Arial font type and 1.5line sentence spacing. Save the report in MS Word format with 1-inch margin on all sides of the A4-sized document.
• List the sources of your materials in the reference page.
.
Include LOCO api that allows user to key in an address and get the d.docxEstelaJeffery653
Include LOCO api that allows user to key in an address and get the directions on geolocation from their current location to the entered location. Most features that needs to be added is included in the attachment. Basic layout is provided. Application must work on phonegap. Uses only javascript and jquery. Let me know if interested then i will upload the basic layout
.
Include the title, the name of the composer (if known) and of the .docxEstelaJeffery653
Include the title, the name of the composer (if known) and of the performer. Describe the singing style.
Comment on the vocalist’s
breath control and vowel placement. Was there use of chest voice or
falsete
?
Comment on the lyrics (see translations in course reader) . Is the song
defiant, tender, passionate, remorseful, detached? Is there any imagery used? Is there any message? Identify the type of instrumental accompaniment.
required 4 pages
2 pages : track 16,
La Barca de Guaymas (Linda Ronstadt)
2 pages : track 19,
Paloma Negra
(Lola Beltrán)
I have the songs but i can't upload them
.
include as many events as possible to support your explanation of th.docxEstelaJeffery653
include as many events as possible to support your explanation of the term "globalization". it will help if included or more details and specifics. Essay Question below:
:
Why do historians believe that European civilization dominated the world
(economically, politically, and/or culturally) at the beginning of the 20
th
century? From your studies in this class, do you agree that the phrase “a global
village” accurately describes the 21
st
-century world? Explain why or why not
(use specific examples) ?
.
Incorporate the suggestions that were provided by your fellow projec.docxEstelaJeffery653
Incorporate the suggestions that were provided by your fellow project managers into your final
Project Management Plan
.
Finalize your Project Staffing subsection. This will be part of your Human Resource Management section or appendix.
Determine the number of resources that will be provided from within the enterprise and from outside contractors. Explain the reasoning behind the determination of the source for the personnel resources.
Make the necessary adjustments to the budget and the schedule, therefore establishing the baseline for those 2 areas.
An explanation will be required regarding the source of those personnel and why the use of that specific provider is necessary.
Thoroughly review your deliverable for spelling errors and correct word usage, grammar, and formatting.
**Please make sure to complete sections 3.0 (Human Resource Management) and 4.0 (Risk Management) of the Project Management Plan.
.
inal ProjectDUE Jun 25, 2017 1155 PMGrade DetailsGradeNA.docxEstelaJeffery653
inal Project
DUE: Jun 25, 2017 11:55 PM
Grade Details
Grade
N/A
Gradebook Comments
None
Assignment Details
Open Date
May 1, 2017 12:05 AM
Graded?
Yes
Points Possible
100.0
Resubmissions Allowed?
No
Attachments checked for originality?
Yes
.
include 1page proposal- short introduction to research paper and yo.docxEstelaJeffery653
include: 1page proposal- short introduction to research paper and your intention. 2 page Annotated bibliography - Summary of Books and articles and relationship to your project(at least one book and 2 scholarly articles).
Main htings to consider the concept of ; ethos, building, dwelling and thinking, path.
think about the four elements of the fourfold; earth sky/hoorizon, mortals and divinities.
.
Francesca Gottschalk - How can education support child empowerment.pptxEduSkills OECD
Francesca Gottschalk from the OECD’s Centre for Educational Research and Innovation presents at the Ask an Expert Webinar: How can education support child empowerment?
Embracing GenAI - A Strategic ImperativePeter Windle
Artificial Intelligence (AI) technologies such as Generative AI, Image Generators and Large Language Models have had a dramatic impact on teaching, learning and assessment over the past 18 months. The most immediate threat AI posed was to Academic Integrity with Higher Education Institutes (HEIs) focusing their efforts on combating the use of GenAI in assessment. Guidelines were developed for staff and students, policies put in place too. Innovative educators have forged paths in the use of Generative AI for teaching, learning and assessments leading to pockets of transformation springing up across HEIs, often with little or no top-down guidance, support or direction.
This Gasta posits a strategic approach to integrating AI into HEIs to prepare staff, students and the curriculum for an evolving world and workplace. We will highlight the advantages of working with these technologies beyond the realm of teaching, learning and assessment by considering prompt engineering skills, industry impact, curriculum changes, and the need for staff upskilling. In contrast, not engaging strategically with Generative AI poses risks, including falling behind peers, missed opportunities and failing to ensure our graduates remain employable. The rapid evolution of AI technologies necessitates a proactive and strategic approach if we are to remain relevant.
Biological screening of herbal drugs: Introduction and Need for
Phyto-Pharmacological Screening, New Strategies for evaluating
Natural Products, In vitro evaluation techniques for Antioxidants, Antimicrobial and Anticancer drugs. In vivo evaluation techniques
for Anti-inflammatory, Antiulcer, Anticancer, Wound healing, Antidiabetic, Hepatoprotective, Cardio protective, Diuretics and
Antifertility, Toxicity studies as per OECD guidelines
Instructions for Submissions thorugh G- Classroom.pptxJheel Barad
This presentation provides a briefing on how to upload submissions and documents in Google Classroom. It was prepared as part of an orientation for new Sainik School in-service teacher trainees. As a training officer, my goal is to ensure that you are comfortable and proficient with this essential tool for managing assignments and fostering student engagement.
Palestine last event orientationfvgnh .pptxRaedMohamed3
An EFL lesson about the current events in Palestine. It is intended to be for intermediate students who wish to increase their listening skills through a short lesson in power point.
Unit 8 - Information and Communication Technology (Paper I).pdfThiyagu K
This slides describes the basic concepts of ICT, basics of Email, Emerging Technology and Digital Initiatives in Education. This presentations aligns with the UGC Paper I syllabus.
The Roman Empire A Historical Colossus.pdfkaushalkr1407
The Roman Empire, a vast and enduring power, stands as one of history's most remarkable civilizations, leaving an indelible imprint on the world. It emerged from the Roman Republic, transitioning into an imperial powerhouse under the leadership of Augustus Caesar in 27 BCE. This transformation marked the beginning of an era defined by unprecedented territorial expansion, architectural marvels, and profound cultural influence.
The empire's roots lie in the city of Rome, founded, according to legend, by Romulus in 753 BCE. Over centuries, Rome evolved from a small settlement to a formidable republic, characterized by a complex political system with elected officials and checks on power. However, internal strife, class conflicts, and military ambitions paved the way for the end of the Republic. Julius Caesar’s dictatorship and subsequent assassination in 44 BCE created a power vacuum, leading to a civil war. Octavian, later Augustus, emerged victorious, heralding the Roman Empire’s birth.
Under Augustus, the empire experienced the Pax Romana, a 200-year period of relative peace and stability. Augustus reformed the military, established efficient administrative systems, and initiated grand construction projects. The empire's borders expanded, encompassing territories from Britain to Egypt and from Spain to the Euphrates. Roman legions, renowned for their discipline and engineering prowess, secured and maintained these vast territories, building roads, fortifications, and cities that facilitated control and integration.
The Roman Empire’s society was hierarchical, with a rigid class system. At the top were the patricians, wealthy elites who held significant political power. Below them were the plebeians, free citizens with limited political influence, and the vast numbers of slaves who formed the backbone of the economy. The family unit was central, governed by the paterfamilias, the male head who held absolute authority.
Culturally, the Romans were eclectic, absorbing and adapting elements from the civilizations they encountered, particularly the Greeks. Roman art, literature, and philosophy reflected this synthesis, creating a rich cultural tapestry. Latin, the Roman language, became the lingua franca of the Western world, influencing numerous modern languages.
Roman architecture and engineering achievements were monumental. They perfected the arch, vault, and dome, constructing enduring structures like the Colosseum, Pantheon, and aqueducts. These engineering marvels not only showcased Roman ingenuity but also served practical purposes, from public entertainment to water supply.
Welcome to TechSoup New Member Orientation and Q&A (May 2024).pdfTechSoup
In this webinar you will learn how your organization can access TechSoup's wide variety of product discount and donation programs. From hardware to software, we'll give you a tour of the tools available to help your nonprofit with productivity, collaboration, financial management, donor tracking, security, and more.
The French Revolution, which began in 1789, was a period of radical social and political upheaval in France. It marked the decline of absolute monarchies, the rise of secular and democratic republics, and the eventual rise of Napoleon Bonaparte. This revolutionary period is crucial in understanding the transition from feudalism to modernity in Europe.
For more information, visit-www.vavaclasses.com
Acetabularia Information For Class 9 .docxvaibhavrinwa19
Acetabularia acetabulum is a single-celled green alga that in its vegetative state is morphologically differentiated into a basal rhizoid and an axially elongated stalk, which bears whorls of branching hairs. The single diploid nucleus resides in the rhizoid.
Chapter 1PopulationPrudent men should judge of future
1. Chapter 1
Population
Prudent men should judge of future events by what has taken
place in the past,
and what is taking place in the present.
Miguel de Cervantes (1547–1616), Persiles and Sigismunda
The Changing Population of the World
The population of the world is growing. No one will be startled
by that sentence,
but what is startling is the rate of growth, and the fact that the
present growth of
population is unprecedented in human history. The best
historical evidence we have
today indicates that there were about 5 million people in the
world about 8000 bc.
By ad 1 there were about 200 million, and by 1650 the
population had grown to
about 500 million. The world reached its first billion people
about 1800; the second
billion came about 1930. The third billion was reached about
1960, the fourth about
1974, and the fifth about 1987. The sixth came in 1999 and the
seventh in 2011.
These figures indicate how rapidly the population is increasing.
Table 1.1 shows how
long it took the world to add each billion of its total population.
A projection is also
3. the whole pond the next day.
If you plot on a graph anything that has an exponential growth,
you get a J-curve.
For a long time there is not much growth but when the bend of
the curve in the
“J” is reached, the growth becomes dramatic. Figure 1.1 shows
what the earth’s
population growth curve looks like.
The growth of the earth’s population has been compared to a
long fuse on a
bomb: once the fuse is lit, it sputters along for a long while and
then suddenly the
bomb explodes. This is what is meant by the phrases
“population explosion” and
“population bomb.” The analogy is not a bad one. The world’s
population has passed
Table 1.1 Time taken to add each billion to the world
population,
1800–2046 (projection)
Date Estimated world
population (billions)
Years to add
1 billion people
1800 1 2,000,000
1930 2 130
1960 3 30
1974 4 14
1987 5 13
1999 6 12
2011 7 12
4. 2024 (projected) 8 13
2046 (projected) 9 22
Source: UN World Population Prospects: The 2008 Revision
Figure 1.1 Population growth from 8000 BC to 2011 AD
6
7
5
4
3
2
1
1999
2011
1987
1974
1960
1930
1800
8000
6. n
s
o
f
pe
o
pl
e
Year
0
Population 5
the bend of the J-curve and is now rapidly expanding. The
United Nations estimates
the world’s population reached 7 billion in 2011, shooting up
from the estimated 2
billion in 1930.
Figure 1.2 shows that the largest growth in the future will be in
the less developed
countries of the world, with India, Africa, and China leading the
way. At the end of
the twentieth century about 80 percent of the people in the
world lived in the devel-
oping countries. During the present century, nearly all of the
growth in population
will occur in the less developed countries. An ever-larger
7. percentage of the world’s
population will be relatively poor. In 1950 about two-thirds of
the world’s people
lived in the less developed countries. By 2000 this percentage
had increased to about
80 percent and the United Nations projects that by 2050 about
85 percent of the
earth’s population will be residing in the poorer nations.
Because no one knows for sure what the size of the earth’s
population will be in
the future, the United Nations gives three projections: a high,
medium, and low one,
based on the possible number of children the average woman
will have. Projections
are educated guesses. The United Nations believes the middle
projection is the most
likely and most authors writing on the subject use that number.
The population in
the developed regions is expected to slowly grow to 1.3 billion
in 2050 from 1.2
billion in 2008, with most of that growth in the United States
and Canada due to
immigration from less developed countries. The less developed
countries are expected
to increase from 5.5 billion in 2008 to 8.1 billion in 2050.1
From 2010 to 2050
about one-half of the annual growth is expected to occur in nine
countries – India,
Pakistan, Nigeria, Ethiopia, the United States, the Democratic
Republic of the
Congo, Tanzania, China, and Bangladesh. (These countries are
listed according to
Figure 1.2 Population growth in less developed and more
developed countries, 1950–2050
8. (projected)
Source: United Nations Population Division, World Population
Prospects: The 2006 Revision, Medium
Variant (2007).
10
9
8
7
6
5
4
3
2
1
0
1950 1970 1990 2010 2030
(projected)
Other less developed countries
Africa
China
9. India
Population (billions)
2050
(projected)
More developed countries
6 Global Issues
the size of their contribution to world population growth.) The
largest growth is
expected in India, which is likely to pass China by 2028 to be
the largest country in
the world, with 1.5 billion people. At that time India and China
will account for
about one-third of the world’s population. Figure 1.3 gives the
three growth projec-
tions by the United Nations up to 2050.
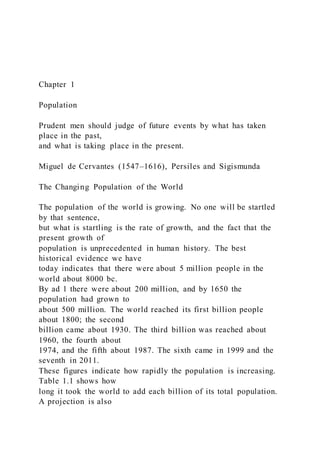
High growth rates will take place in the less developed
countries because a large
percentage of their population consists of children under the age
of 15 who will be
growing older and having children themselves. If we plot the
number of people in a
country according to their ages, we can see clearly the
difference between rapidly
growing populations, which most less developed nations have,
and relatively stable
or slowly growing populations, which the more developed
nations have. Figure 1.4
shows the difference between the populations of the more
10. developed countries and
less developed countries. The age structure of the more
developed countries is gener-
ally column shaped, while the age structure of the less
developed countries is usually
pyramid shaped.
Another major change occurring in the world’s population is the
movement of
people from rural areas to urban areas. Although this is
happening throughout the
world, the trend is especially dramatic in the developing world,
where people are
fleeing rural areas to escape the extreme poverty that is
common in those areas, and
because the cities seem to offer a more stimulating life. Mostly
it is the young people
who go to the cities, hoping to find work and better living
conditions. But all too
often jobs are not available in the cities either. These rural
migrants usually settle in
Figure 1.3 World population projections to 2050: three
scenarios
Source: United Nations Population Division, World Population
Prospects: The 2008 Revision (2009).
B
ill
io
n
s
12
11. 10
0
2000 2005 2010 2015 2020 2025 2030 2035 2040
High 10.5
9.1
8.0
Medium
Low
2045 2050
8
6
4
2
Population 7
slums on the edges of the big cities. At current rates the
populations in these informal
settlements will double every 10 to 15 years. It is hard to
imagine a city like Calcutta
getting any bigger. In 1950, when I visited it, it had a
population of about 4 million,
and thousands of these people lived permanently on the streets;
12. in 1990 it had a
population of about 13 million and an estimated 400,000 lived
on the streets.2 If
the present rate of growth continues, it will have a population of
about 17 million
by 2015. Table 1.2 gives the world’s ten largest cities in 1950
and 2000 and the
Figure 1.4 Population by age and sex in developed and less
developed countries 2010
(projected)
Source: United Nations Population Division, World Population
Prospects: The 2008 Revision (2009).
85+
80–84
75–79
70–74
65–69
60–64
55–59
50–54
45–49
40–44
35–39
30–34
25–29
20–24
15–19
10–14
5–9
0–4
85+
80–84
14. Population in 1950 (millions) Population in 2000
(millions)
Population in 2015
(projected) (millions)
New York, US 12 Tokyo, Japan 26 Tokyo, Japan 27
London, UK 9 Mexico City,
Mexico
18 Delhi, India 24
Tokyo, Japan 7 São Paolo, Brazil 18 Mumbai (Bombay),
India
22
Paris, France 5 New York, US 17 Sao Paulo, Brazil 21
Moscow, USSR 5 Buenos Aires, 16 Mexico City, Mexico 20
Shanghai, China 5 Los Angeles, US 13 New York-Newark, US
20
Essen, Germany 5 Calcutta, India 13 Shanghai, China 18
Buenos Aires, Argentina 5 Shanghai, China 13 Calcutta, India
17
Chicago, US 5 Dhaka, Bangladesh 13 Dhaka, Bangladesh 17
Calcutta, India 4 Delhi, India 12 Karachi, Pakistan 15
a Formally called “urban agglomerations” in UN publications.
Source: (for 2015 projections) UN Population Division, World
Urbanization Prospects: The 2009 Revision
Plate 1.2 Growing cities in less developed nations often have a
mixture of modern and
15. substandard housing (United Nations)
Plate 1.1 Rural migrants often settle in urban slums in
developing nations (United Nations)
Population 9
The most innovative city in the world: Curitiba, Brazil
Curitiba, Brazil, has been called the most innovative city in the
world. City
officials from around the world visit Curitiba to learn how this
city, with rela-
tively limited funds, has been tackling urban problems. By
using imaginative,
low-cost solutions and low technology, Curitiba has created a
pleasant urban
life that many cities in the more developed nations have yet to
achieve. Here
is how the city achieved this.
Transportation The city has made public transportation
attractive, afford-
able, and efficient. Instead of building a subway, which the city
could not afford,
it established a system of extended, high-speed buses, some
carrying as many
as 275 passengers, on express routes, connecting the city center
with outlying
areas. Many people own cars in Curitiba but 85 percent of the
commuters use
public transportation. This has reduced traffic congestion and
air pollution.
There are 30 percent fewer cars on city streets than you would
16. expect from the
number of cars owned by its residents.
Trash collection Poor people are encouraged to collect
recyclable trash in
the areas where they live and turn it in for food. In 1995 the
city gave out
about 350,000 Easter eggs, 25,000 Christmas cakes, and 2
million pounds of
food in exchange for trash. About 70 percent of its trash is
recycled, one of the
highest rates in the world.
Education Small libraries have been built throughout the city in
the shape
of a lighthouse. Called Lighthouses of Learning, they provide
books (many
schools in Brazil have no books), an attractive study room, and,
in a tower, a
strong light and guard to make the area safe.
Health Curitiba has more health clinics – that are open 24 hours
a day –
per person than any other city in Brazil.
Environmental education The Free University for the
Environment was
built out of recycled old utility poles next to a lake made from
an old quarry.
Short courses on how to make better use of the environment
have been
designed for contractors, merchants, and housewives. Taxi
drivers are required
to take a course there in order to get their licenses.
(Continued)
17. projected ten largest for the year 2015.3 Note that eight of the
ten largest cities in
the year 2015 are expected to be in the less developed countries
– Tokyo and New
York are the exceptions – whereas in 1950 only three of the ten
were in the poorer
countries (Shanghai, Buenos Aires, and Calcutta).
Note also the increased size of the cities. Cities with over 5
million people are
sometimes called “megacities.” In 1950 Buenos Aires and
Shanghai were the only
cities in the developing world with at least 5 million people. By
2005 there were
about 60 megacities in the world with the majority of them
being in the less devel-
oped nations. Many of these cities had vast areas of substandard
housing and serious
urban pollution, and many of their residents lived without
sanitation facilities, safe
drinking water, or adequate healthcare facilities.
Chapter 1
Population
Prudent men should judge of future events by what has taken
place in the past,
and what is taking place in the present.
Miguel de Cervantes (1547–1616), Persiles and Sigismunda
18. The Changing Population of the World
The population of the world is growing. No one will be startled
by that sentence,
but what is startling is the rate of growth, and the fact that the
present growth of
population is unprecedented in human history. The best
historical evidence we have
today indicates that there were about 5 million people in the
world about 8000 bc.
By ad 1 there were about 200 million, and by 1650 the
population had grown to
about 500 million. The world reached its first billion people
about 1800; the second
billion came about 1930. The third billion was reached about
1960, the fourth about
1974, and the fifth about 1987. The sixth came in 1999 and the
seventh in 2011.
These figures indicate how rapidly the population is increasing.
Table 1.1 shows how
long it took the world to add each billion of its total population.
A projection is also
given for the next billion.
There is another way to look at population growth, one that
helps us understand
the uniqueness of our situation and its staggering possibilities
for harm to life on this
planet. Because most people born can have children of their
own, the human popula-
tion can – until certain limits are reached – grow exponentially:
1 to 2; 2 to 4; 4 to
8; 8 to 16; 16 to 32; 32 to 64; 64 to 128; and so on. When
something grows expo-
nentially, there is hardly discernible growth in the early stages
and then the numbers
20. bomb explodes. This is what is meant by the phrases
“population explosion” and
“population bomb.” The analogy is not a bad one. The world’s
population has passed
Table 1.1 Time taken to add each billion to the world
population,
1800–2046 (projection)
Date Estimated world
population (billions)
Years to add
1 billion people
1800 1 2,000,000
1930 2 130
1960 3 30
1974 4 14
1987 5 13
1999 6 12
2011 7 12
2024 (projected) 8 13
2046 (projected) 9 22
Source: UN World Population Prospects: The 2008 Revision
Figure 1.1 Population growth from 8000 BC to 2011 AD
6
7
5
4
23. 0
Population 5
the bend of the J-curve and is now rapidly expanding. The
United Nations estimates
the world’s population reached 7 billion in 2011, shooting up
from the estimated 2
billion in 1930.
Figure 1.2 shows that the largest growth in the future will be in
the less developed
countries of the world, with India, Africa, and China leading the
way. At the end of
the twentieth century about 80 percent of the people in the
world lived in the devel-
oping countries. During the present century, nearly all of the
growth in population
will occur in the less developed countries. An ever-larger
percentage of the world’s
population will be relatively poor. In 1950 about two-thirds of
the world’s people
lived in the less developed countries. By 2000 this percentage
had increased to about
80 percent and the United Nations projects that by 2050 about
85 percent of the
earth’s population will be residing in the poorer nations.
Because no one knows for sure what the size of the earth’s
population will be in
the future, the United Nations gives three projections: a high,
medium, and low one,
based on the possible number of children the average woman
24. will have. Projections
are educated guesses. The United Nations believes the middle
projection is the most
likely and most authors writing on the subject use that number.
The population in
the developed regions is expected to slowly grow to 1.3 billion
in 2050 from 1.2
billion in 2008, with most of that growth in the United States
and Canada due to
immigration from less developed countries. The less developed
countries are expected
to increase from 5.5 billion in 2008 to 8.1 billion in 2050.1
From 2010 to 2050
about one-half of the annual growth is expected to occur in nine
countries – India,
Pakistan, Nigeria, Ethiopia, the United States, the Democratic
Republic of the
Congo, Tanzania, China, and Bangladesh. (These countries are
listed according to
Figure 1.2 Population growth in less developed and more
developed countries, 1950–2050
(projected)
Source: United Nations Population Division, World Population
Prospects: The 2006 Revision, Medium
Variant (2007).
10
9
8
7
6
25. 5
4
3
2
1
0
1950 1970 1990 2010 2030
(projected)
Other less developed countries
Africa
China
India
Population (billions)
2050
(projected)
More developed countries
6 Global Issues
the size of their contribution to world population growth.) The
26. largest growth is
expected in India, which is likely to pass China by 2028 to be
the largest country in
the world, with 1.5 billion people. At that time India and China
will account for
about one-third of the world’s population. Figure 1.3 gives the
three growth projec-
tions by the United Nations up to 2050.
High growth rates will take place in the less developed
countries because a large
percentage of their population consists of children under the age
of 15 who will be
growing older and having children themselves. If we plot the
number of people in a
country according to their ages, we can see clearly the
difference between rapidly
growing populations, which most less developed nations have,
and relatively stable
or slowly growing populations, which the more developed
nations have. Figure 1.4
shows the difference between the populations of the more
developed countries and
less developed countries. The age structure of the more
developed countries is gener-
ally column shaped, while the age structure of the less
developed countries is usually
pyramid shaped.
Another major change occurring in the world’s population is the
movement of
people from rural areas to urban areas. Although this is
happening throughout the
world, the trend is especially dramatic in the developing world,
where people are
fleeing rural areas to escape the extreme poverty that is
27. common in those areas, and
because the cities seem to offer a more stimulating life. Mostly
it is the young people
who go to the cities, hoping to find work and better living
conditions. But all too
often jobs are not available in the cities either. These rural
migrants usually settle in
Figure 1.3 World population projections to 2050: three
scenarios
Source: United Nations Population Division, World Population
Prospects: The 2008 Revision (2009).
B
ill
io
n
s
12
10
0
2000 2005 2010 2015 2020 2025 2030 2035 2040
High 10.5
9.1
8.0
Medium
Low
28. 2045 2050
8
6
4
2
Population 7
slums on the edges of the big cities. At current rates the
populations in these informal
settlements will double every 10 to 15 years. It is hard to
imagine a city like Calcutta
getting any bigger. In 1950, when I visited it, it had a
population of about 4 million,
and thousands of these people lived permanently on the streets;
in 1990 it had a
population of about 13 million and an estimated 400,000 lived
on the streets.2 If
the present rate of growth continues, it will have a population of
about 17 million
by 2015. Table 1.2 gives the world’s ten largest cities in 1950
and 2000 and the
Figure 1.4 Population by age and sex in developed and less
developed countries 2010
(projected)
Source: United Nations Population Division, World Population
Prospects: The 2008 Revision (2009).
30. 5–9
0–4
Males
Population (millions), 2010
300 200 100 0 100 200 300
Age DEVELOPED COUNTRIES
Females Males
Population (millions), 2010
300 200 100 0 100 200 300
Age DEVELOPING COUNTRIES
Females
Table 1.2 Ten largest citiesa in the world, 1950, 2000, and 2015
(projection)
Population in 1950 (millions) Population in 2000
(millions)
Population in 2015
(projected) (millions)
New York, US 12 Tokyo, Japan 26 Tokyo, Japan 27
London, UK 9 Mexico City,
Mexico
18 Delhi, India 24
Tokyo, Japan 7 São Paolo, Brazil 18 Mumbai (Bombay),
31. India
22
Paris, France 5 New York, US 17 Sao Paulo, Brazil 21
Moscow, USSR 5 Buenos Aires, 16 Mexico City, Mexico 20
Shanghai, China 5 Los Angeles, US 13 New York-Newark, US
20
Essen, Germany 5 Calcutta, India 13 Shanghai, China 18
Buenos Aires, Argentina 5 Shanghai, China 13 Calcutta, India
17
Chicago, US 5 Dhaka, Bangladesh 13 Dhaka, Bangladesh 17
Calcutta, India 4 Delhi, India 12 Karachi, Pakistan 15
a Formally called “urban agglomerations” in UN publications.
Source: (for 2015 projections) UN Population Division, World
Urbanization Prospects: The 2009 Revision
Plate 1.2 Growing cities in less developed nations often have a
mixture of modern and
substandard housing (United Nations)
Plate 1.1 Rural migrants often settle in urban slums in
developing nations (United Nations)
Population 9
The most innovative city in the world: Curitiba, Brazil
Curitiba, Brazil, has been called the most innovative city in the
world. City
officials from around the world visit Curitiba to learn how this
32. city, with rela-
tively limited funds, has been tackling urban problems. By
using imaginative,
low-cost solutions and low technology, Curitiba has created a
pleasant urban
life that many cities in the more developed nations have yet to
achieve. Here
is how the city achieved this.
Transportation The city has made public transportation
attractive, afford-
able, and efficient. Instead of building a subway, which the city
could not afford,
it established a system of extended, high-speed buses, some
carrying as many
as 275 passengers, on express routes, connecting the city center
with outlying
areas. Many people own cars in Curitiba but 85 percent of the
commuters use
public transportation. This has reduced traffic congestion and
air pollution.
There are 30 percent fewer cars on city streets than you would
expect from the
number of cars owned by its residents.
Trash collection Poor people are encouraged to collect
recyclable trash in
the areas where they live and turn it in for food. In 1995 the
city gave out
about 350,000 Easter eggs, 25,000 Christmas cakes, and 2
million pounds of
food in exchange for trash. About 70 percent of its trash is
recycled, one of the
highest rates in the world.
Education Small libraries have been built throughout the city in
33. the shape
of a lighthouse. Called Lighthouses of Learning, they provide
books (many
schools in Brazil have no books), an attractive study room, and,
in a tower, a
strong light and guard to make the area safe.
Health Curitiba has more health clinics – that are open 24 hours
a day –
per person than any other city in Brazil.
Environmental education The Free University for the
Environment was
built out of recycled old utility poles next to a lake made from
an old quarry.
Short courses on how to make better use of the environment
have been
designed for contractors, merchants, and housewives. Taxi
drivers are required
to take a course there in order to get their licenses.
(Continued)
projected ten largest for the year 2015.3 Note that eight of the
ten largest cities in
the year 2015 are expected to be in the less developed countri es
– Tokyo and New
York are the exceptions – whereas in 1950 only three of the ten
were in the poorer
countries (Shanghai, Buenos Aires, and Calcutta).
Note also the increased size of the cities. Cities with over 5
million people are
sometimes called “megacities.” In 1950 Buenos Aires and
Shanghai were the only
cities in the developing world with at least 5 million people. By
34. 2005 there were
about 60 megacities in the world with the majority of them
being in the less devel-
oped nations. Many of these cities had vast areas of substandard
housing and serious
urban pollution, and many of their residents lived without
sanitation facilities, safe
drinking water, or adequate healthcare facilities.