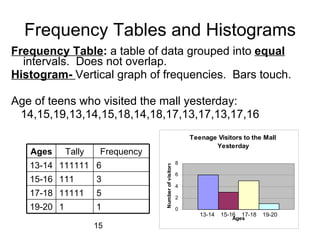
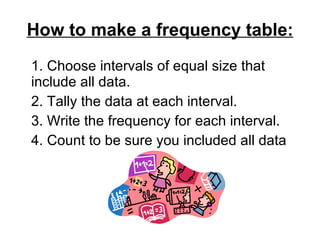
The document summarizes how to create frequency tables and histograms from raw data. It discusses grouping data into equal intervals, tallying the frequencies, and drawing bars on a histogram to represent each frequency interval that touch without overlaps. It also provides an example of creating a frequency table and histogram based on roller coaster height data.