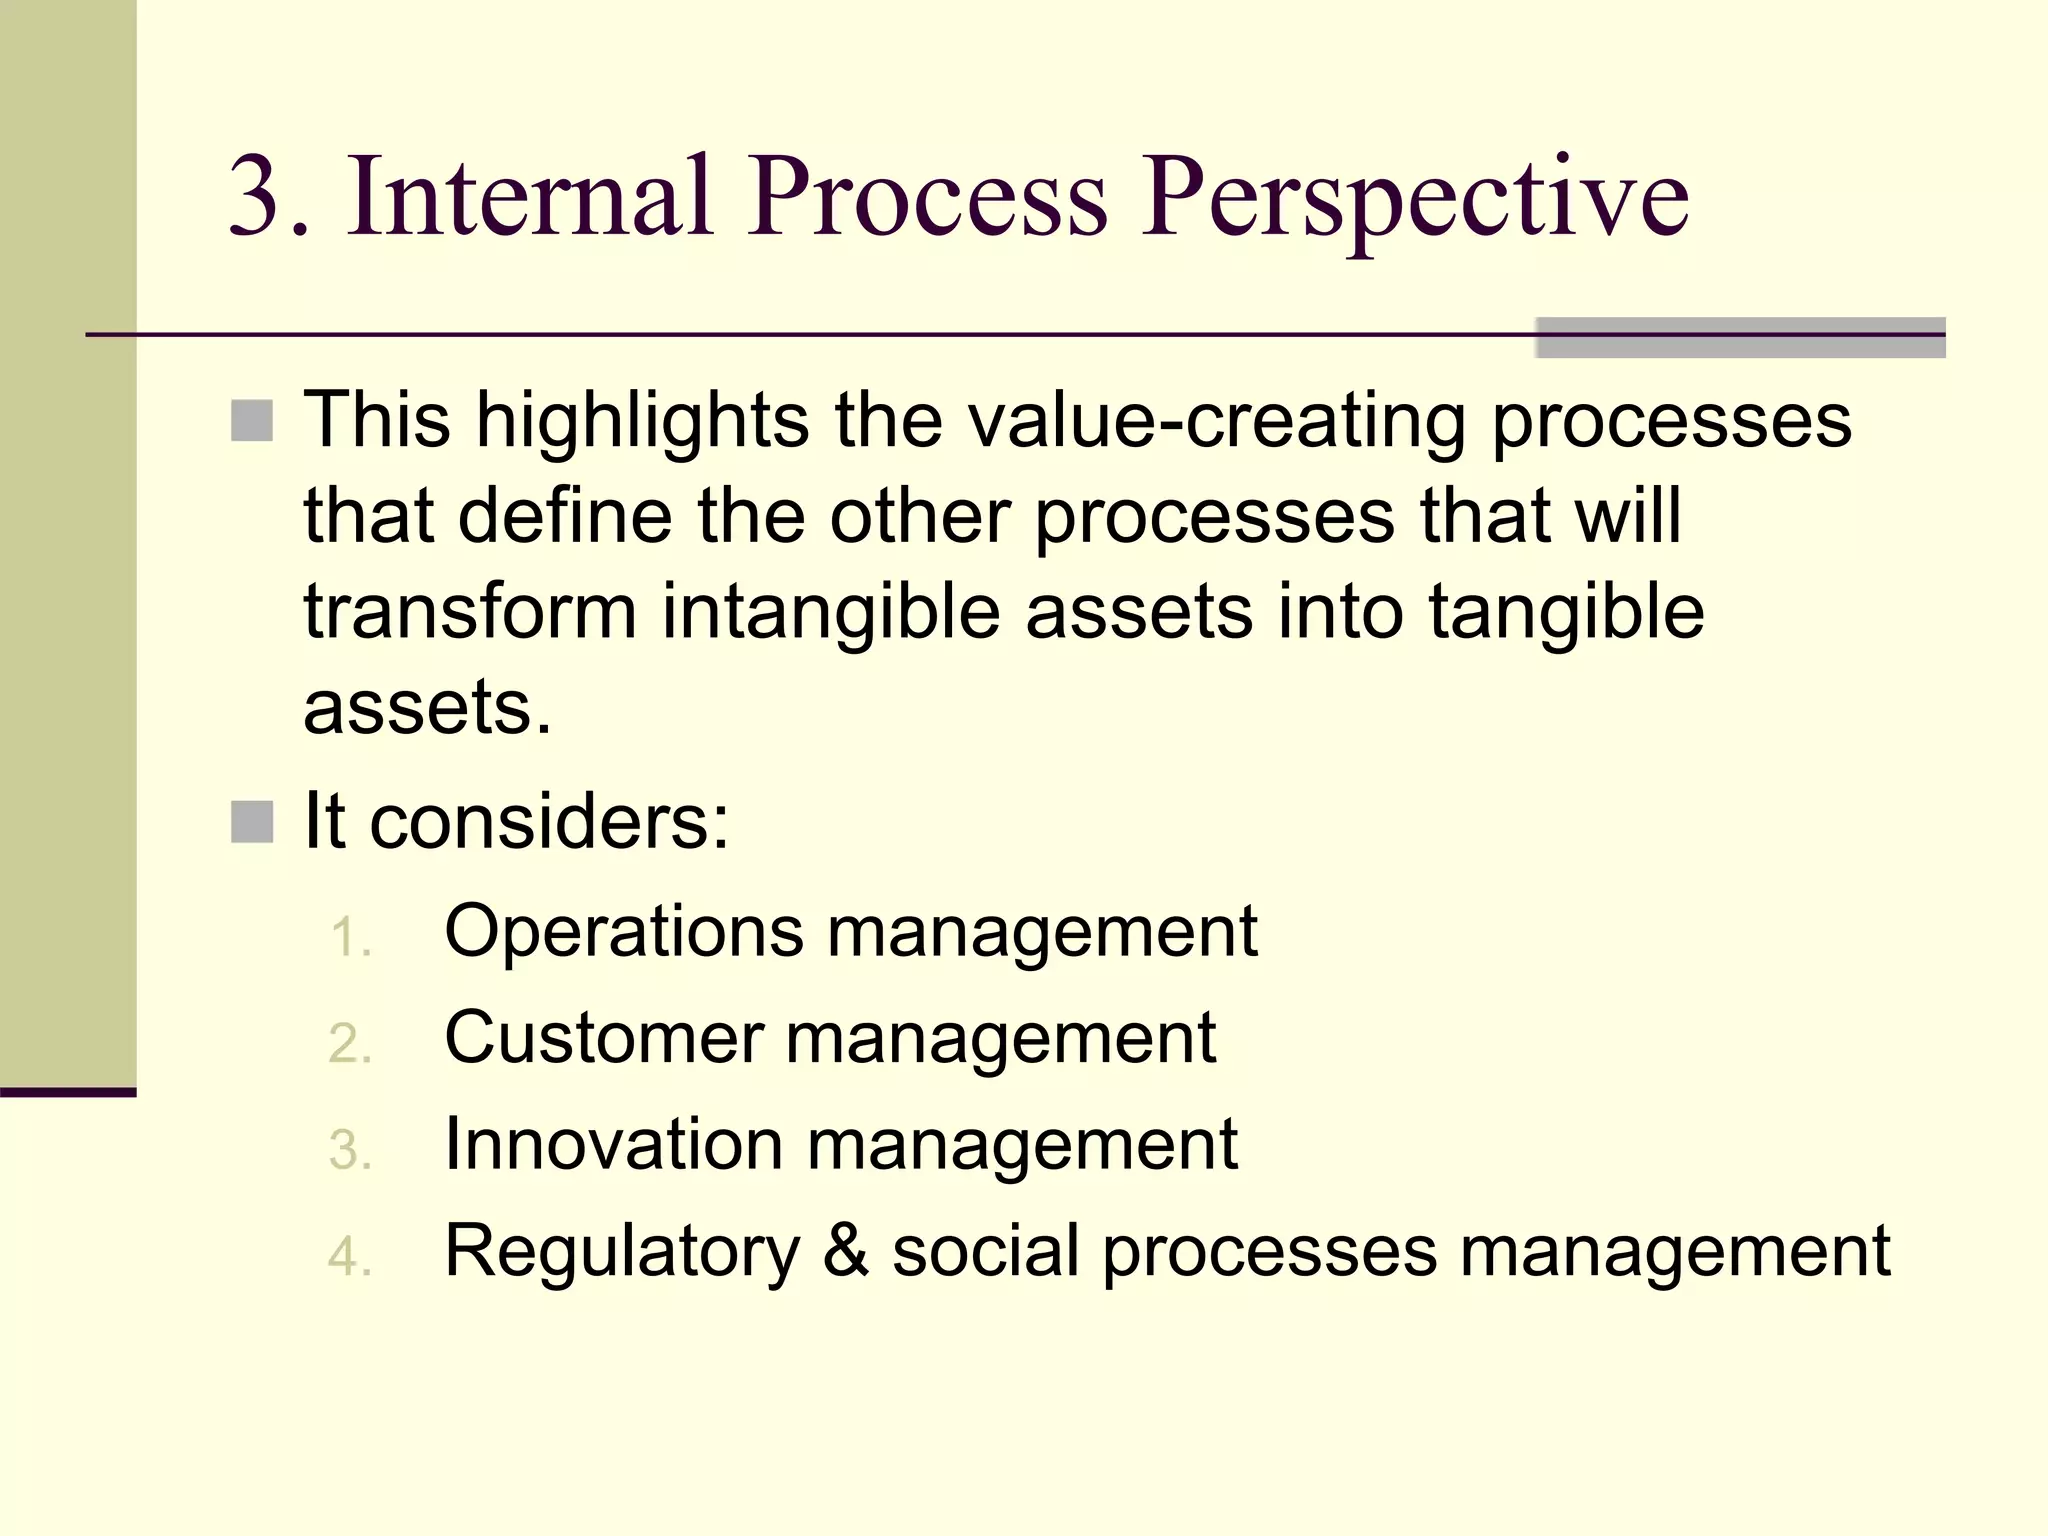
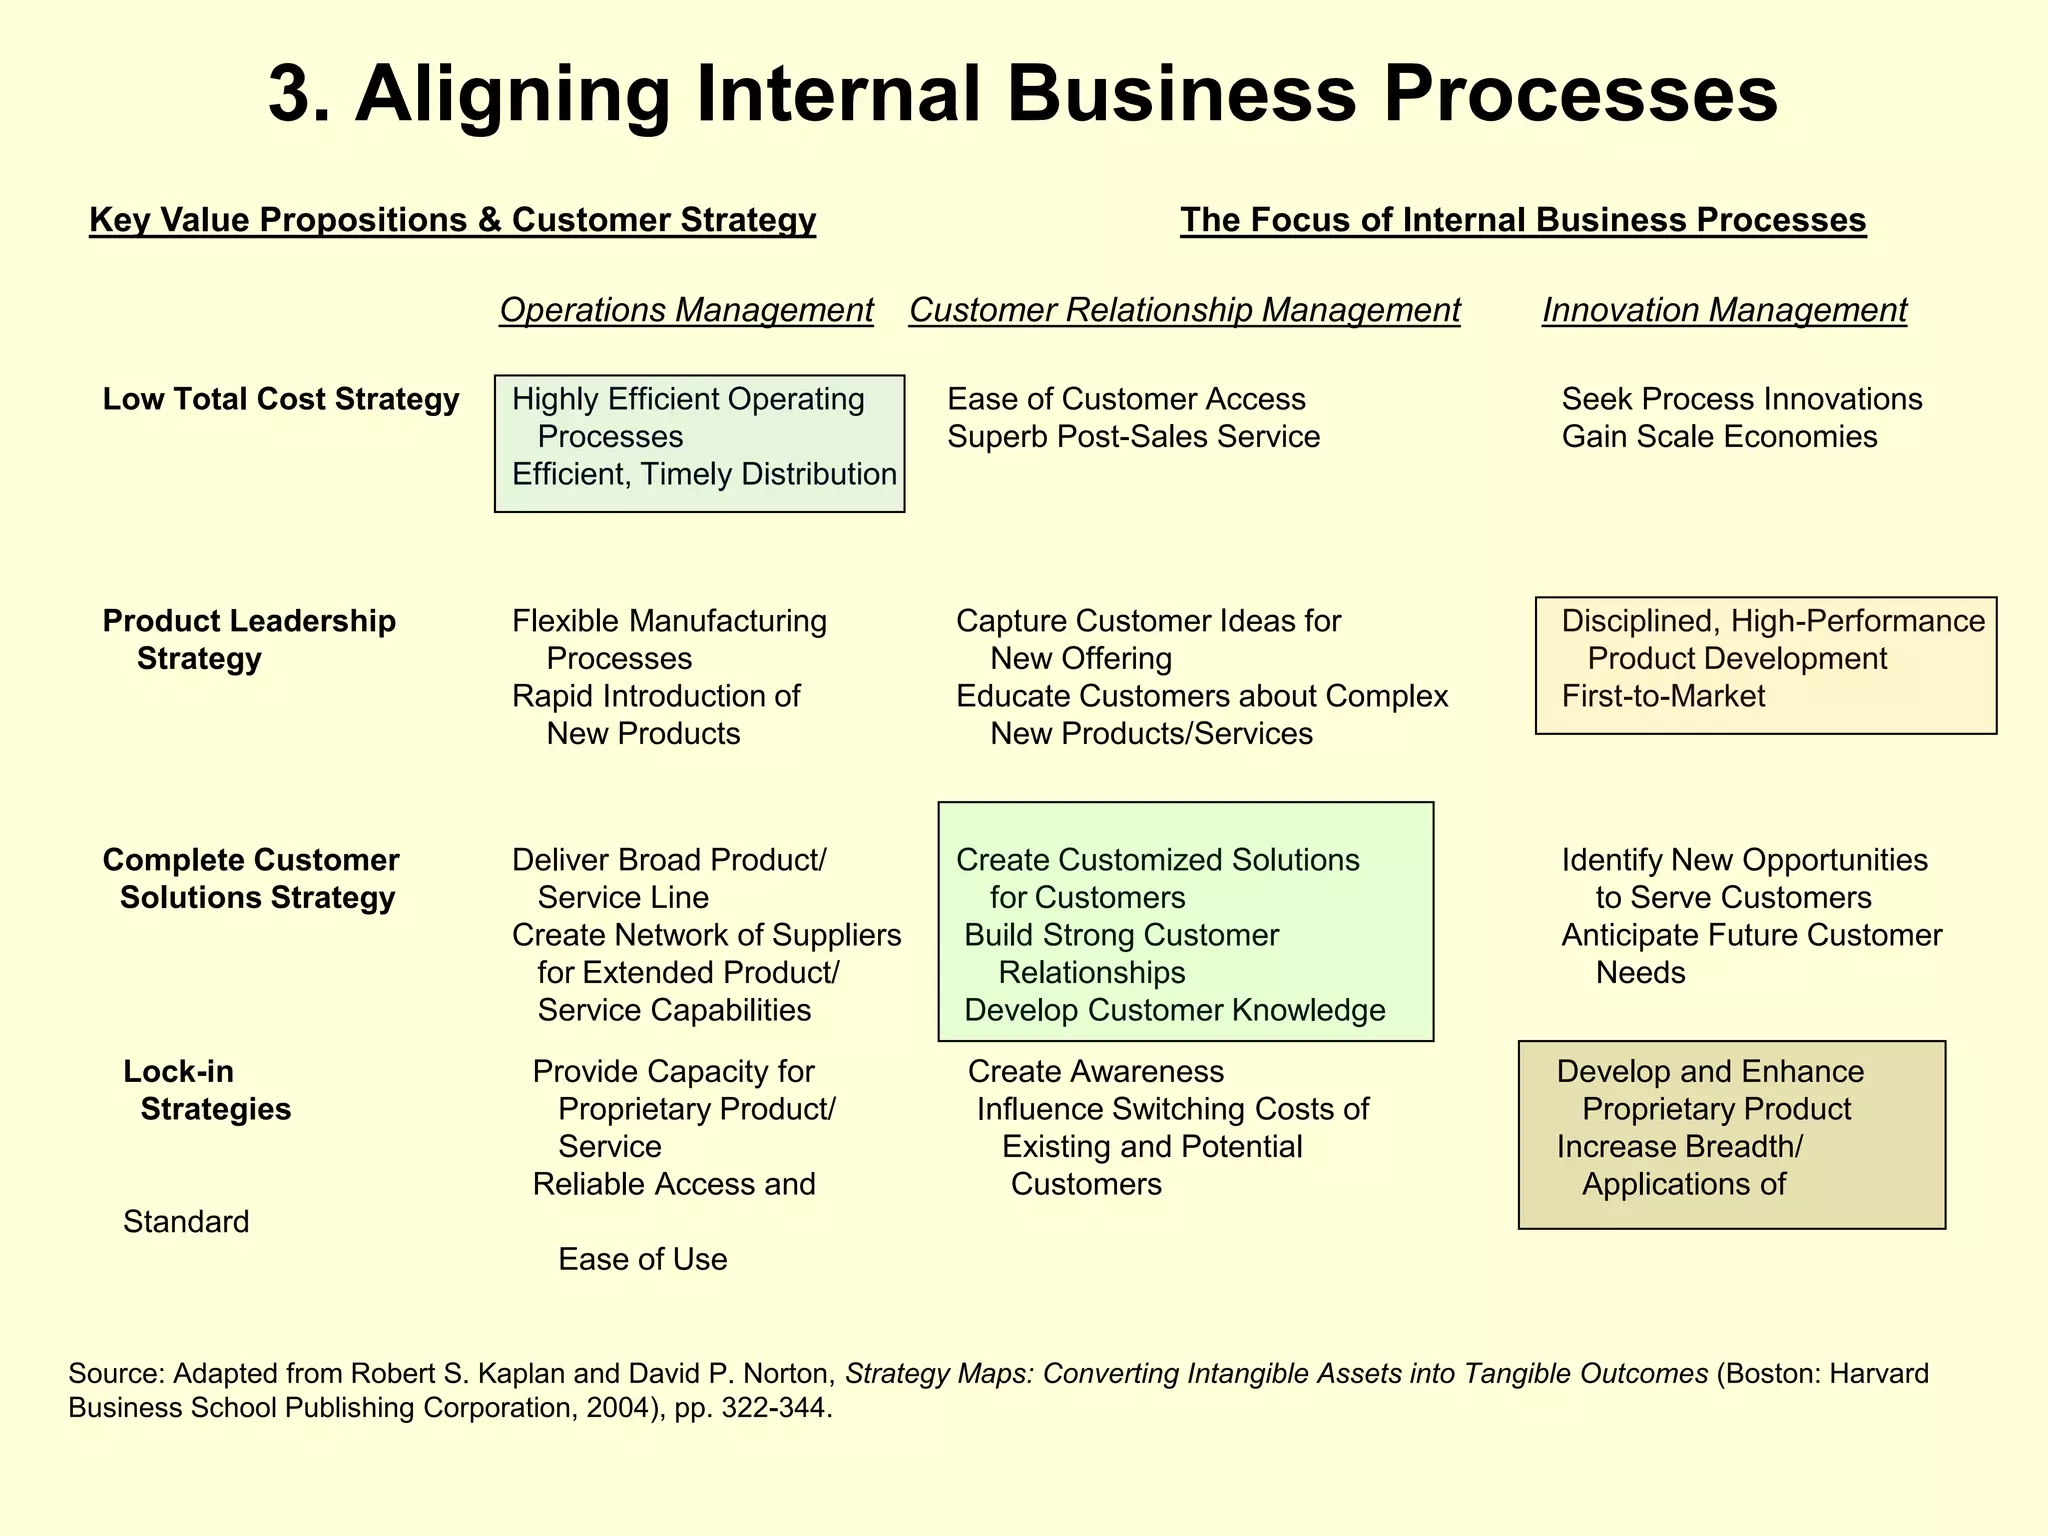
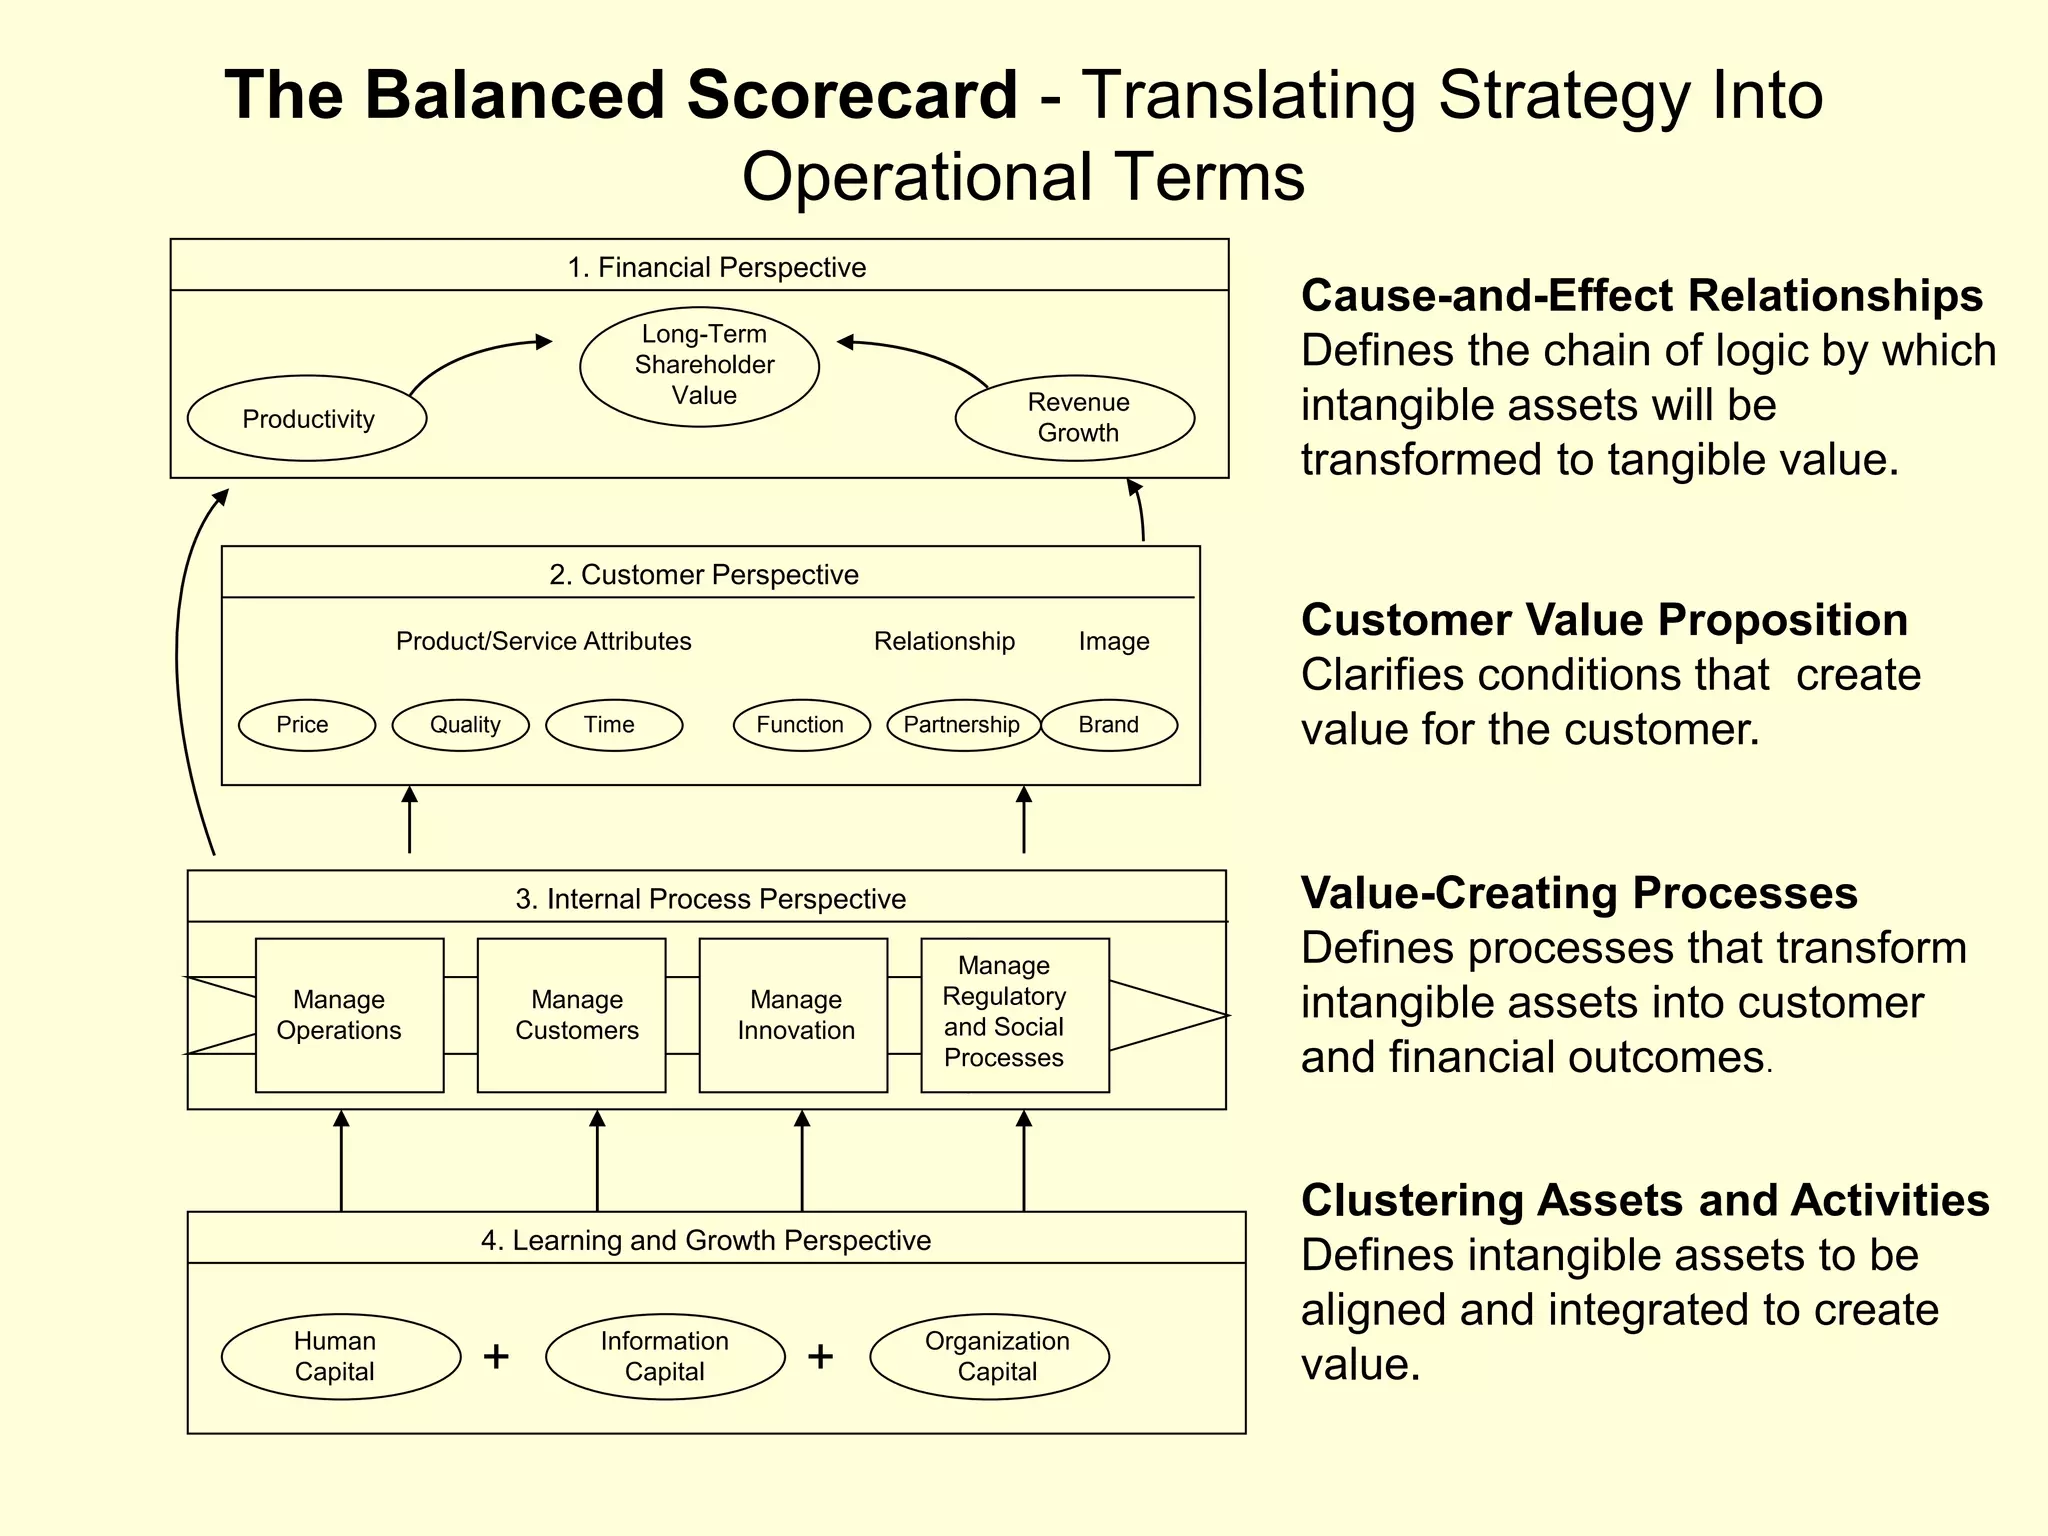
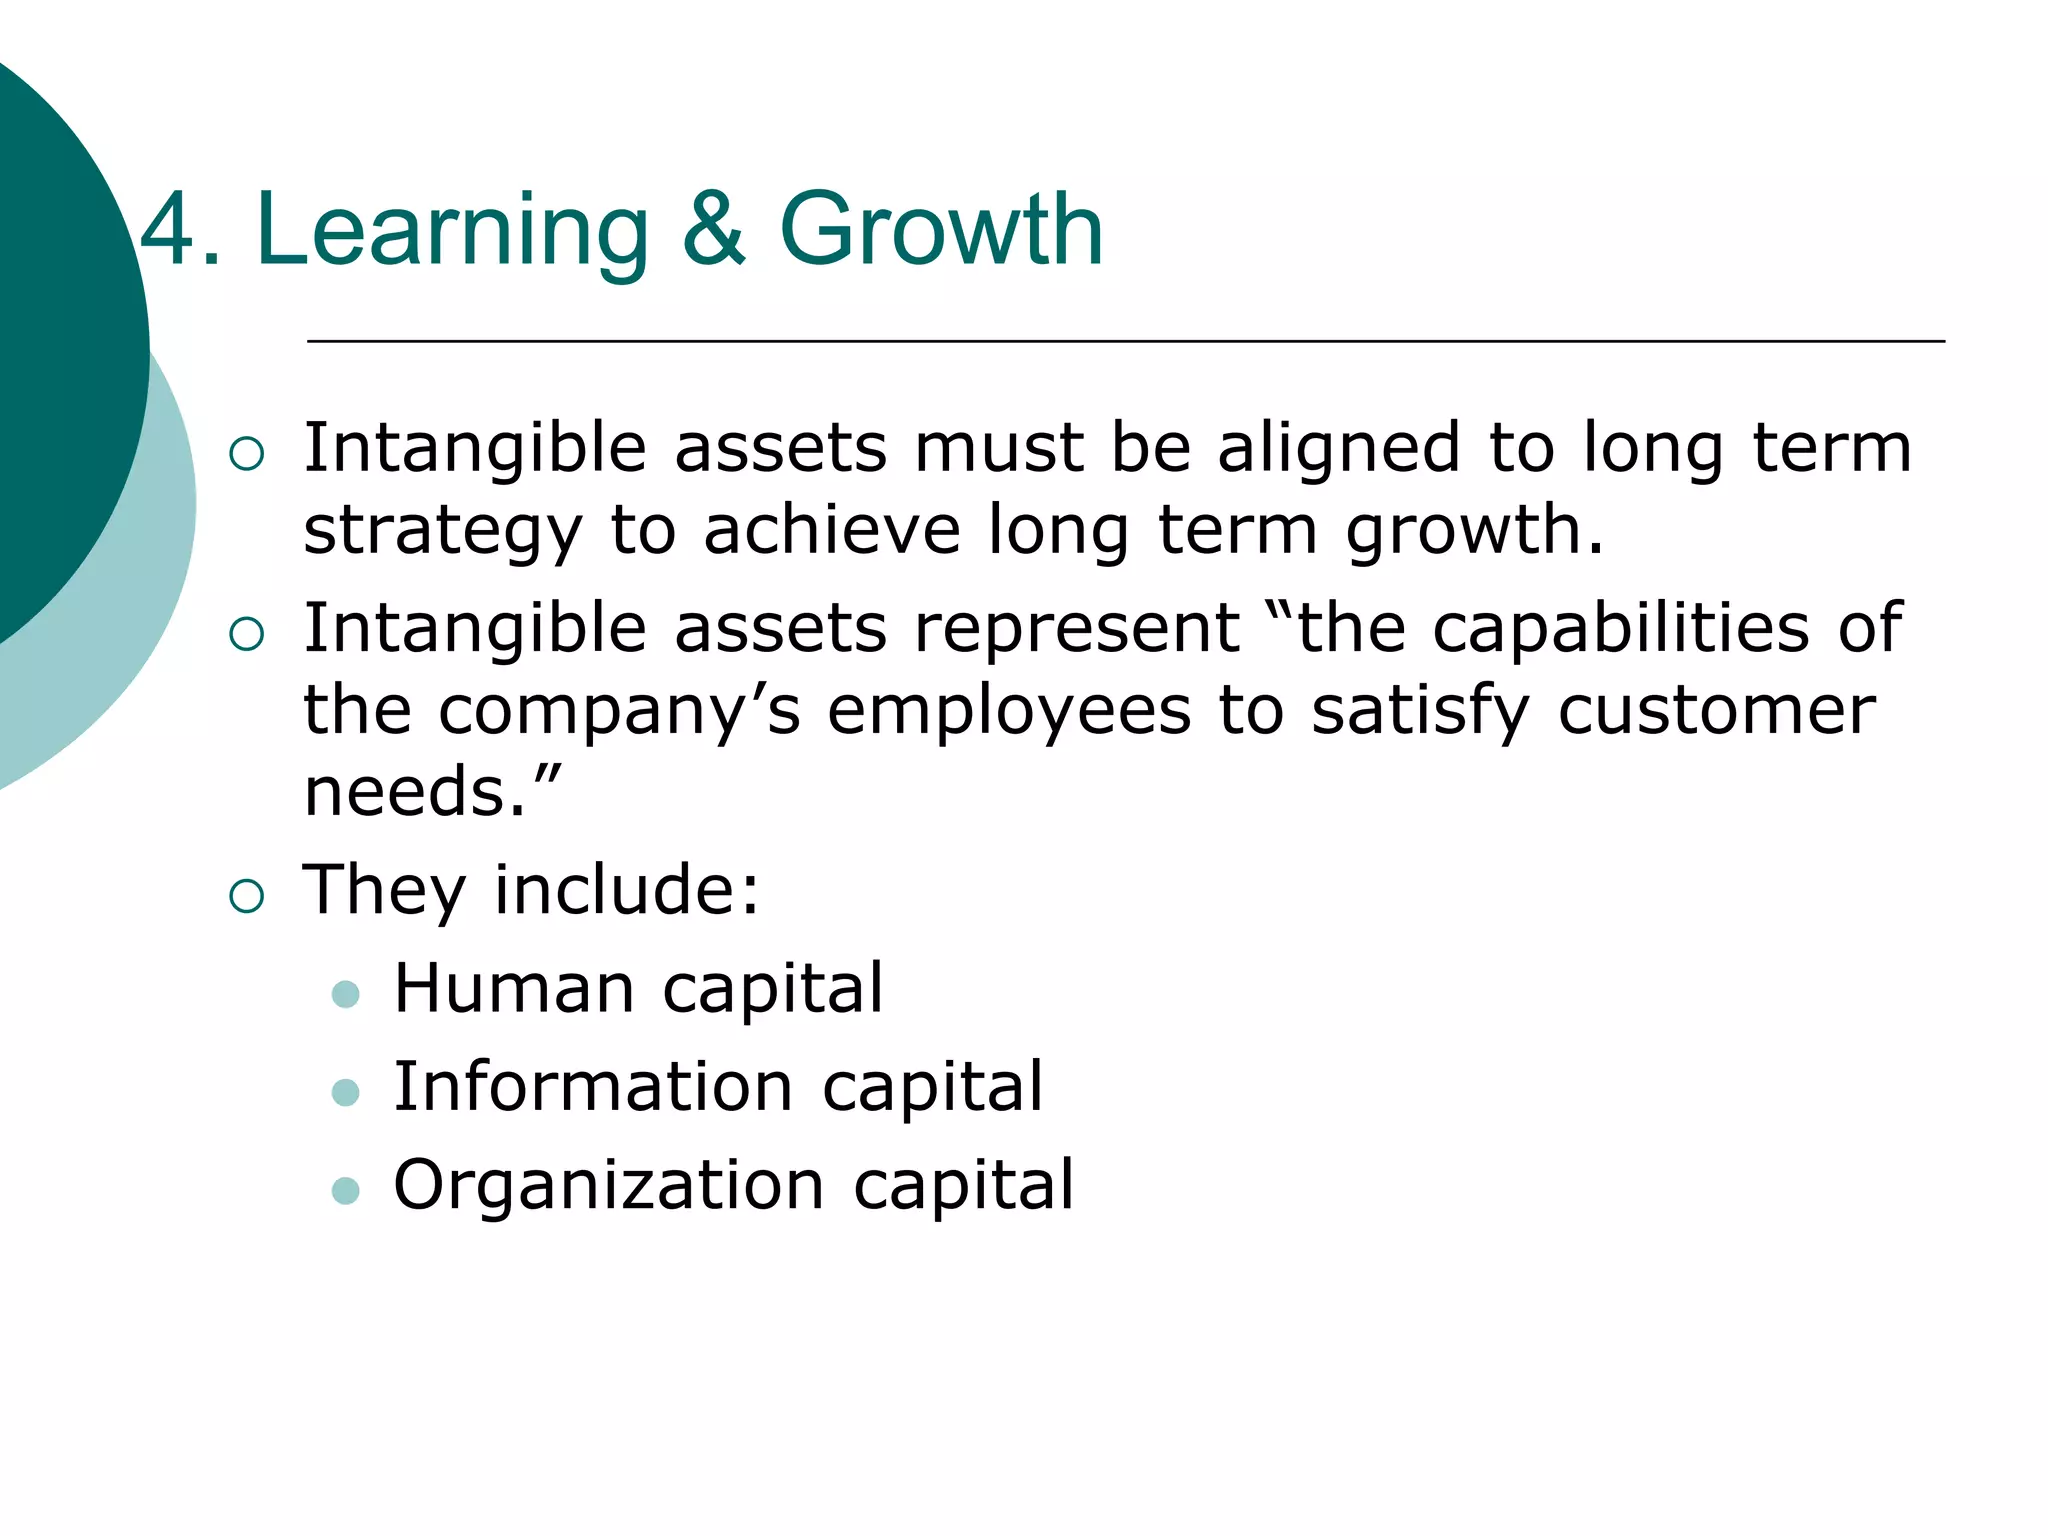
Download to read offline
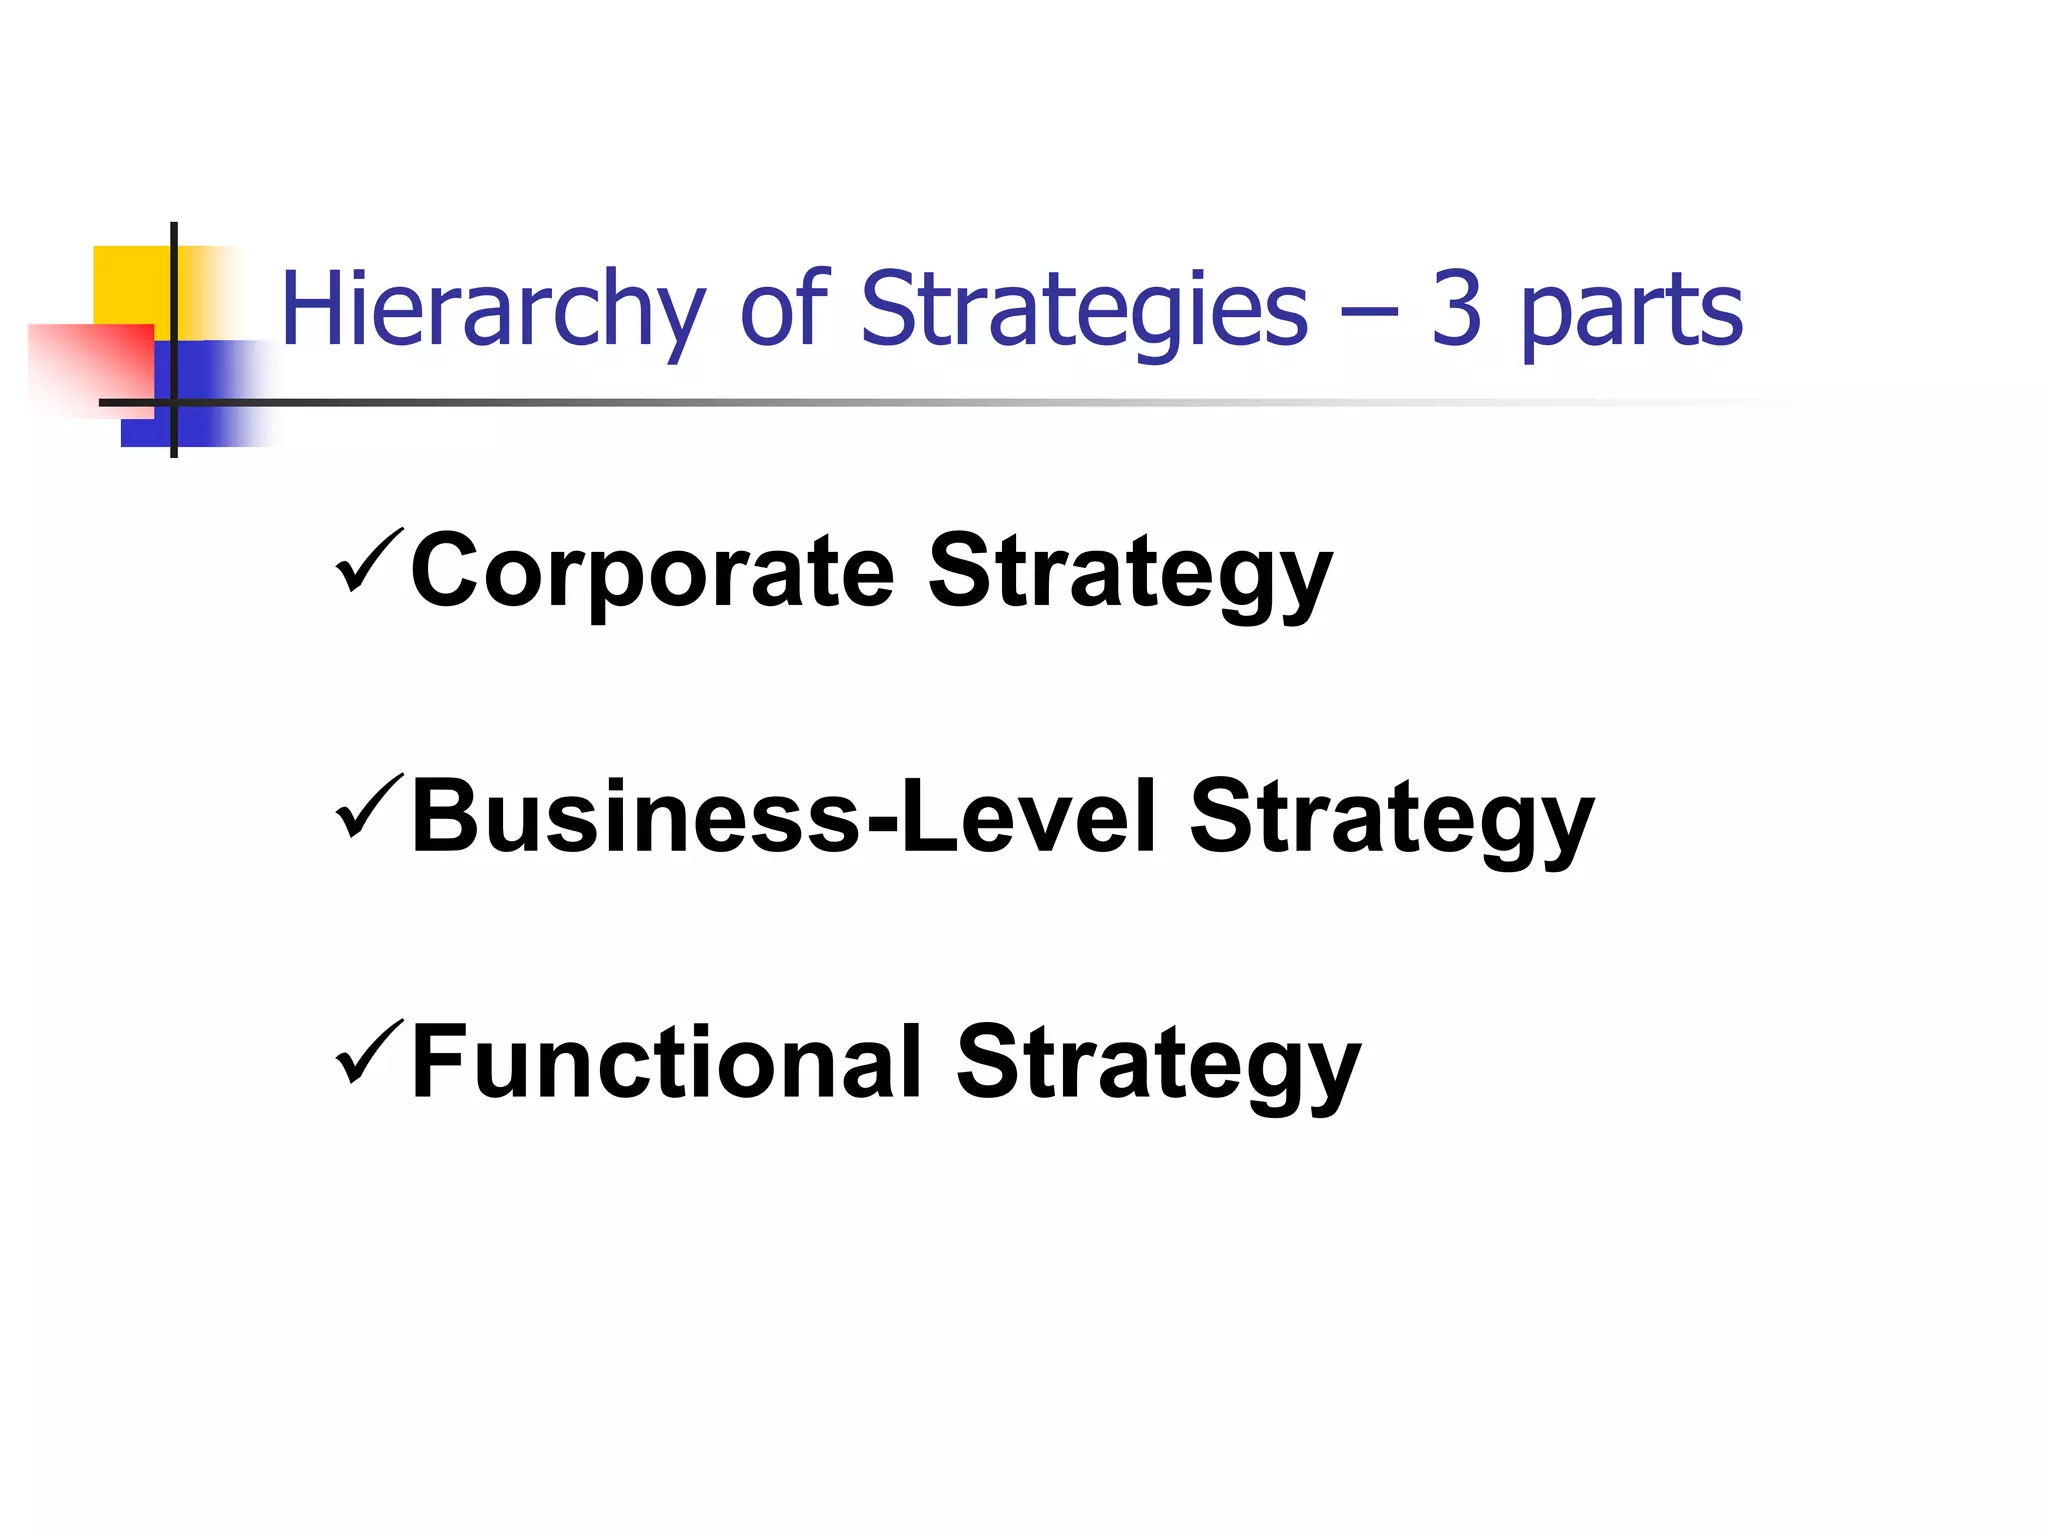
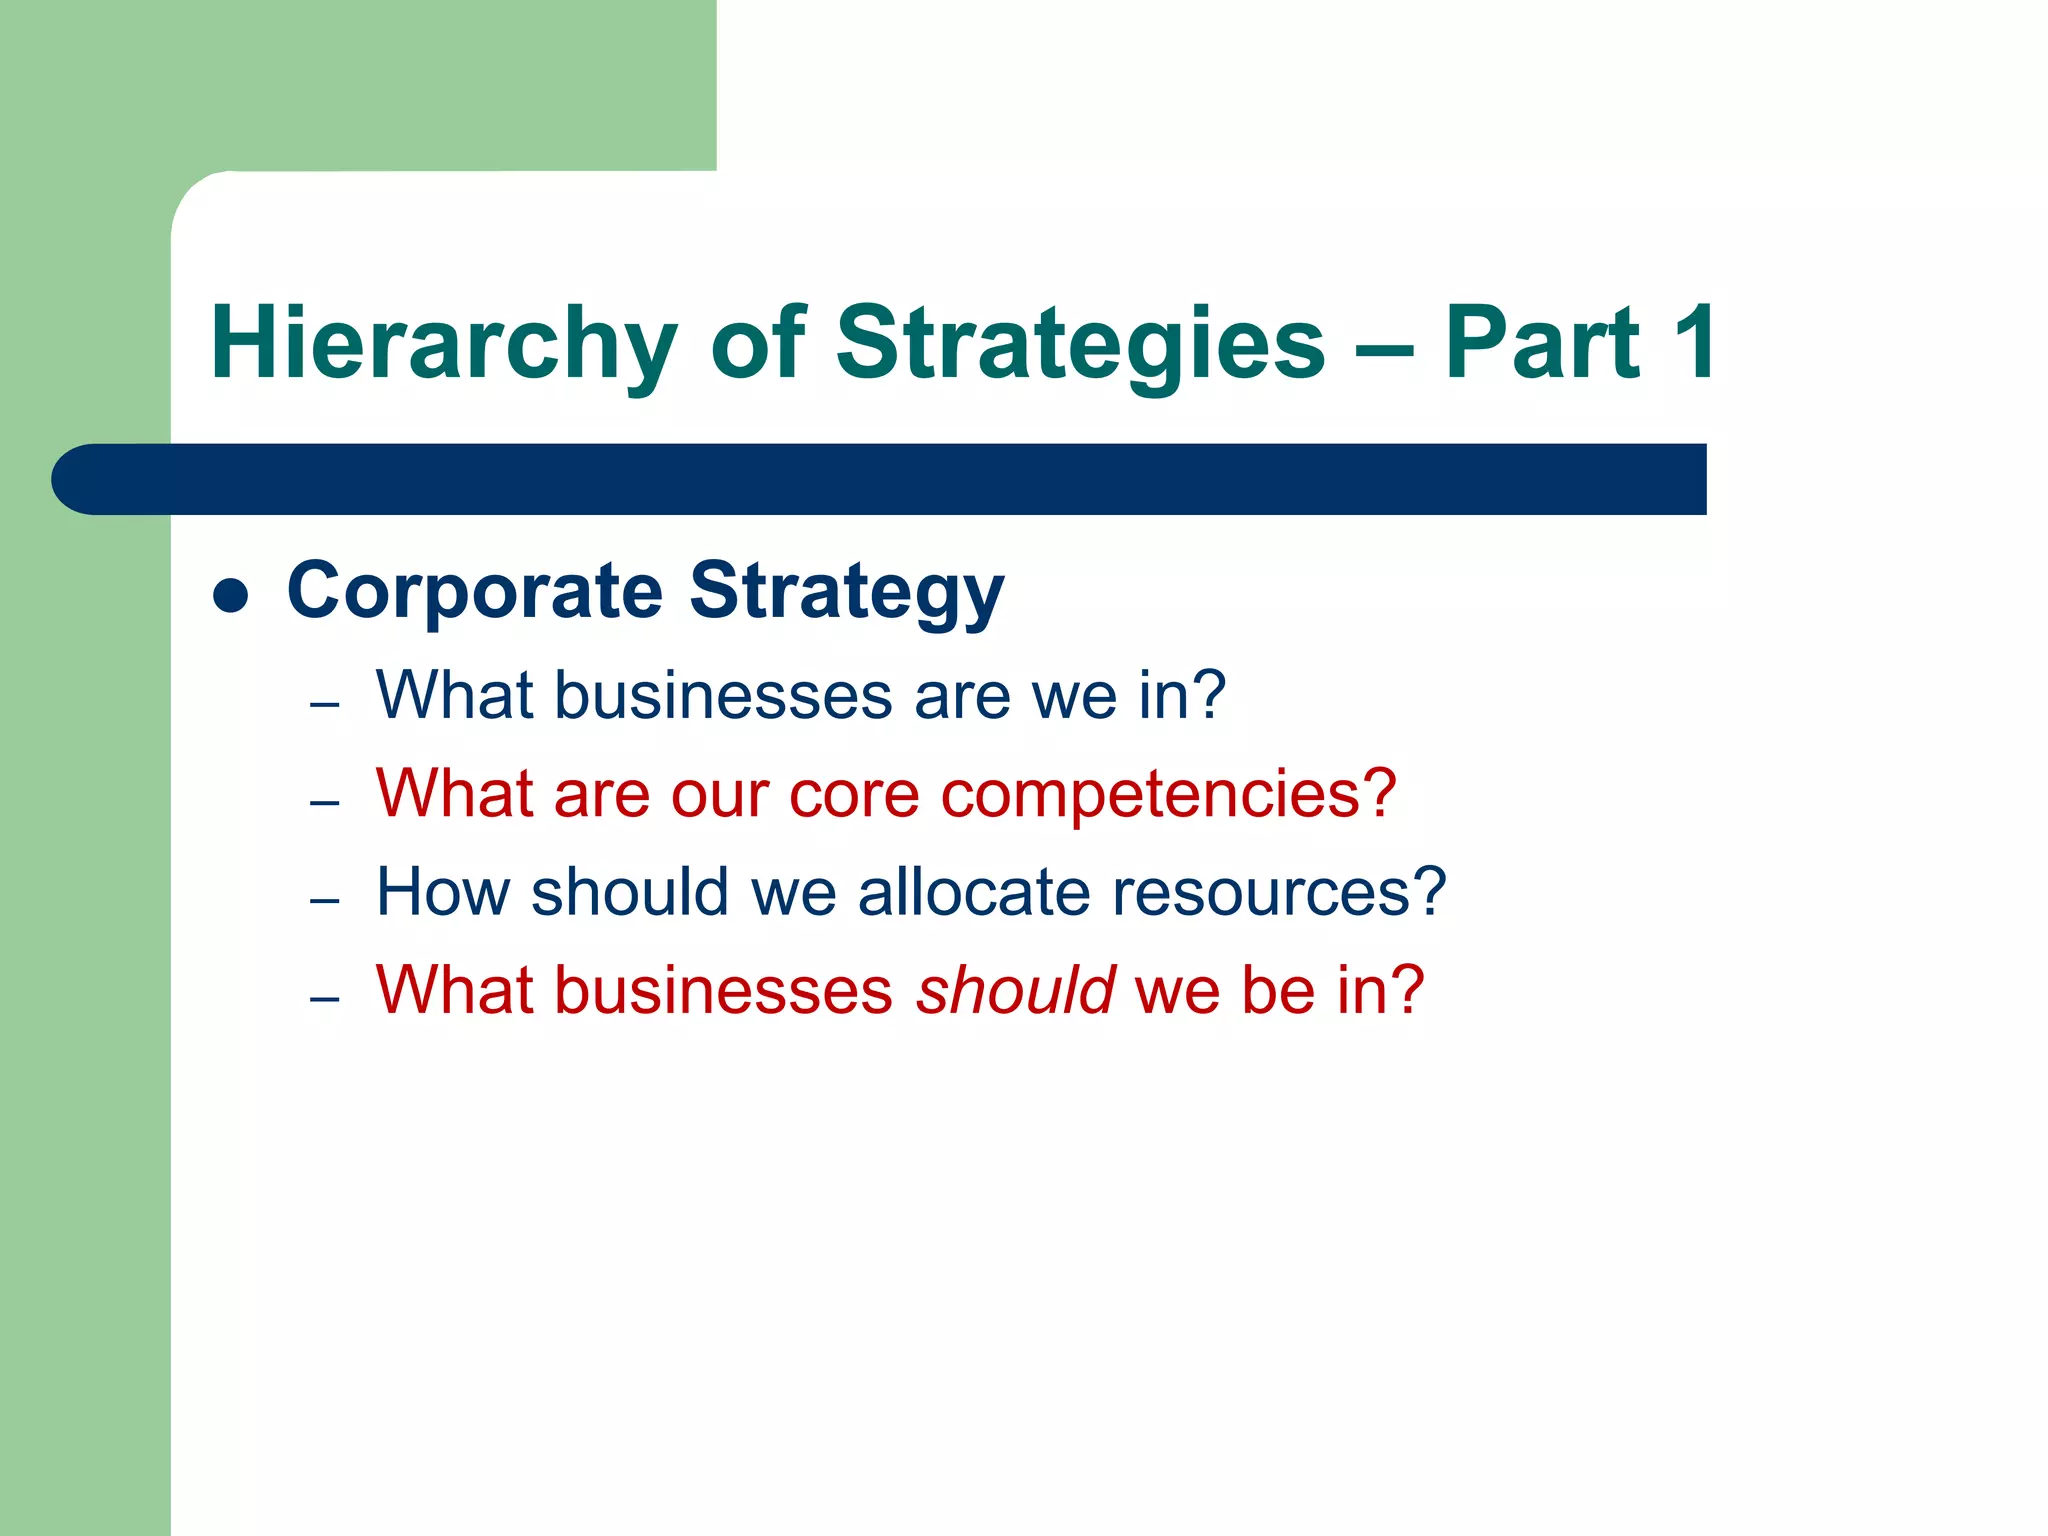
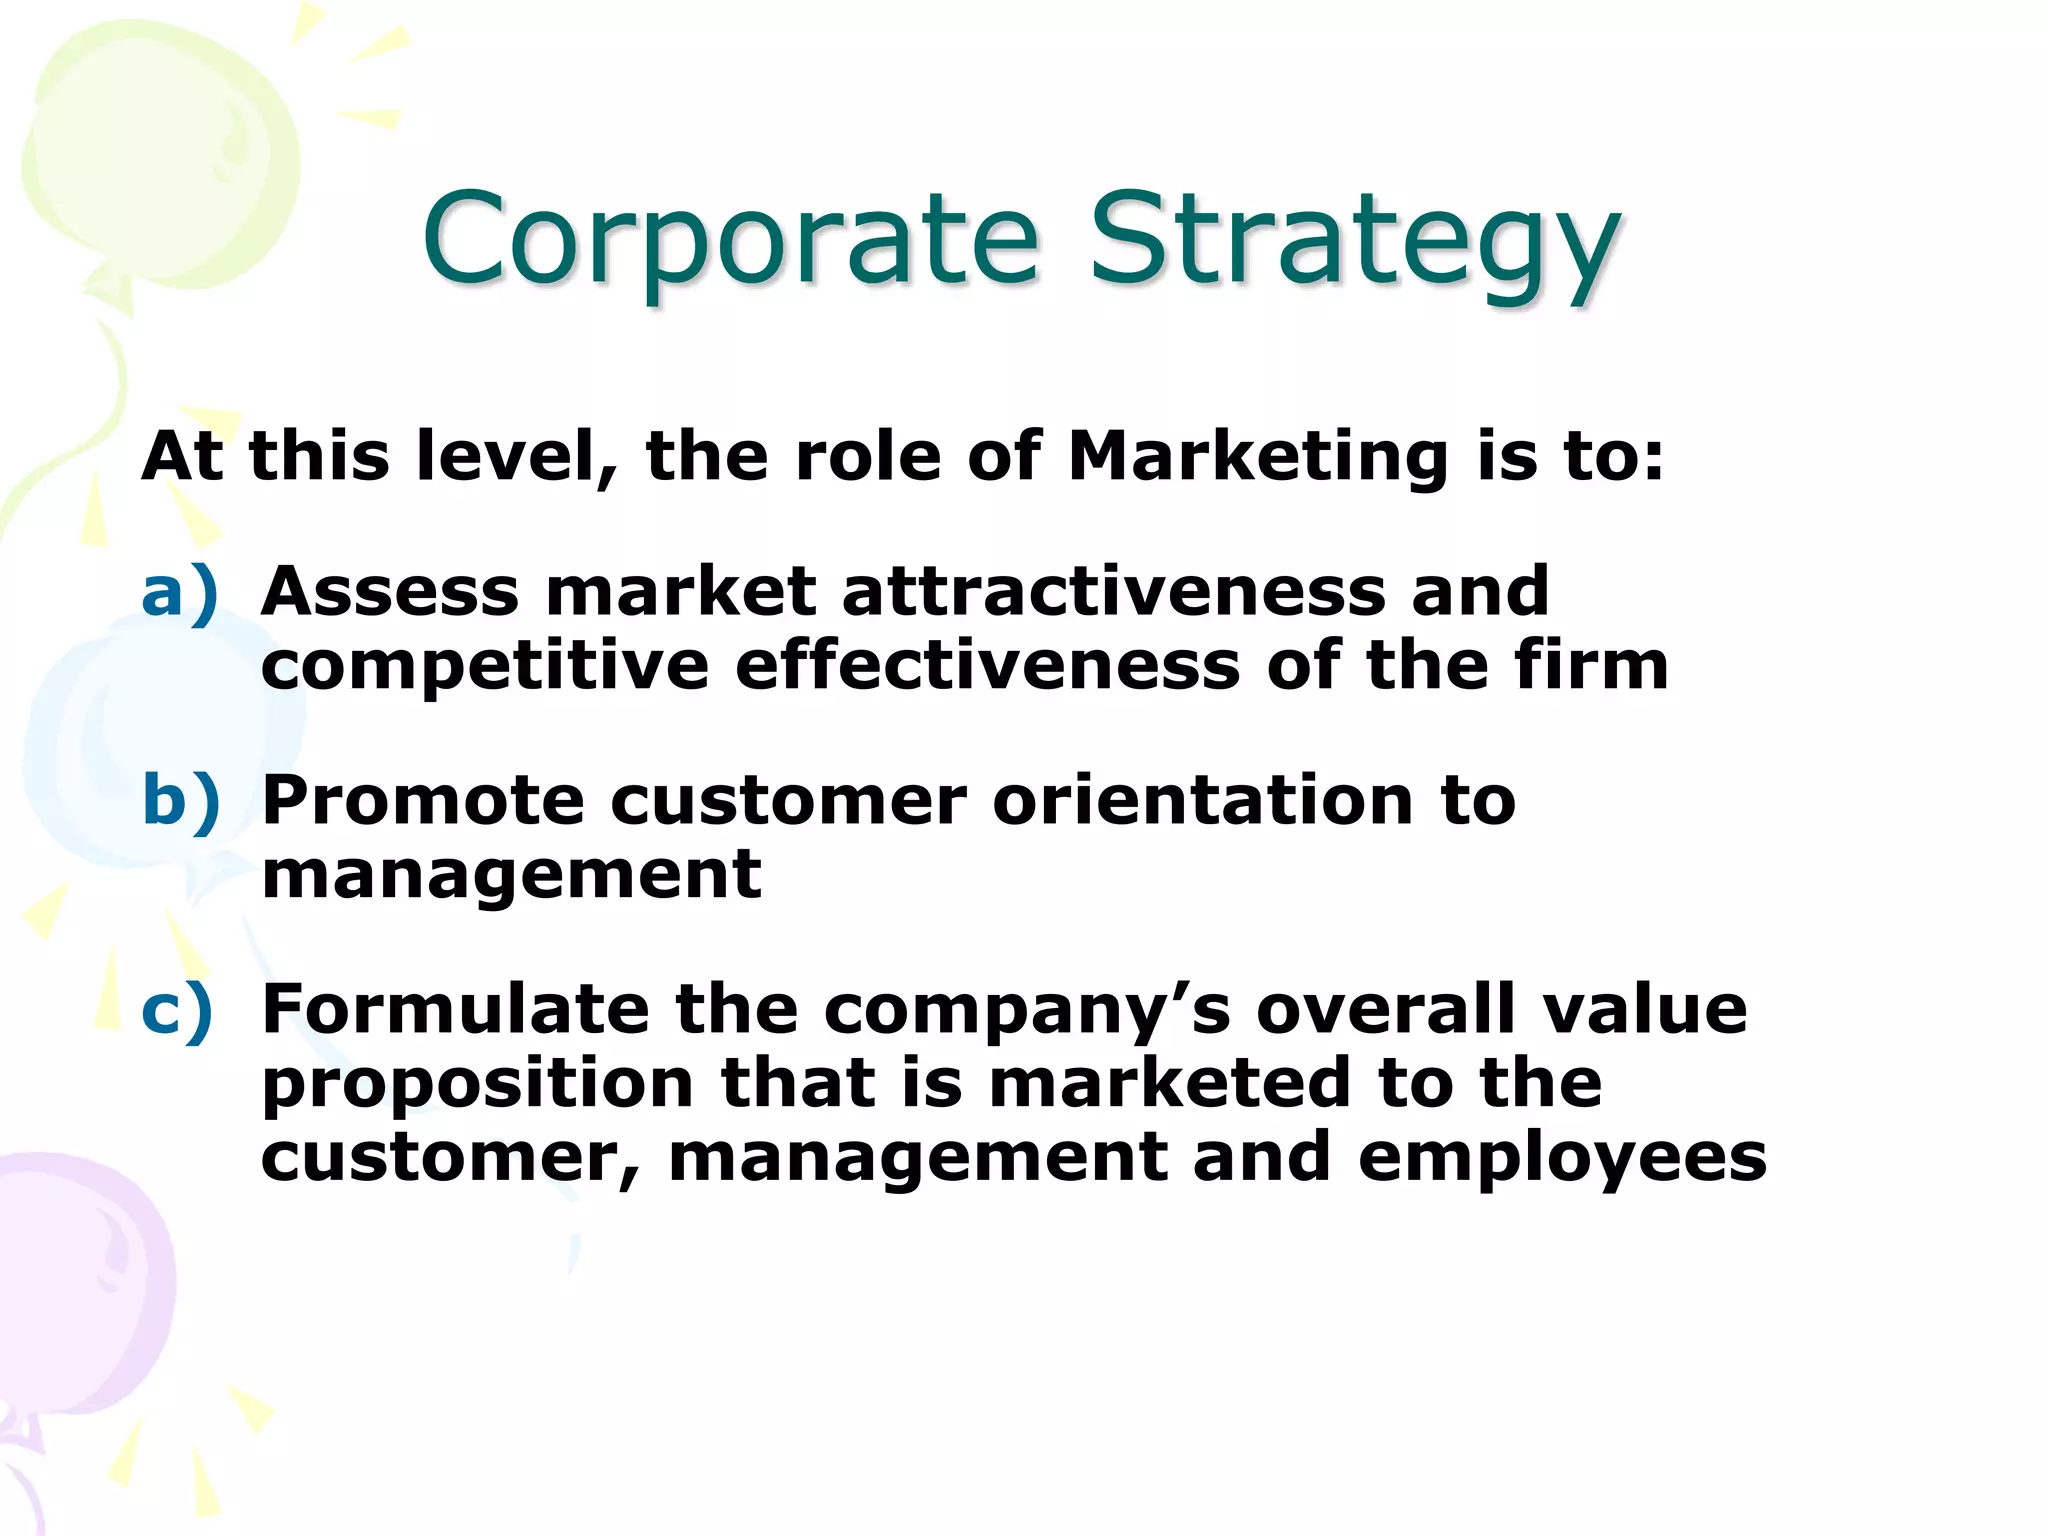
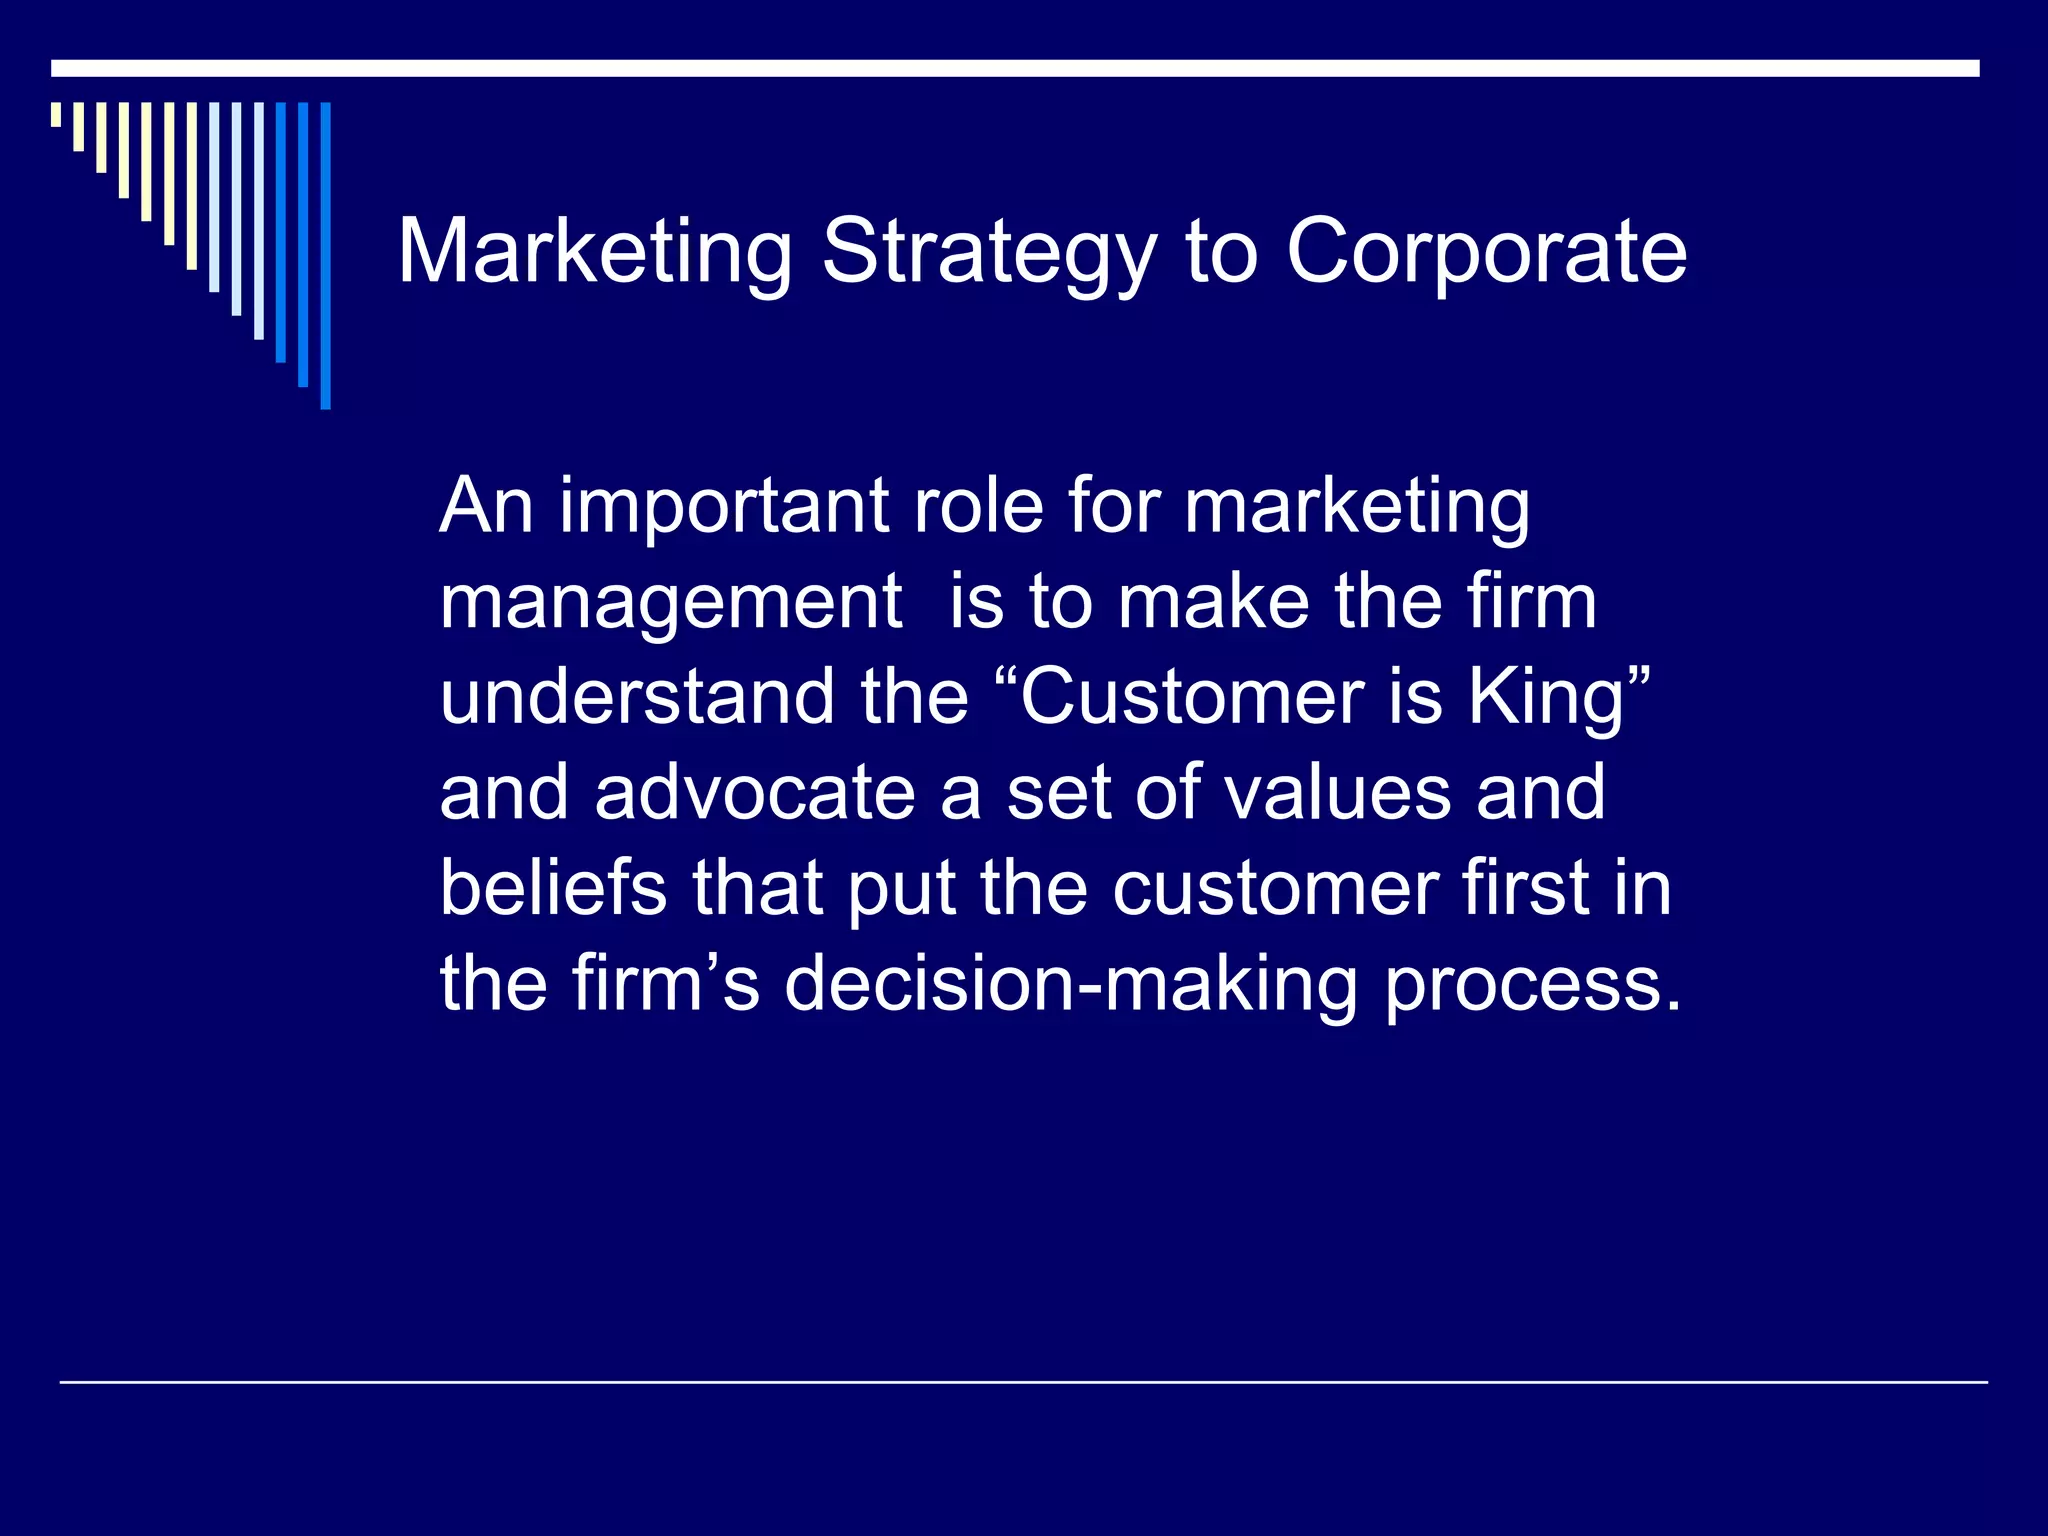

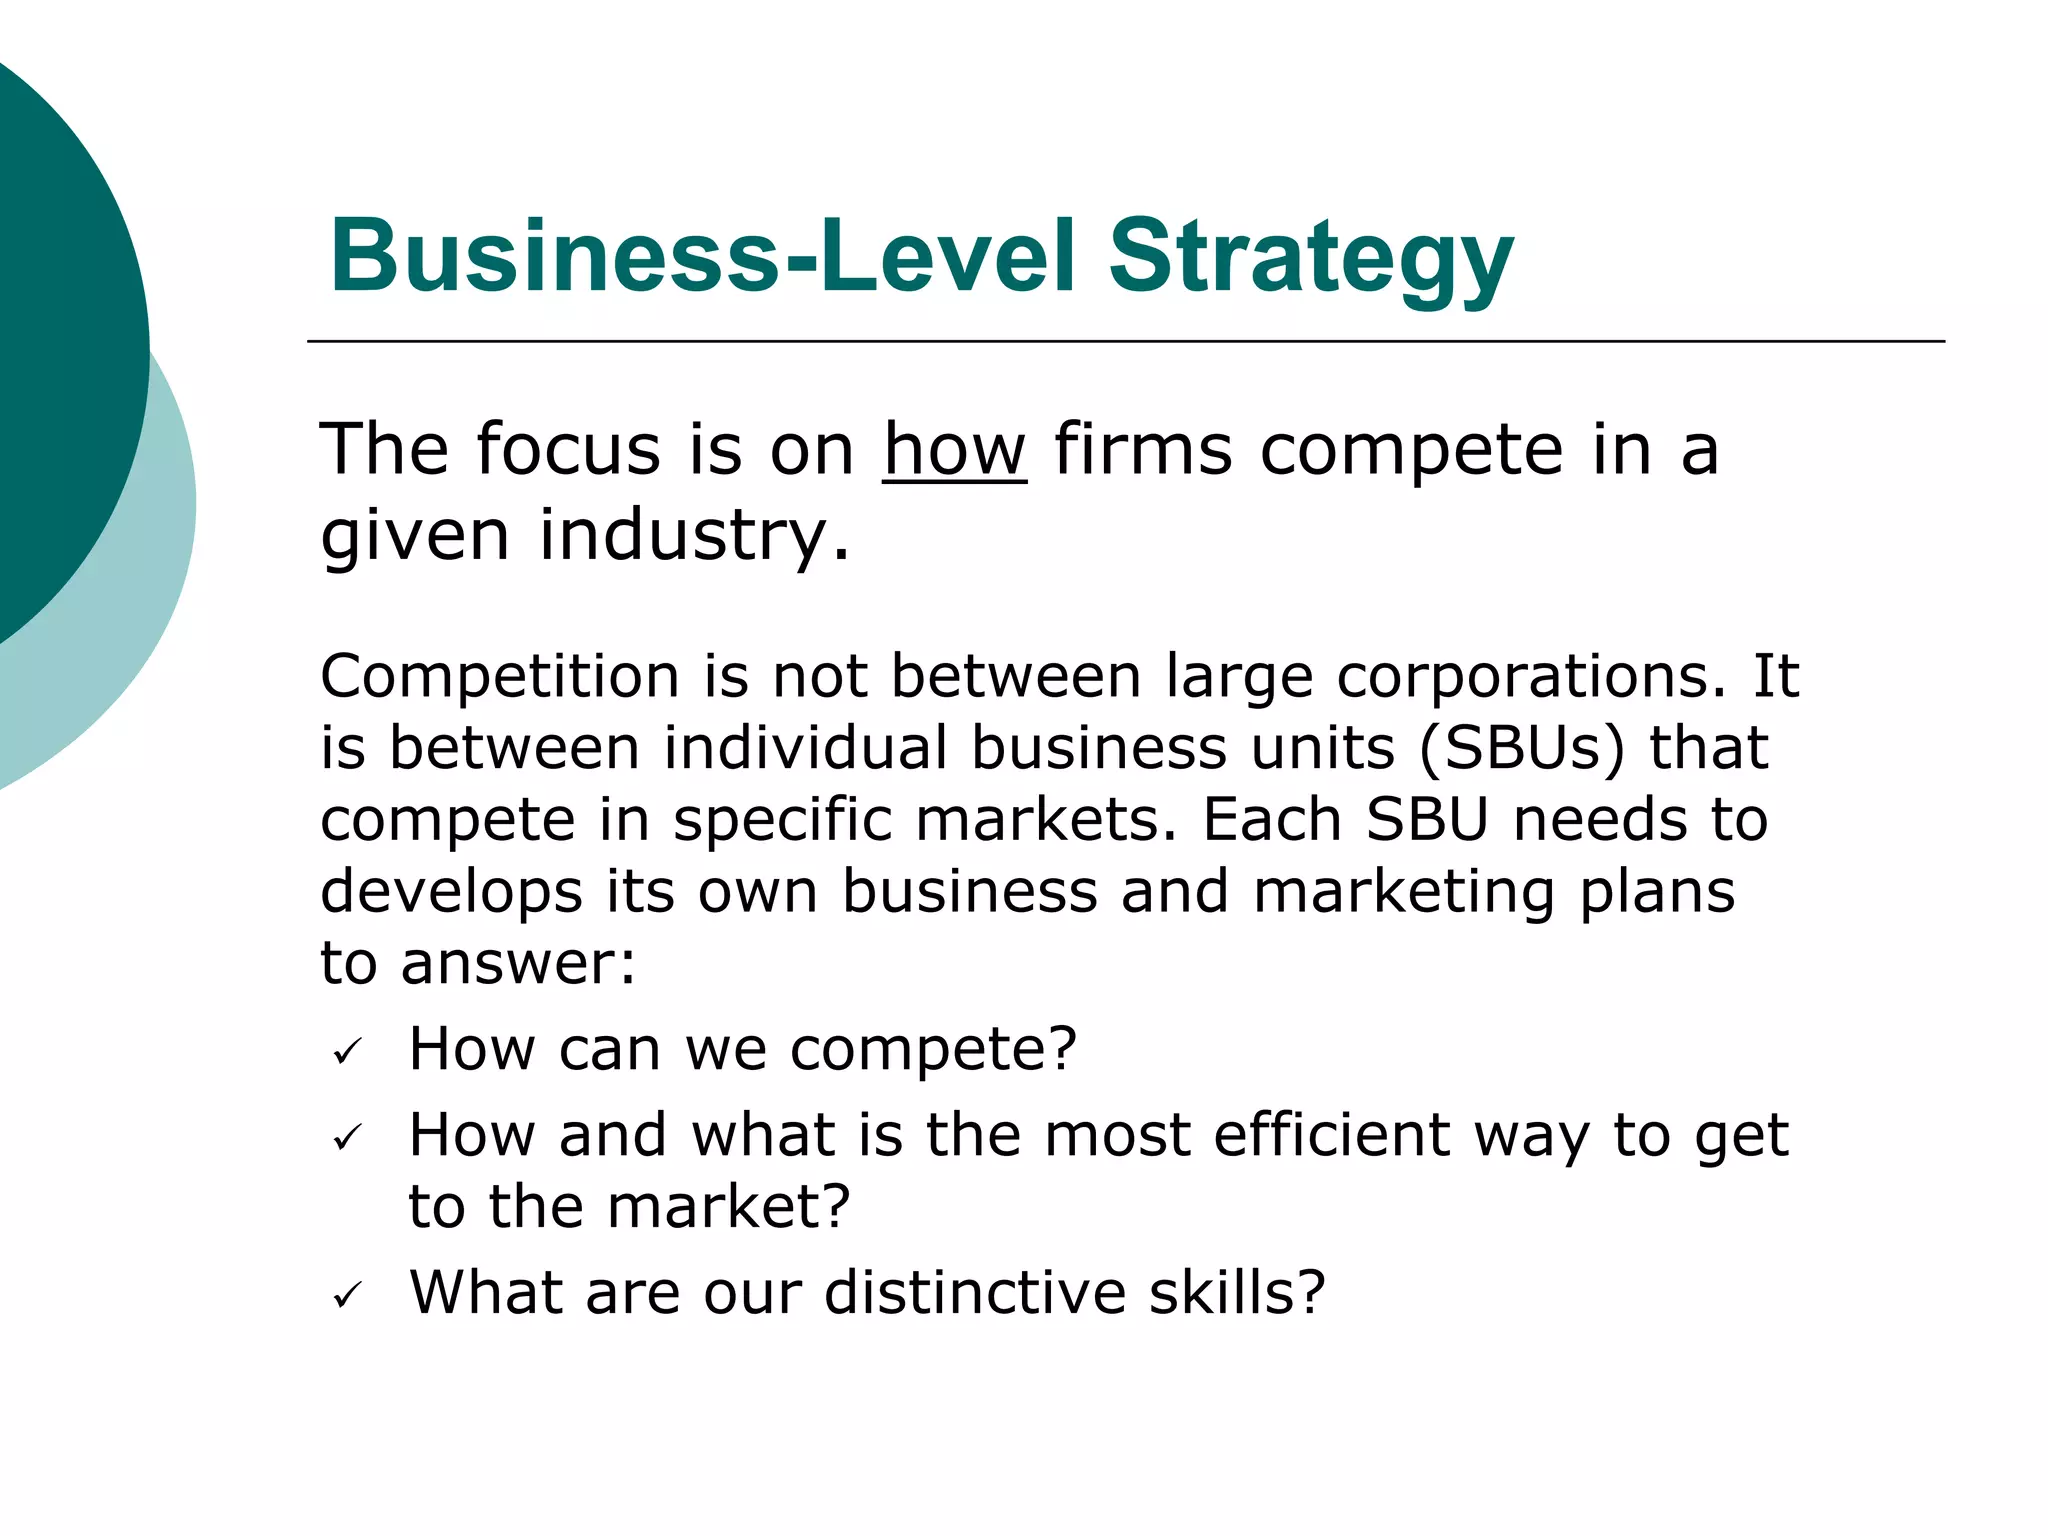

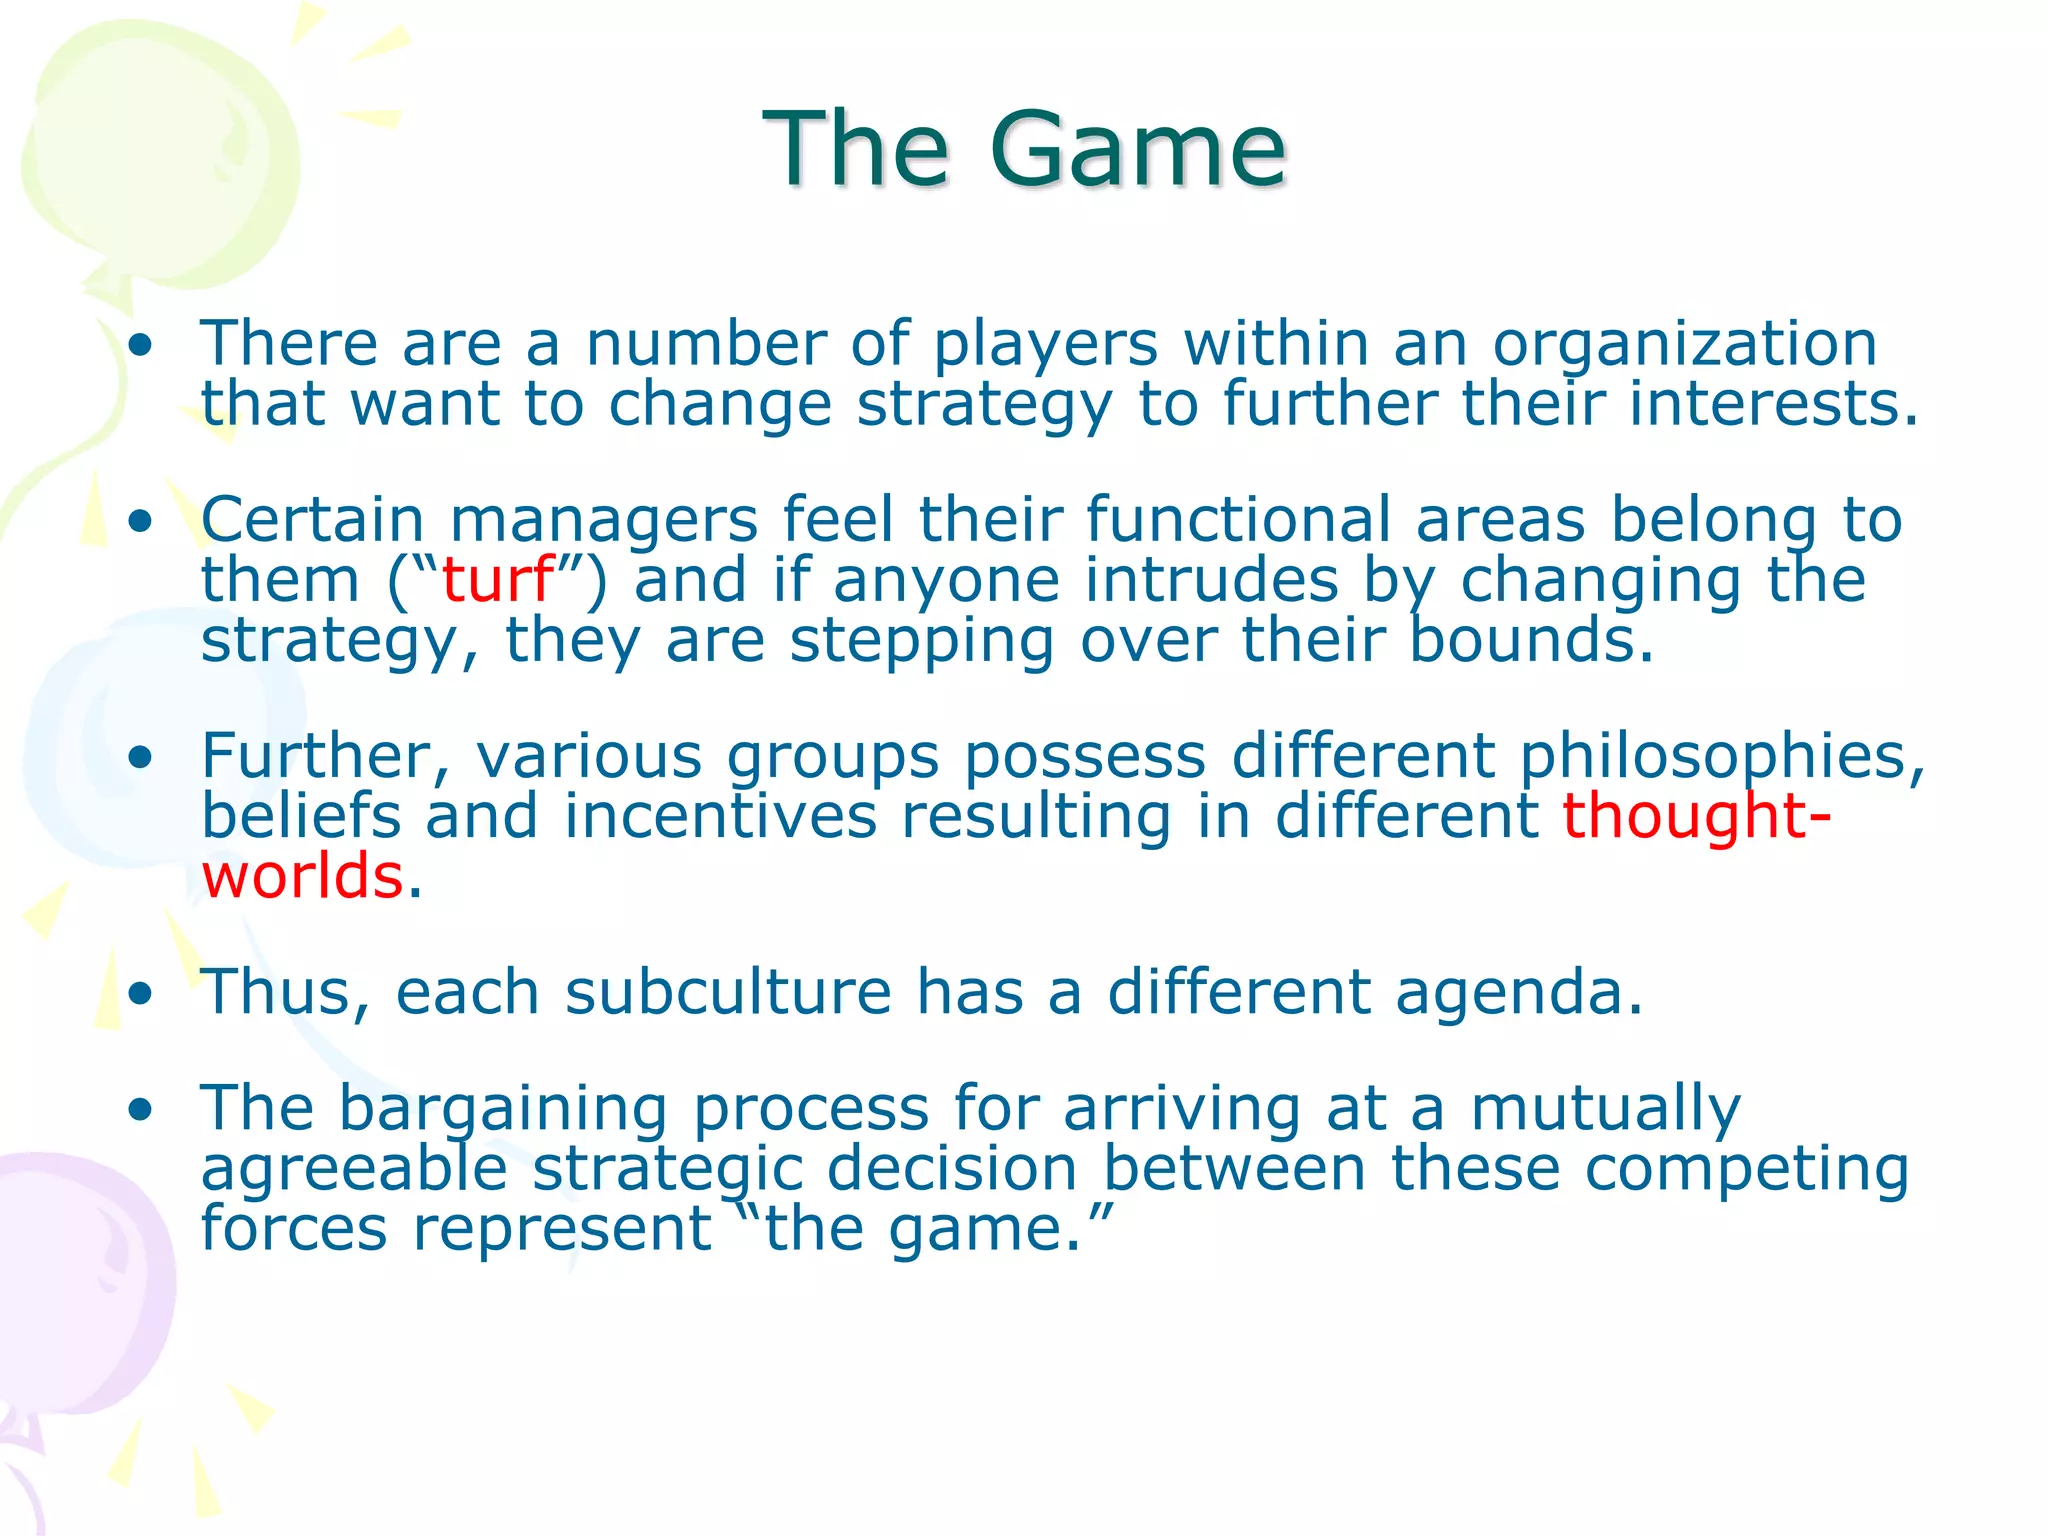
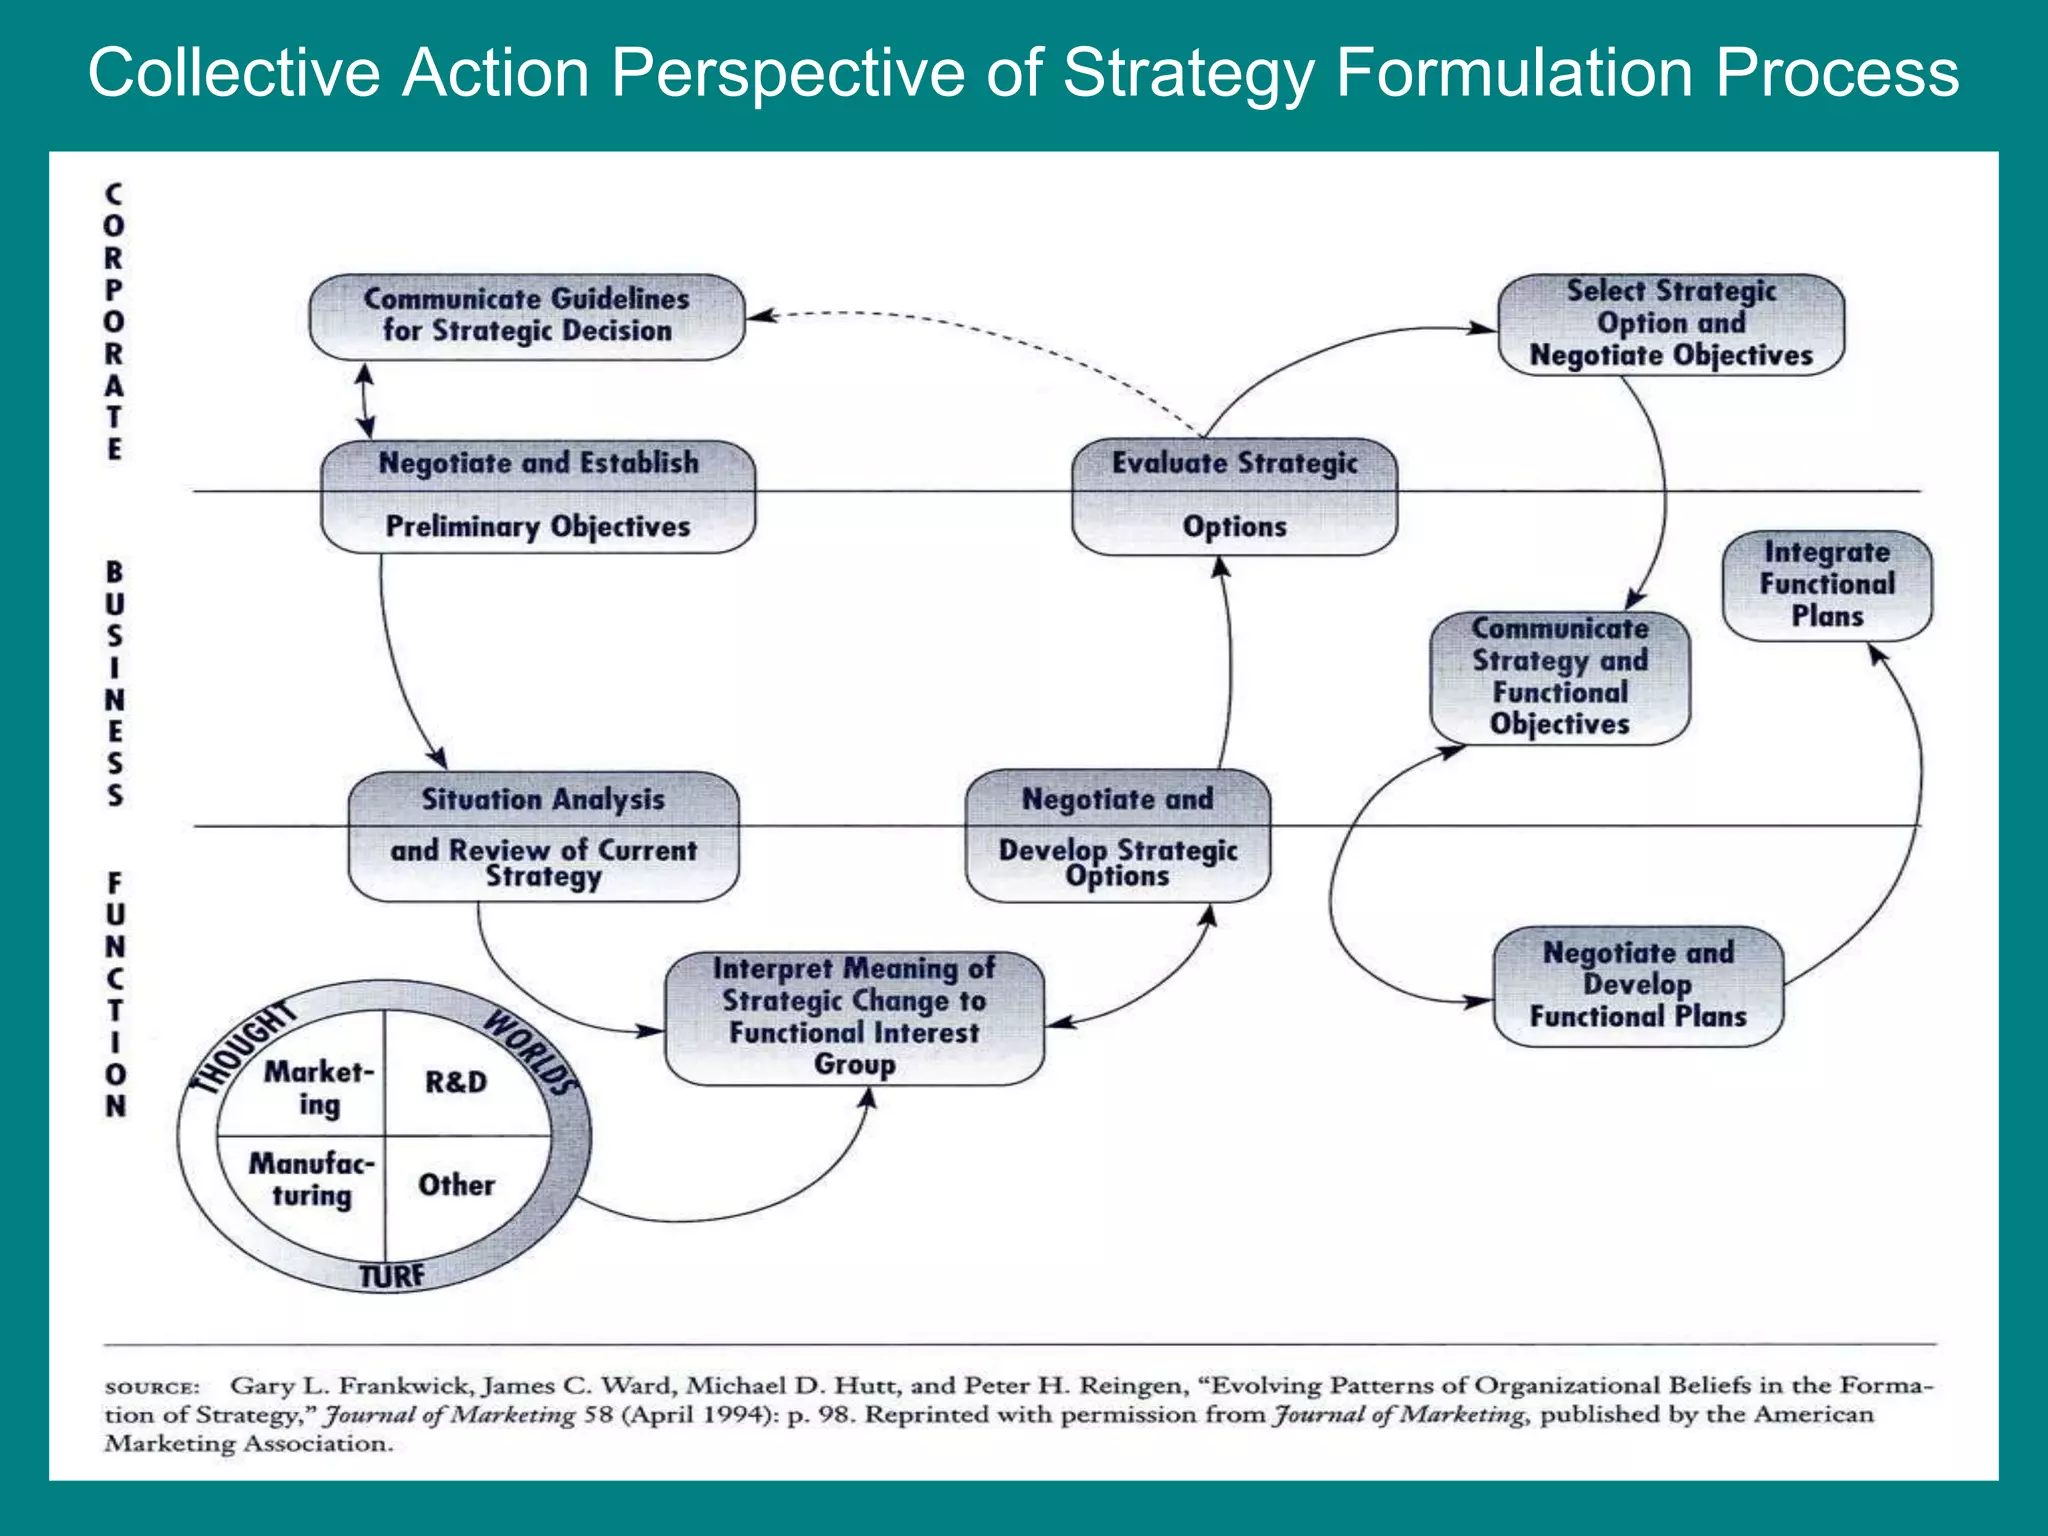
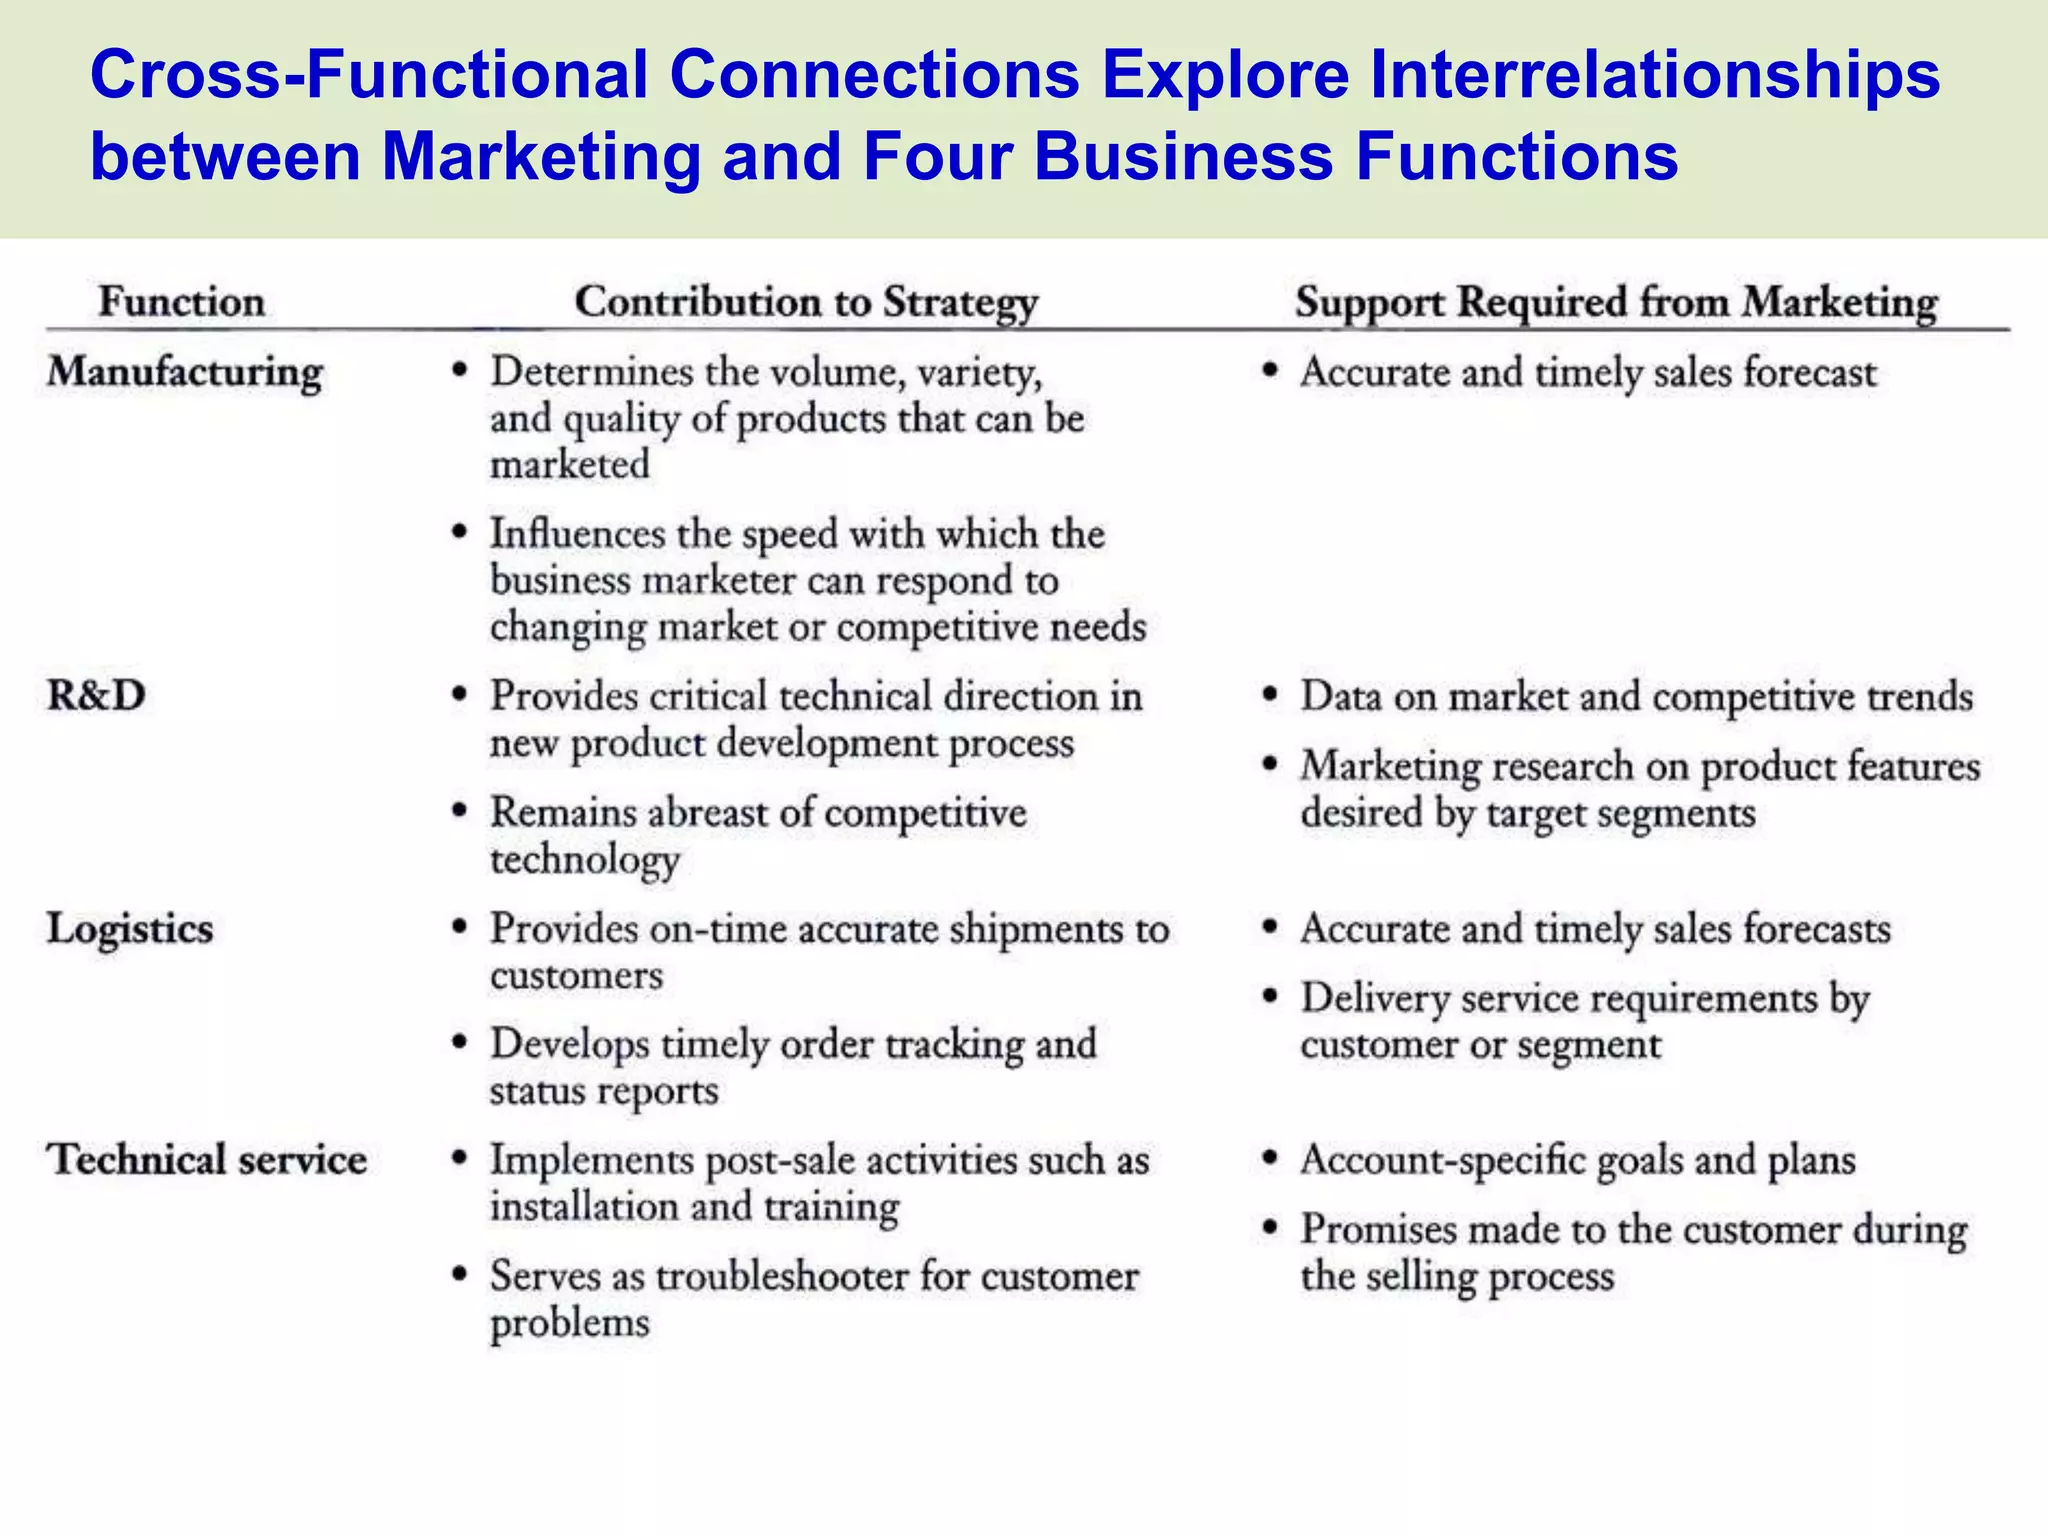
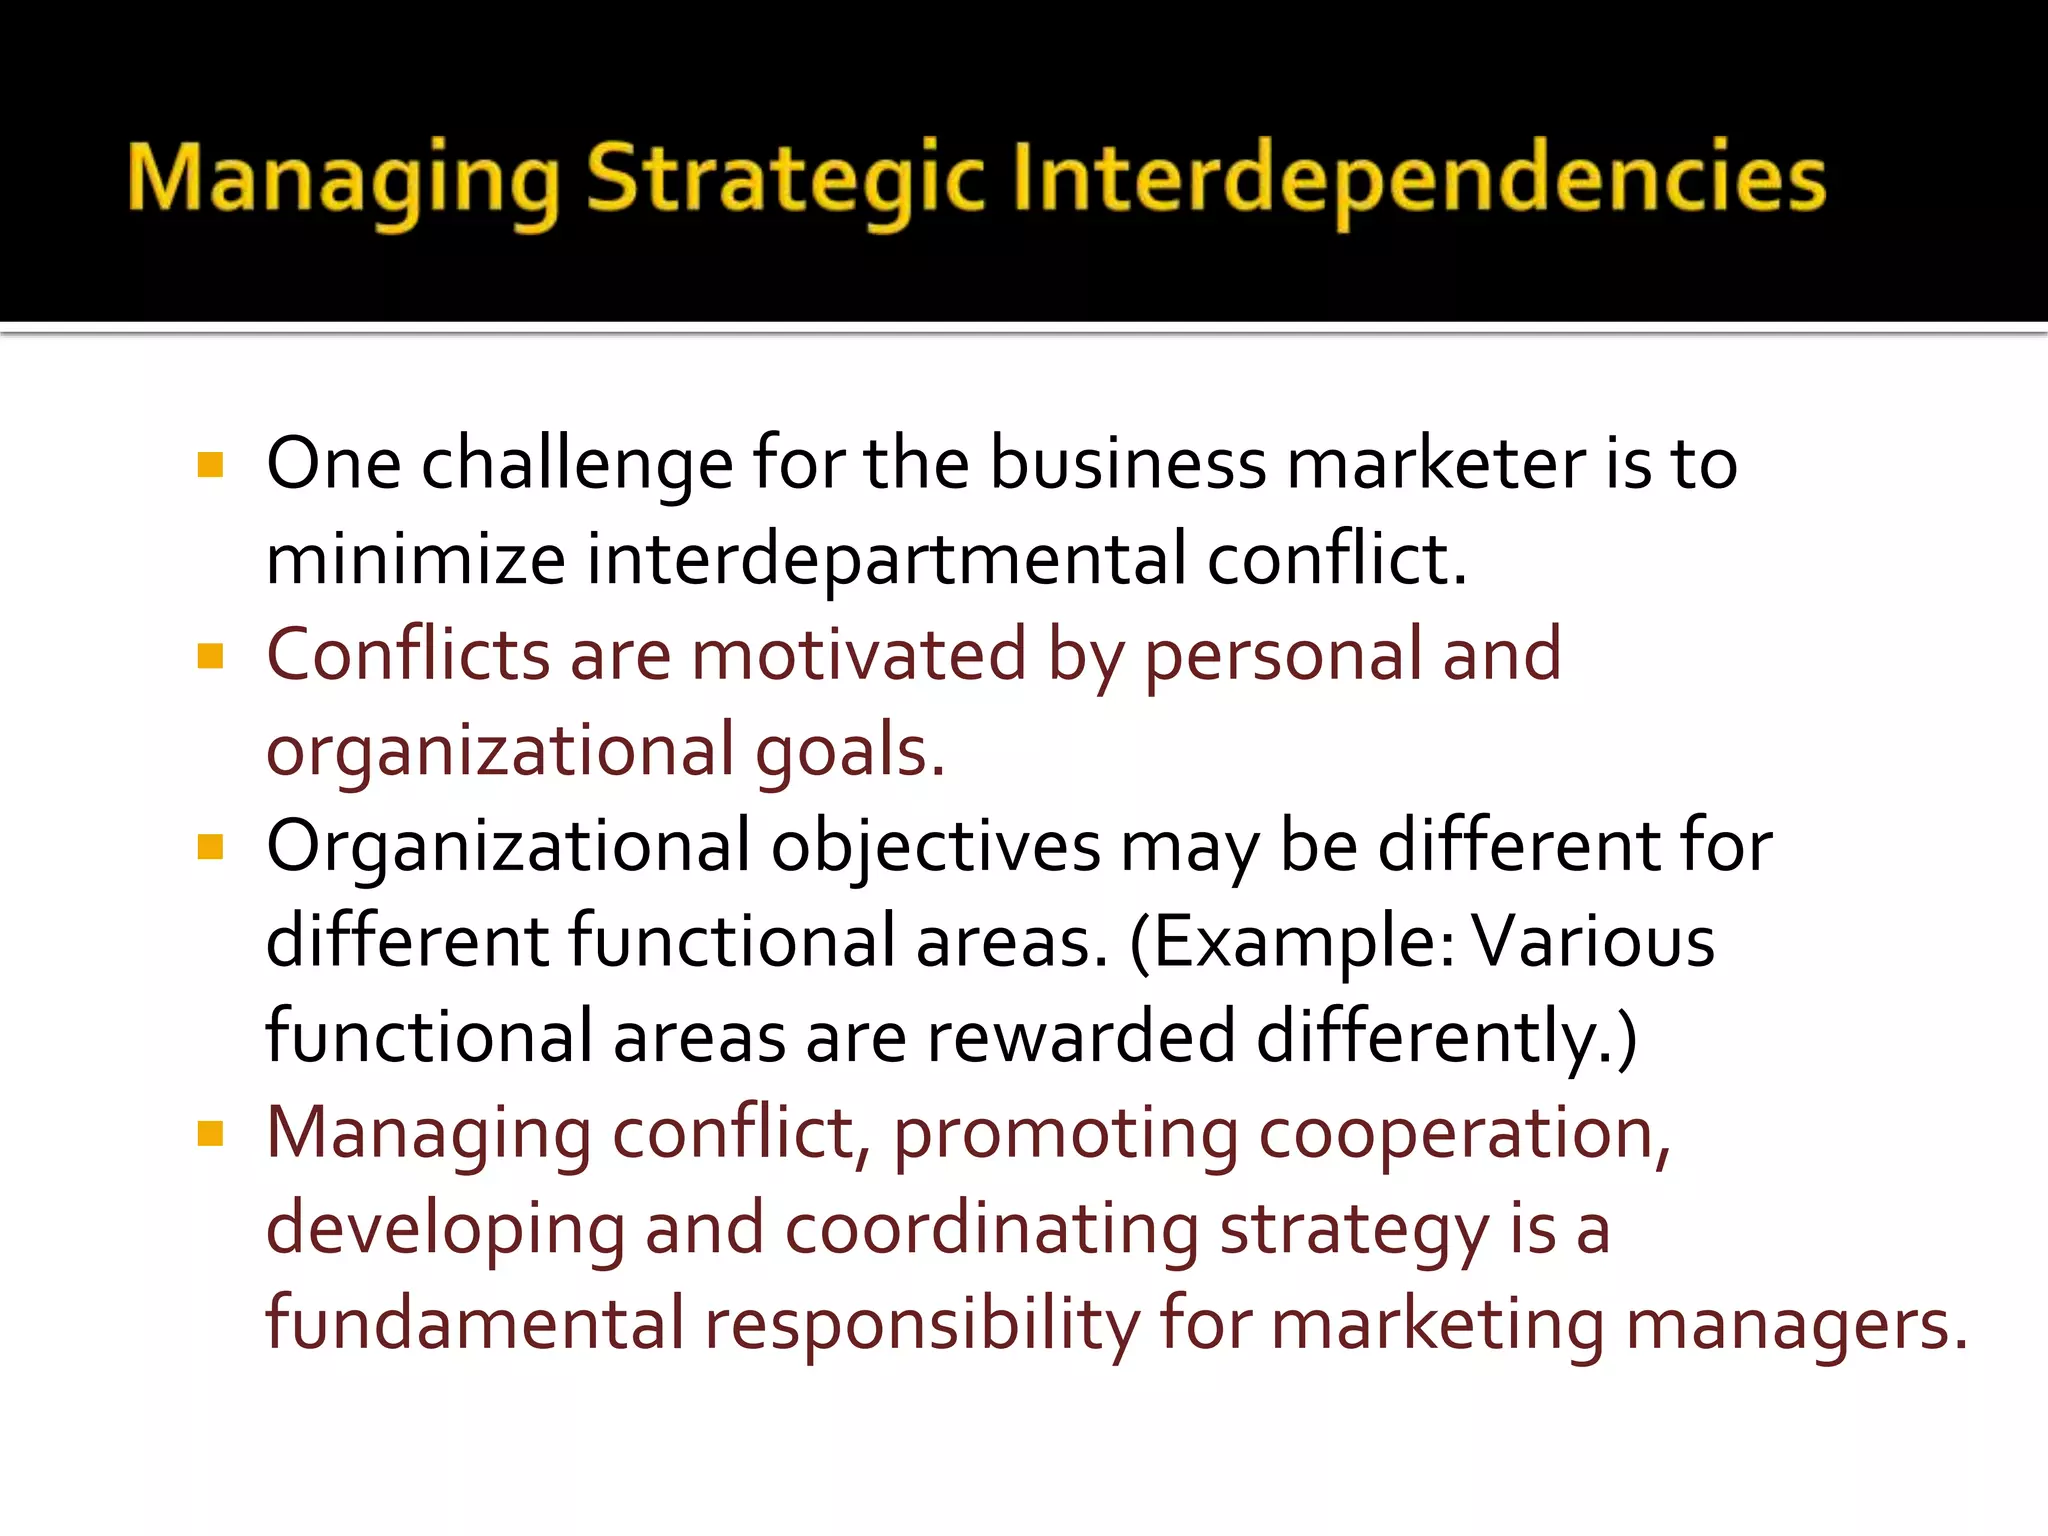
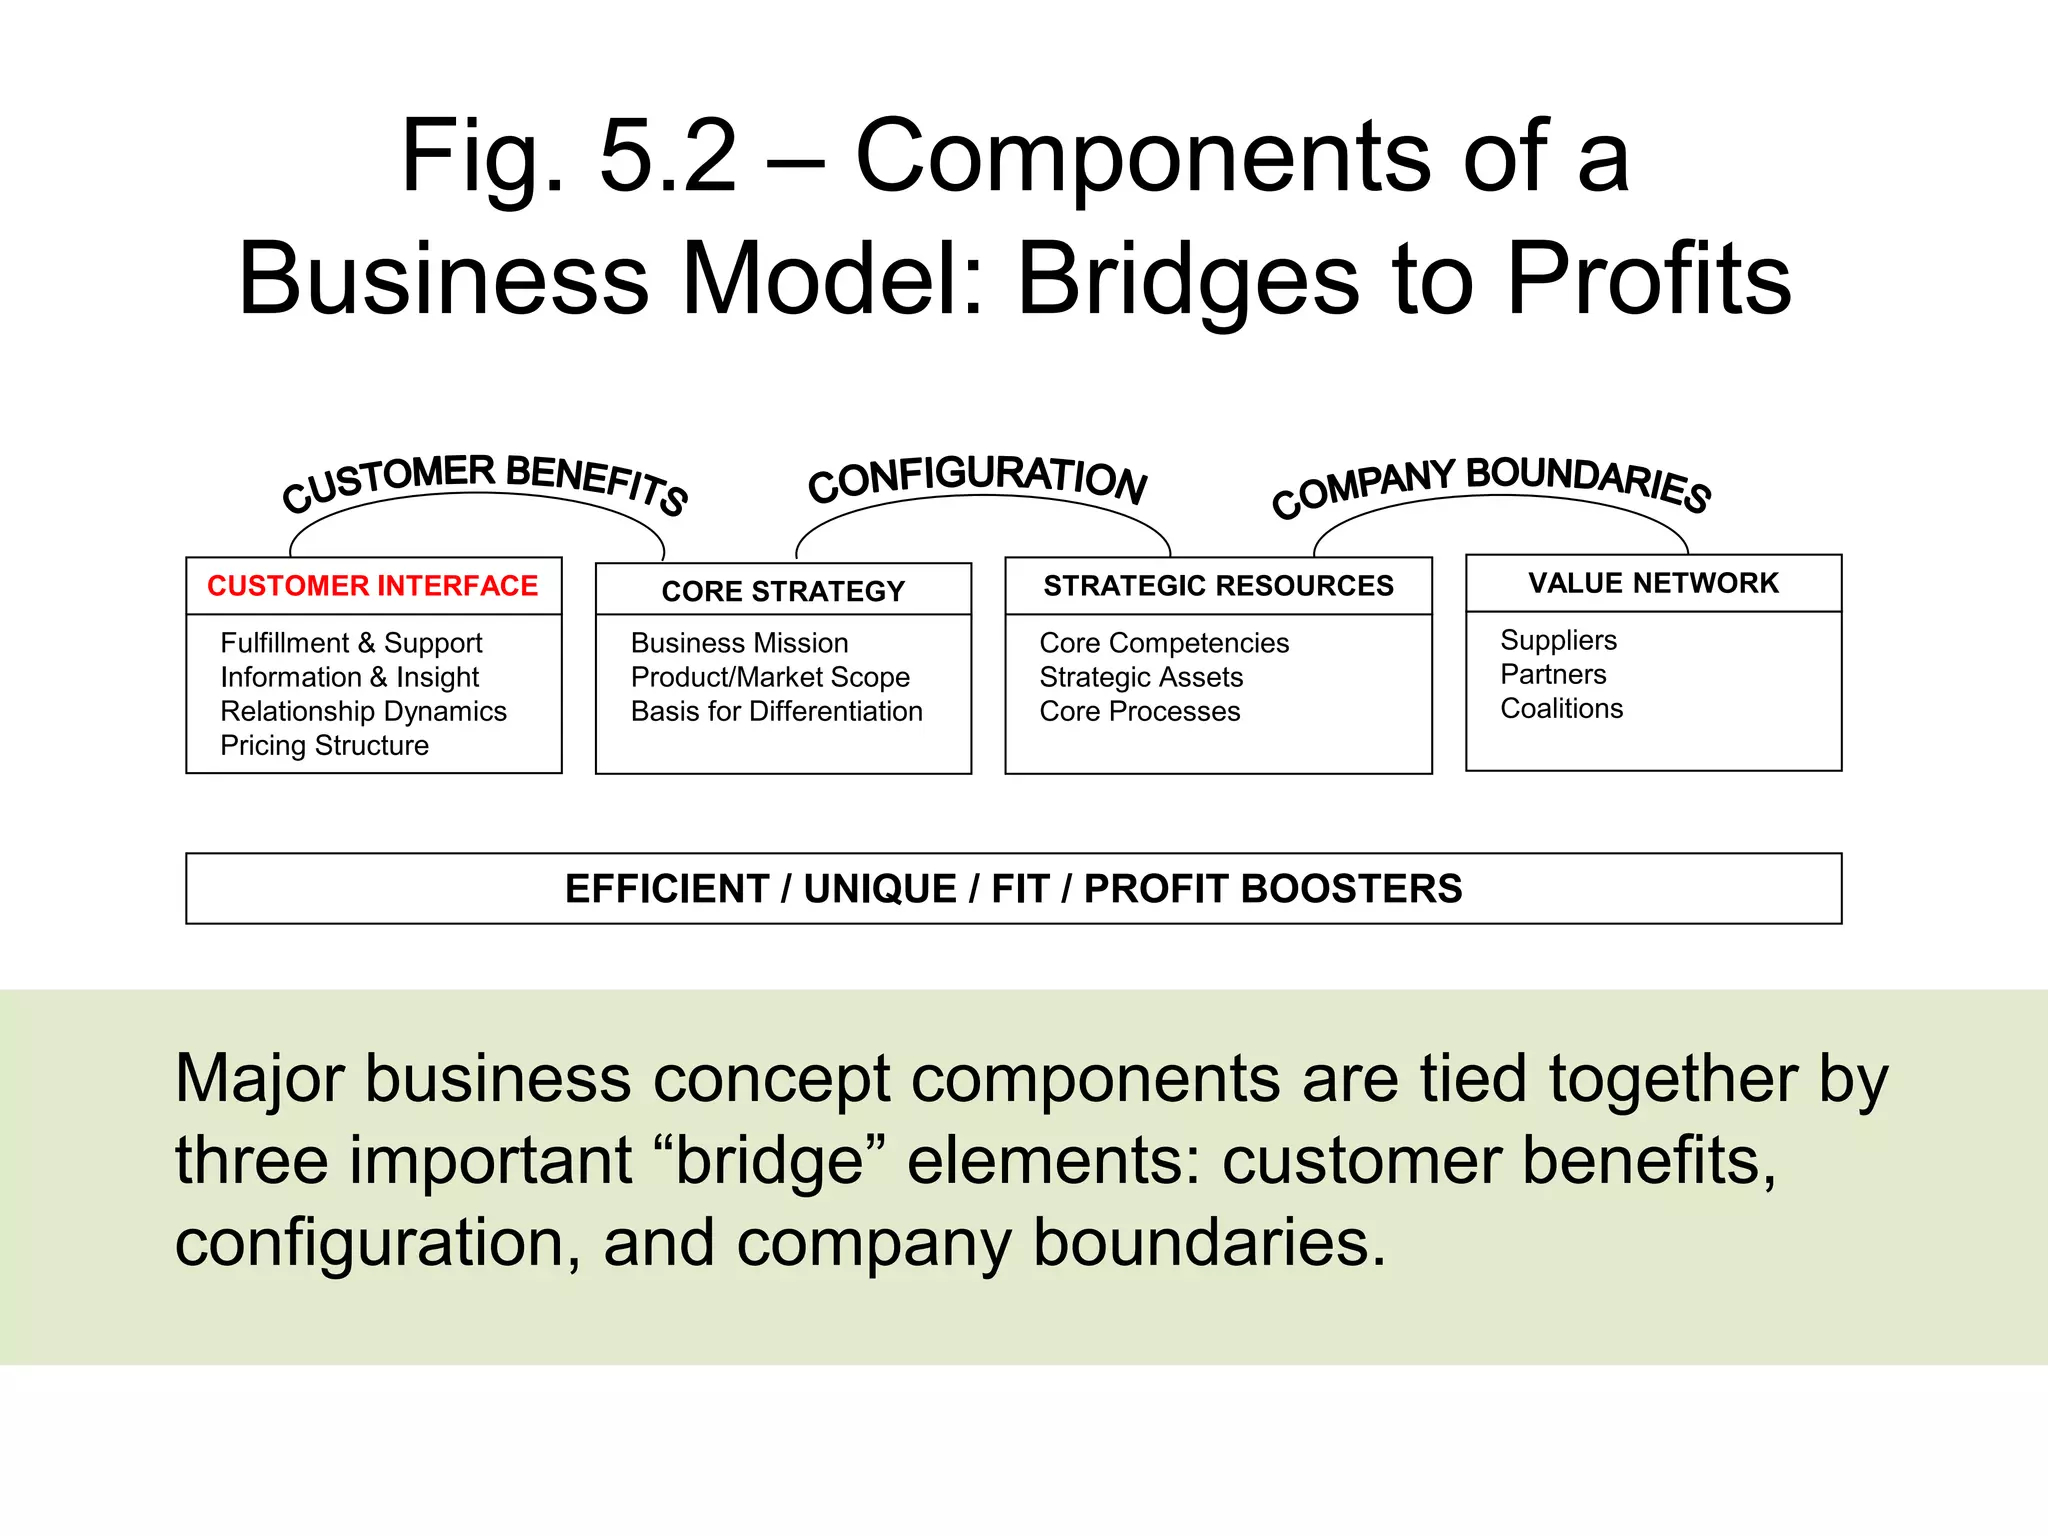

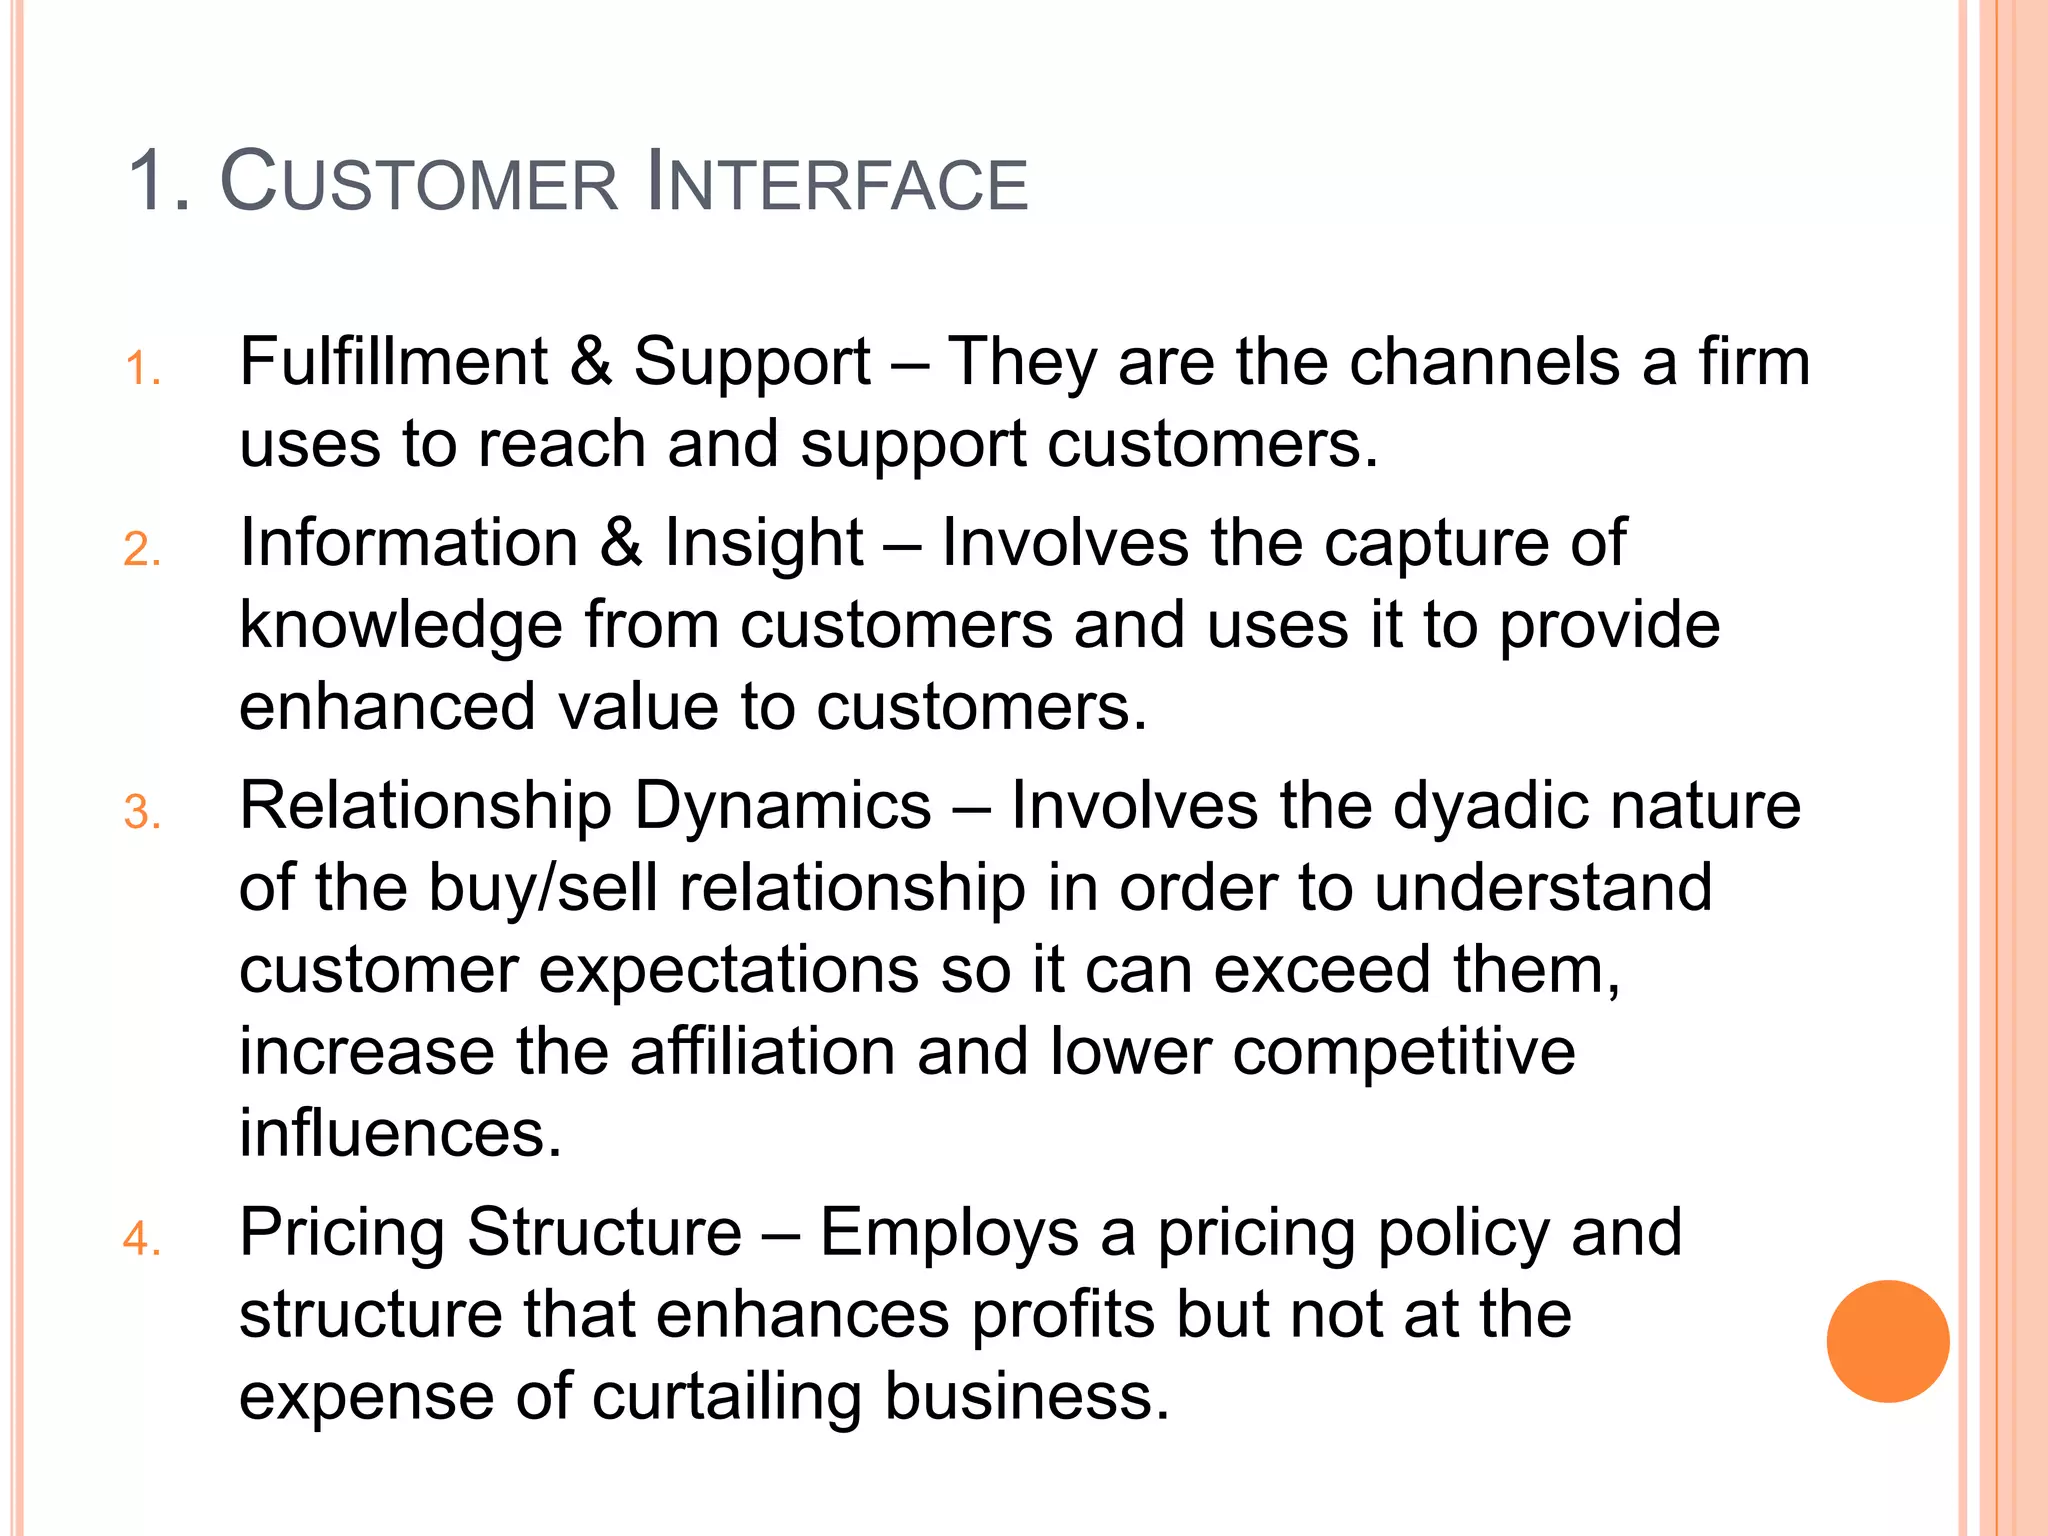
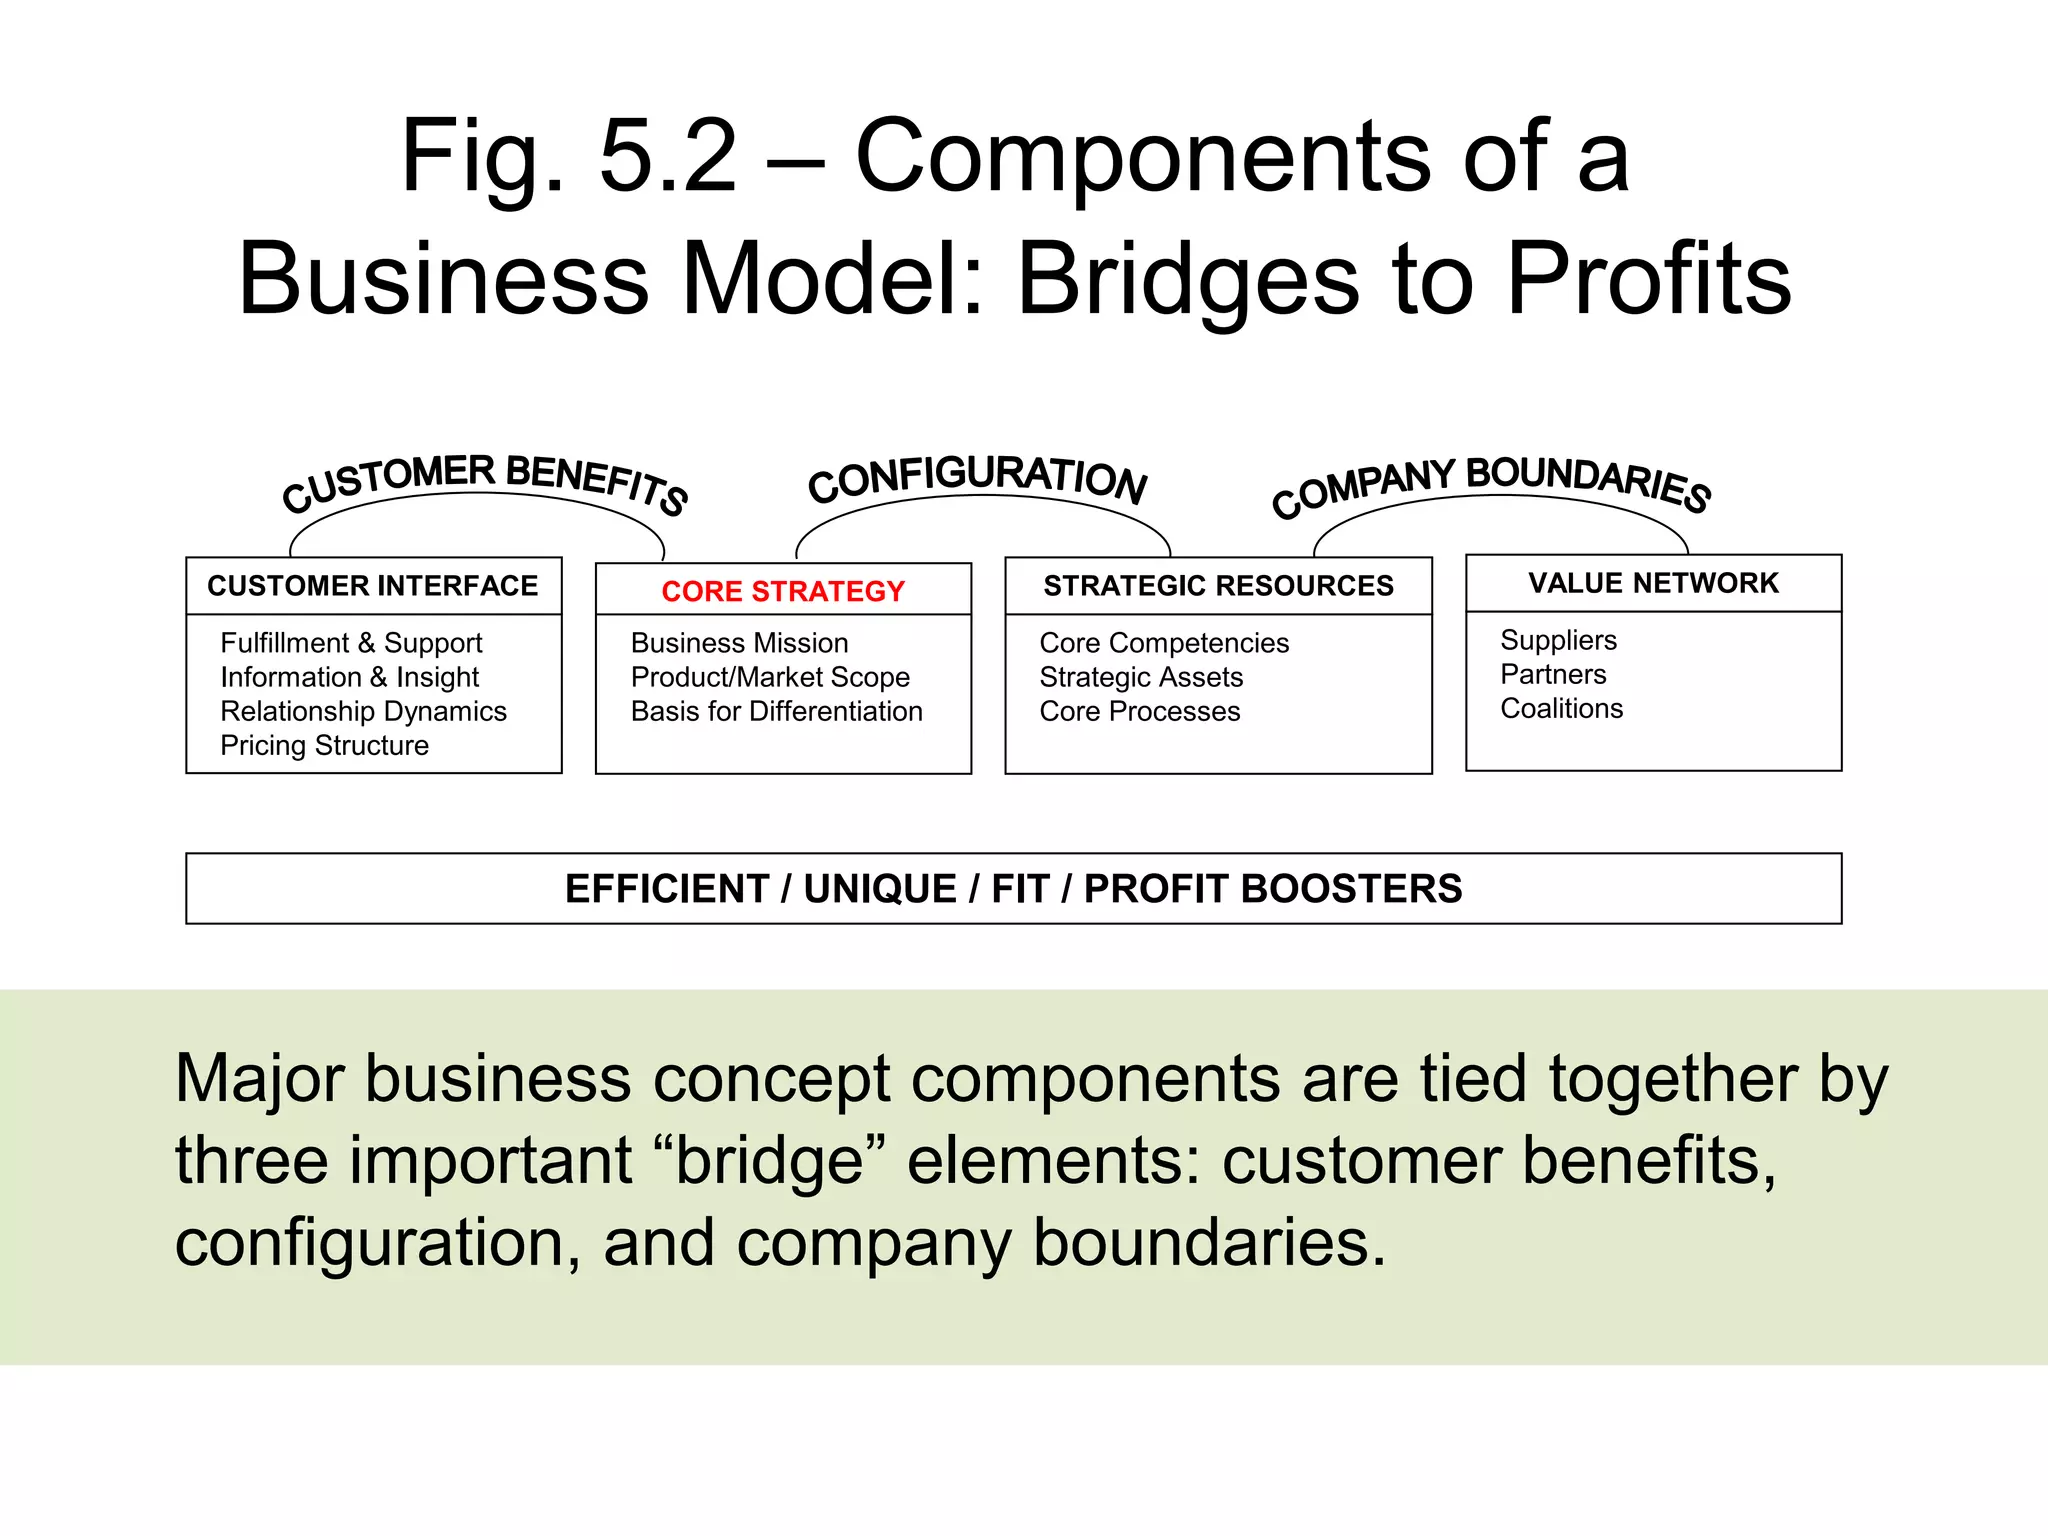
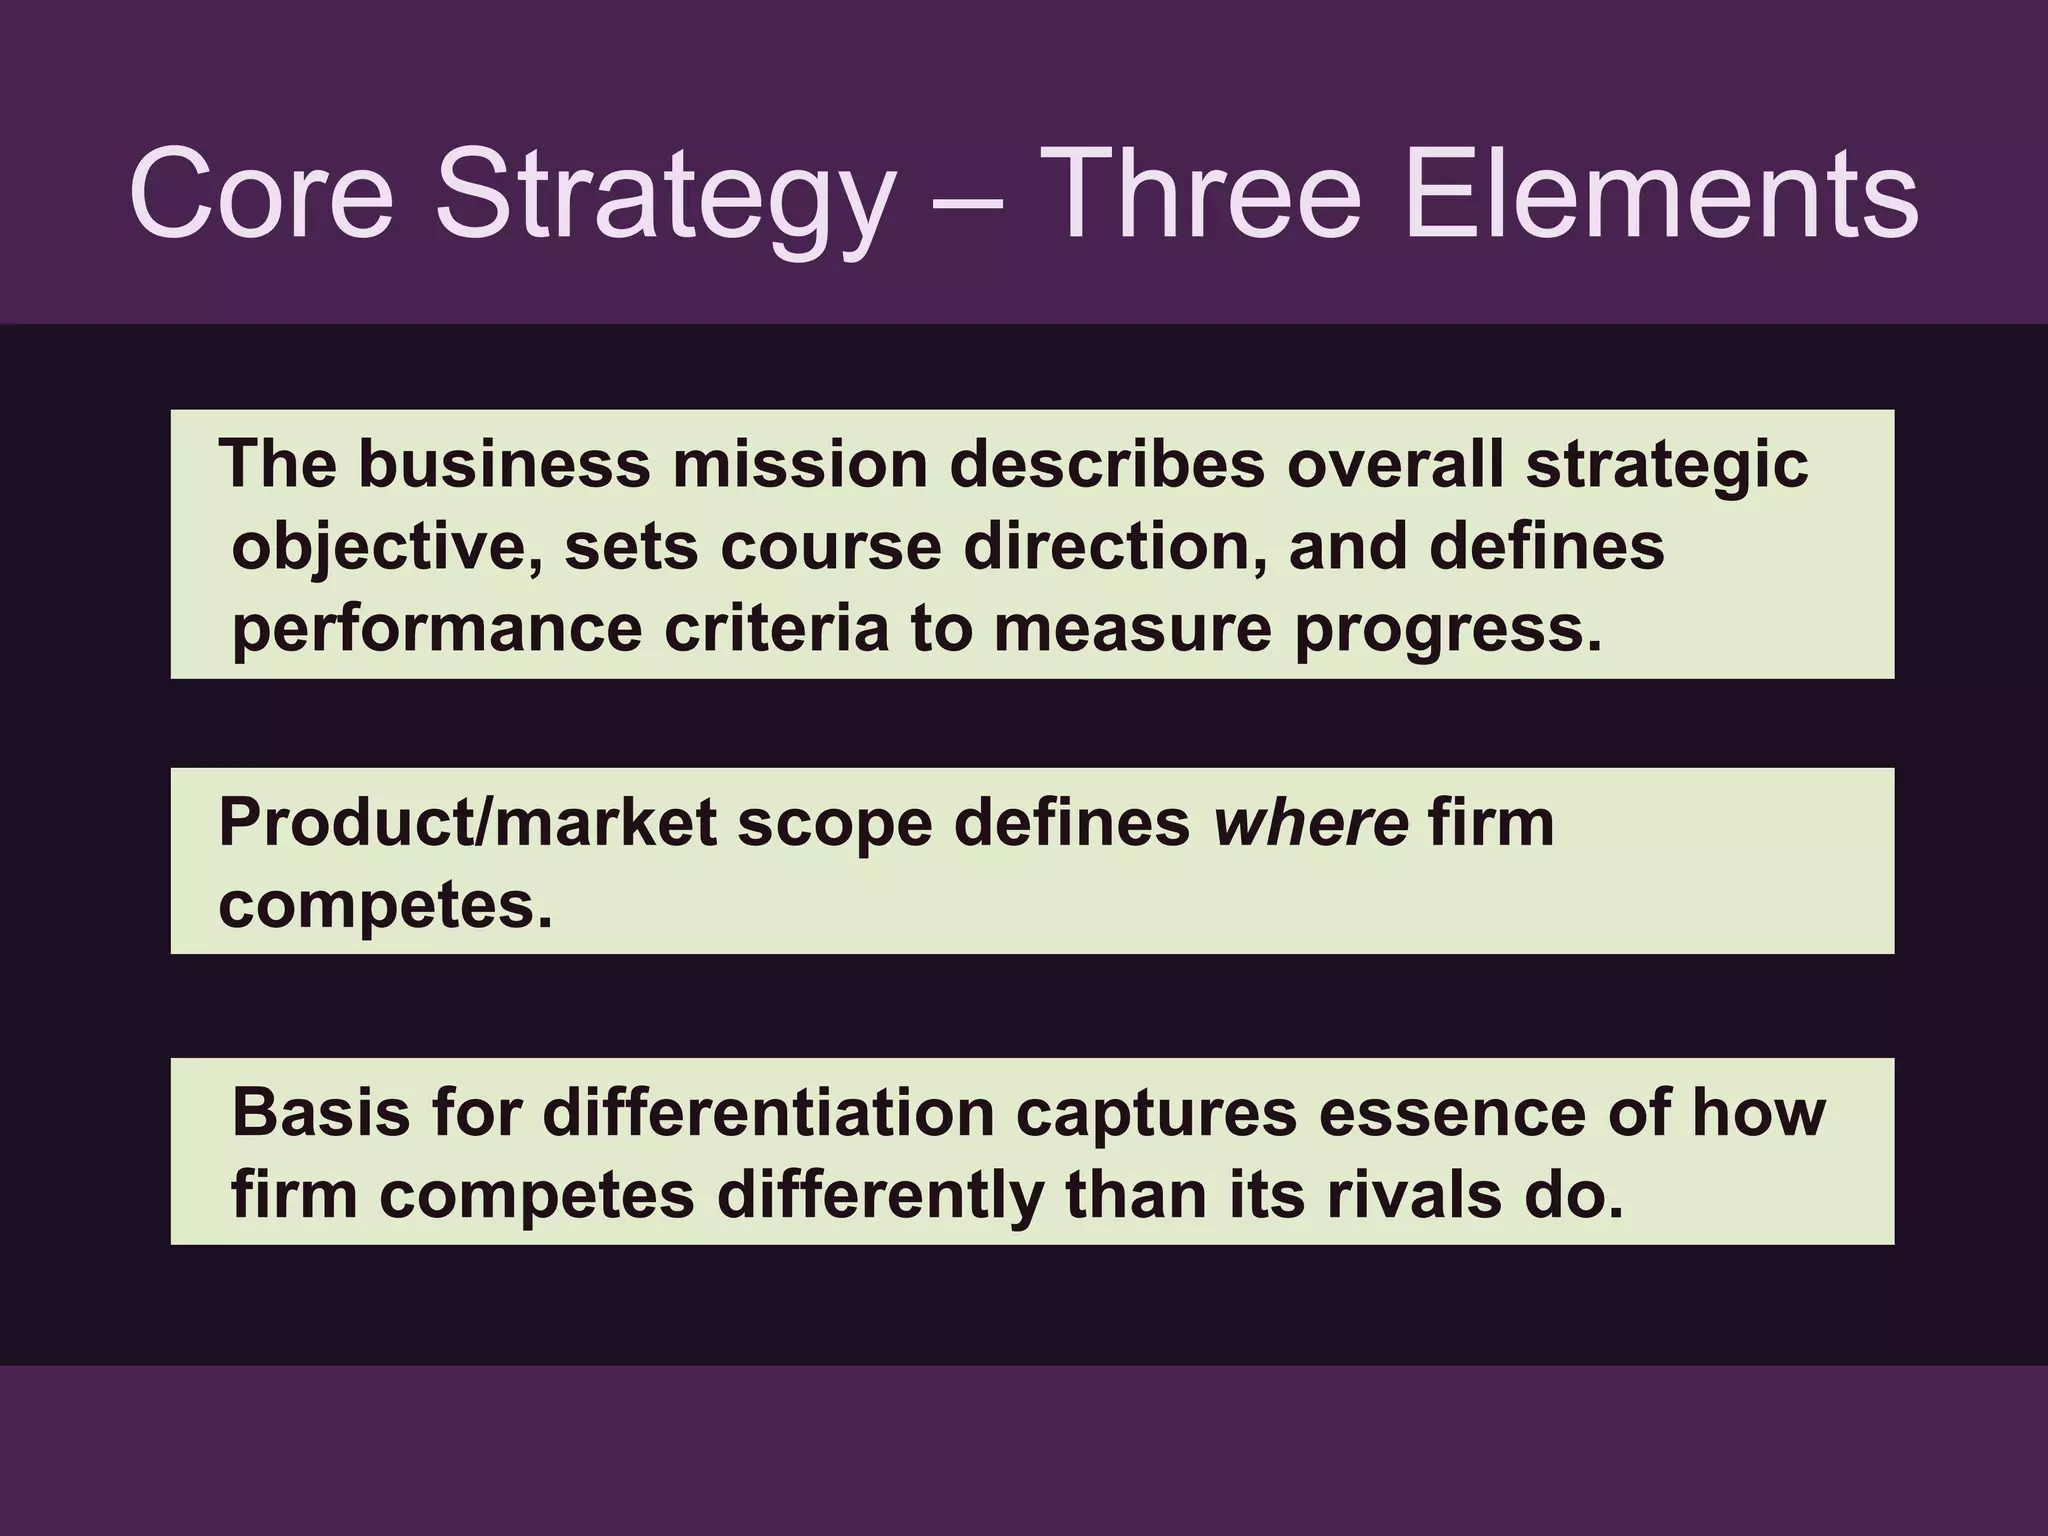
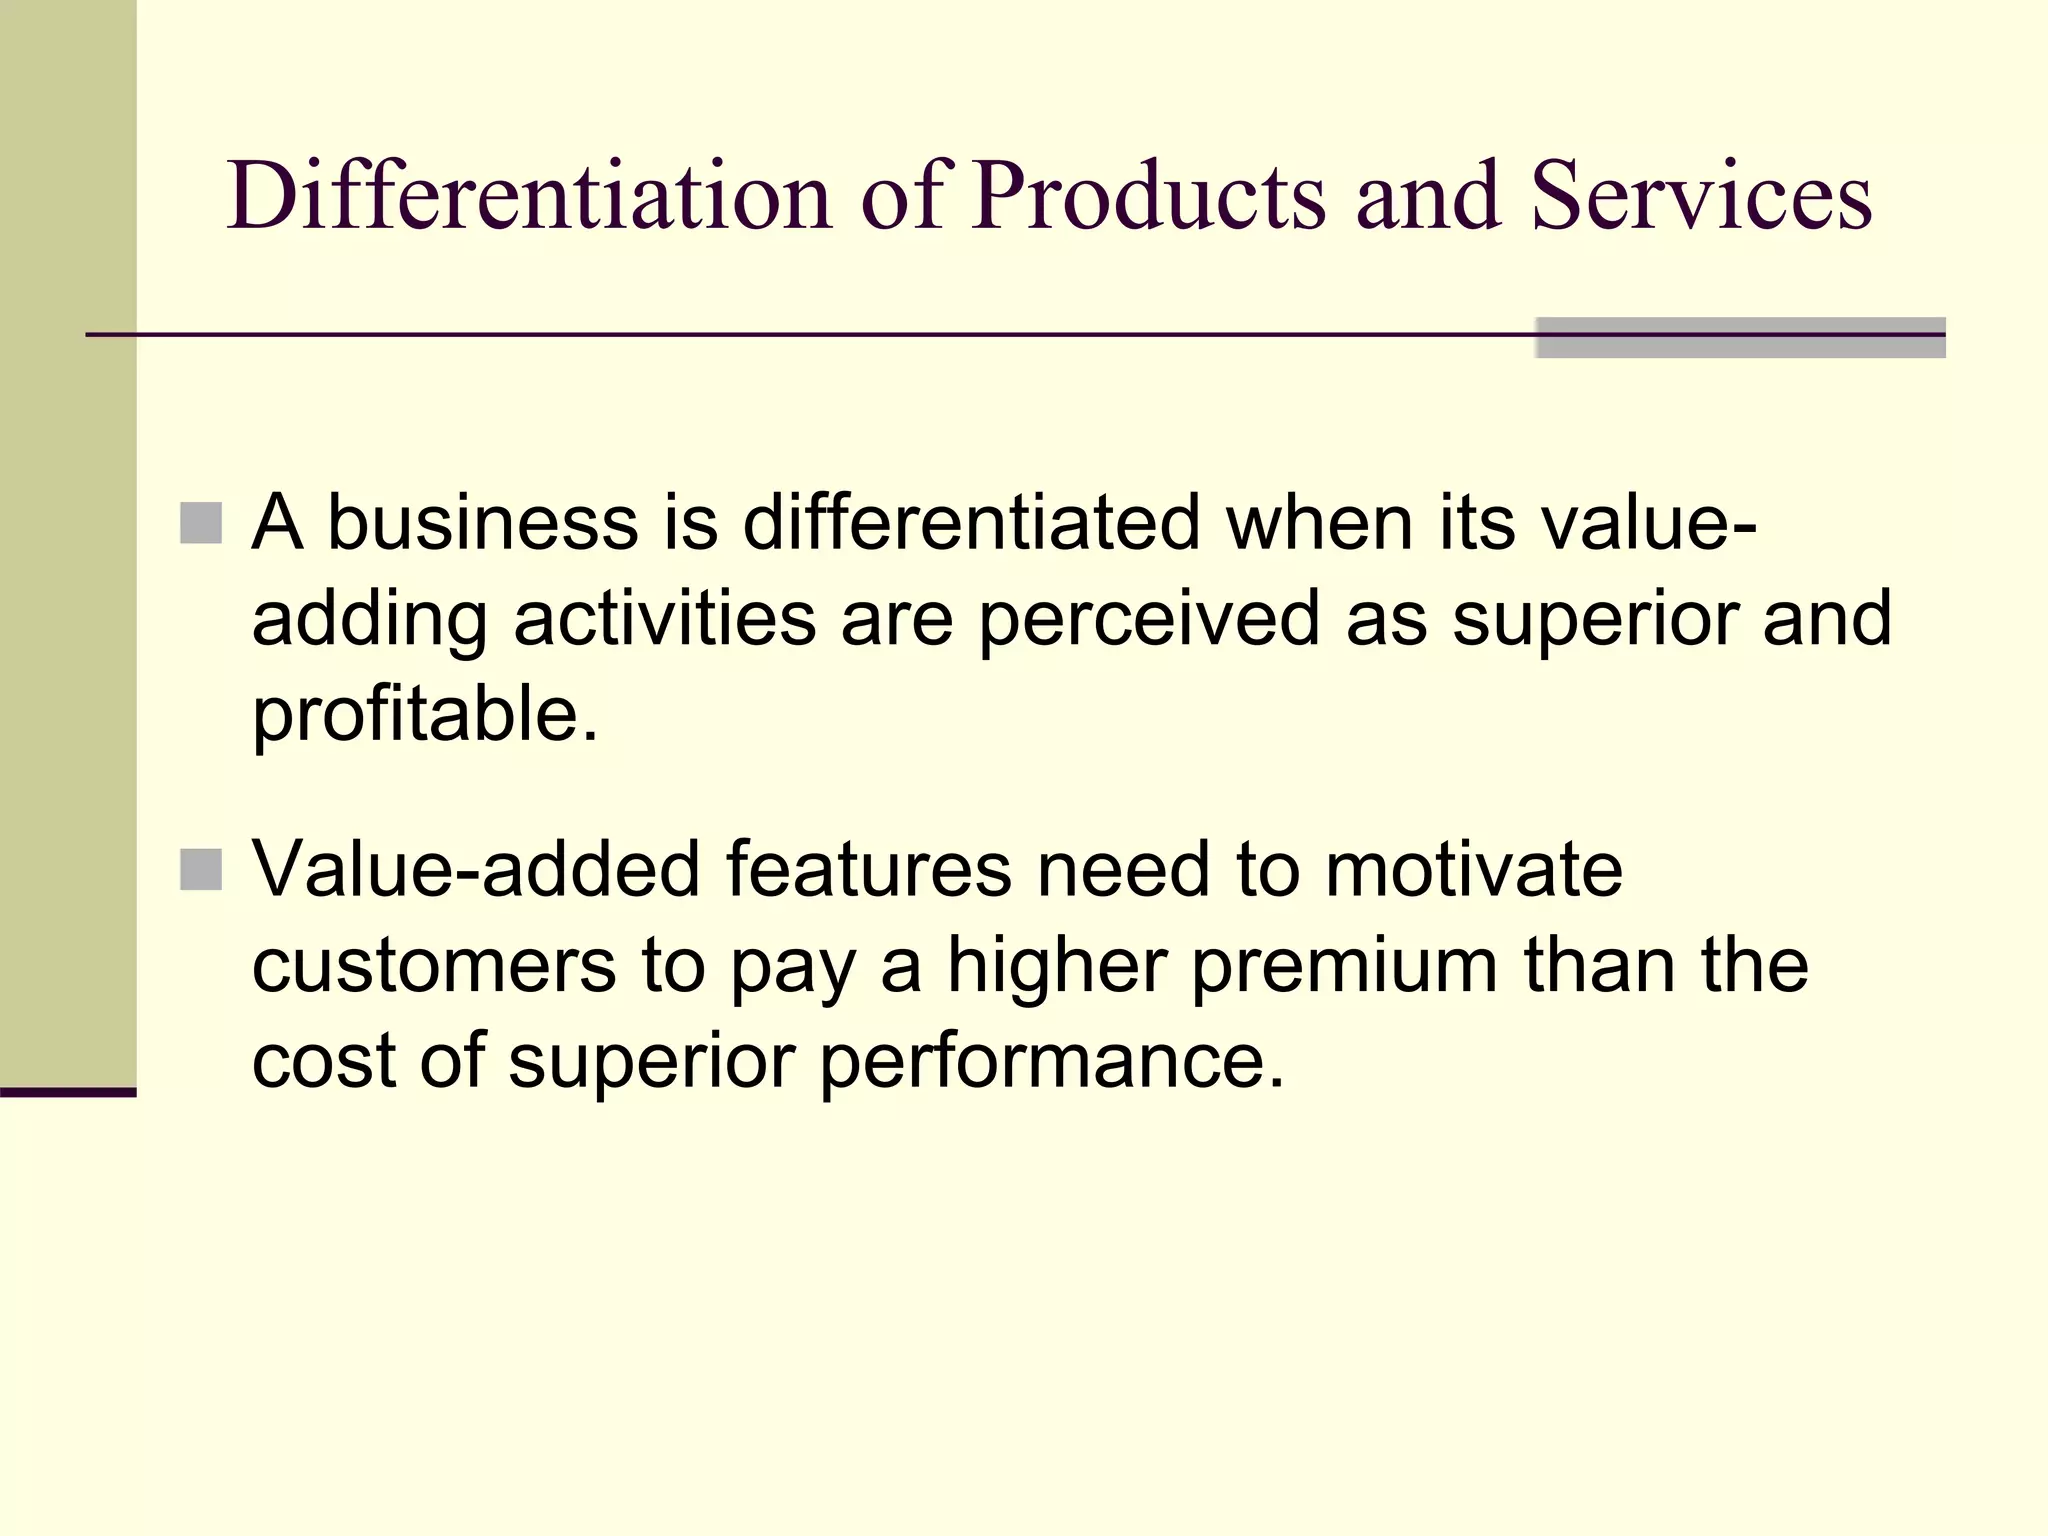
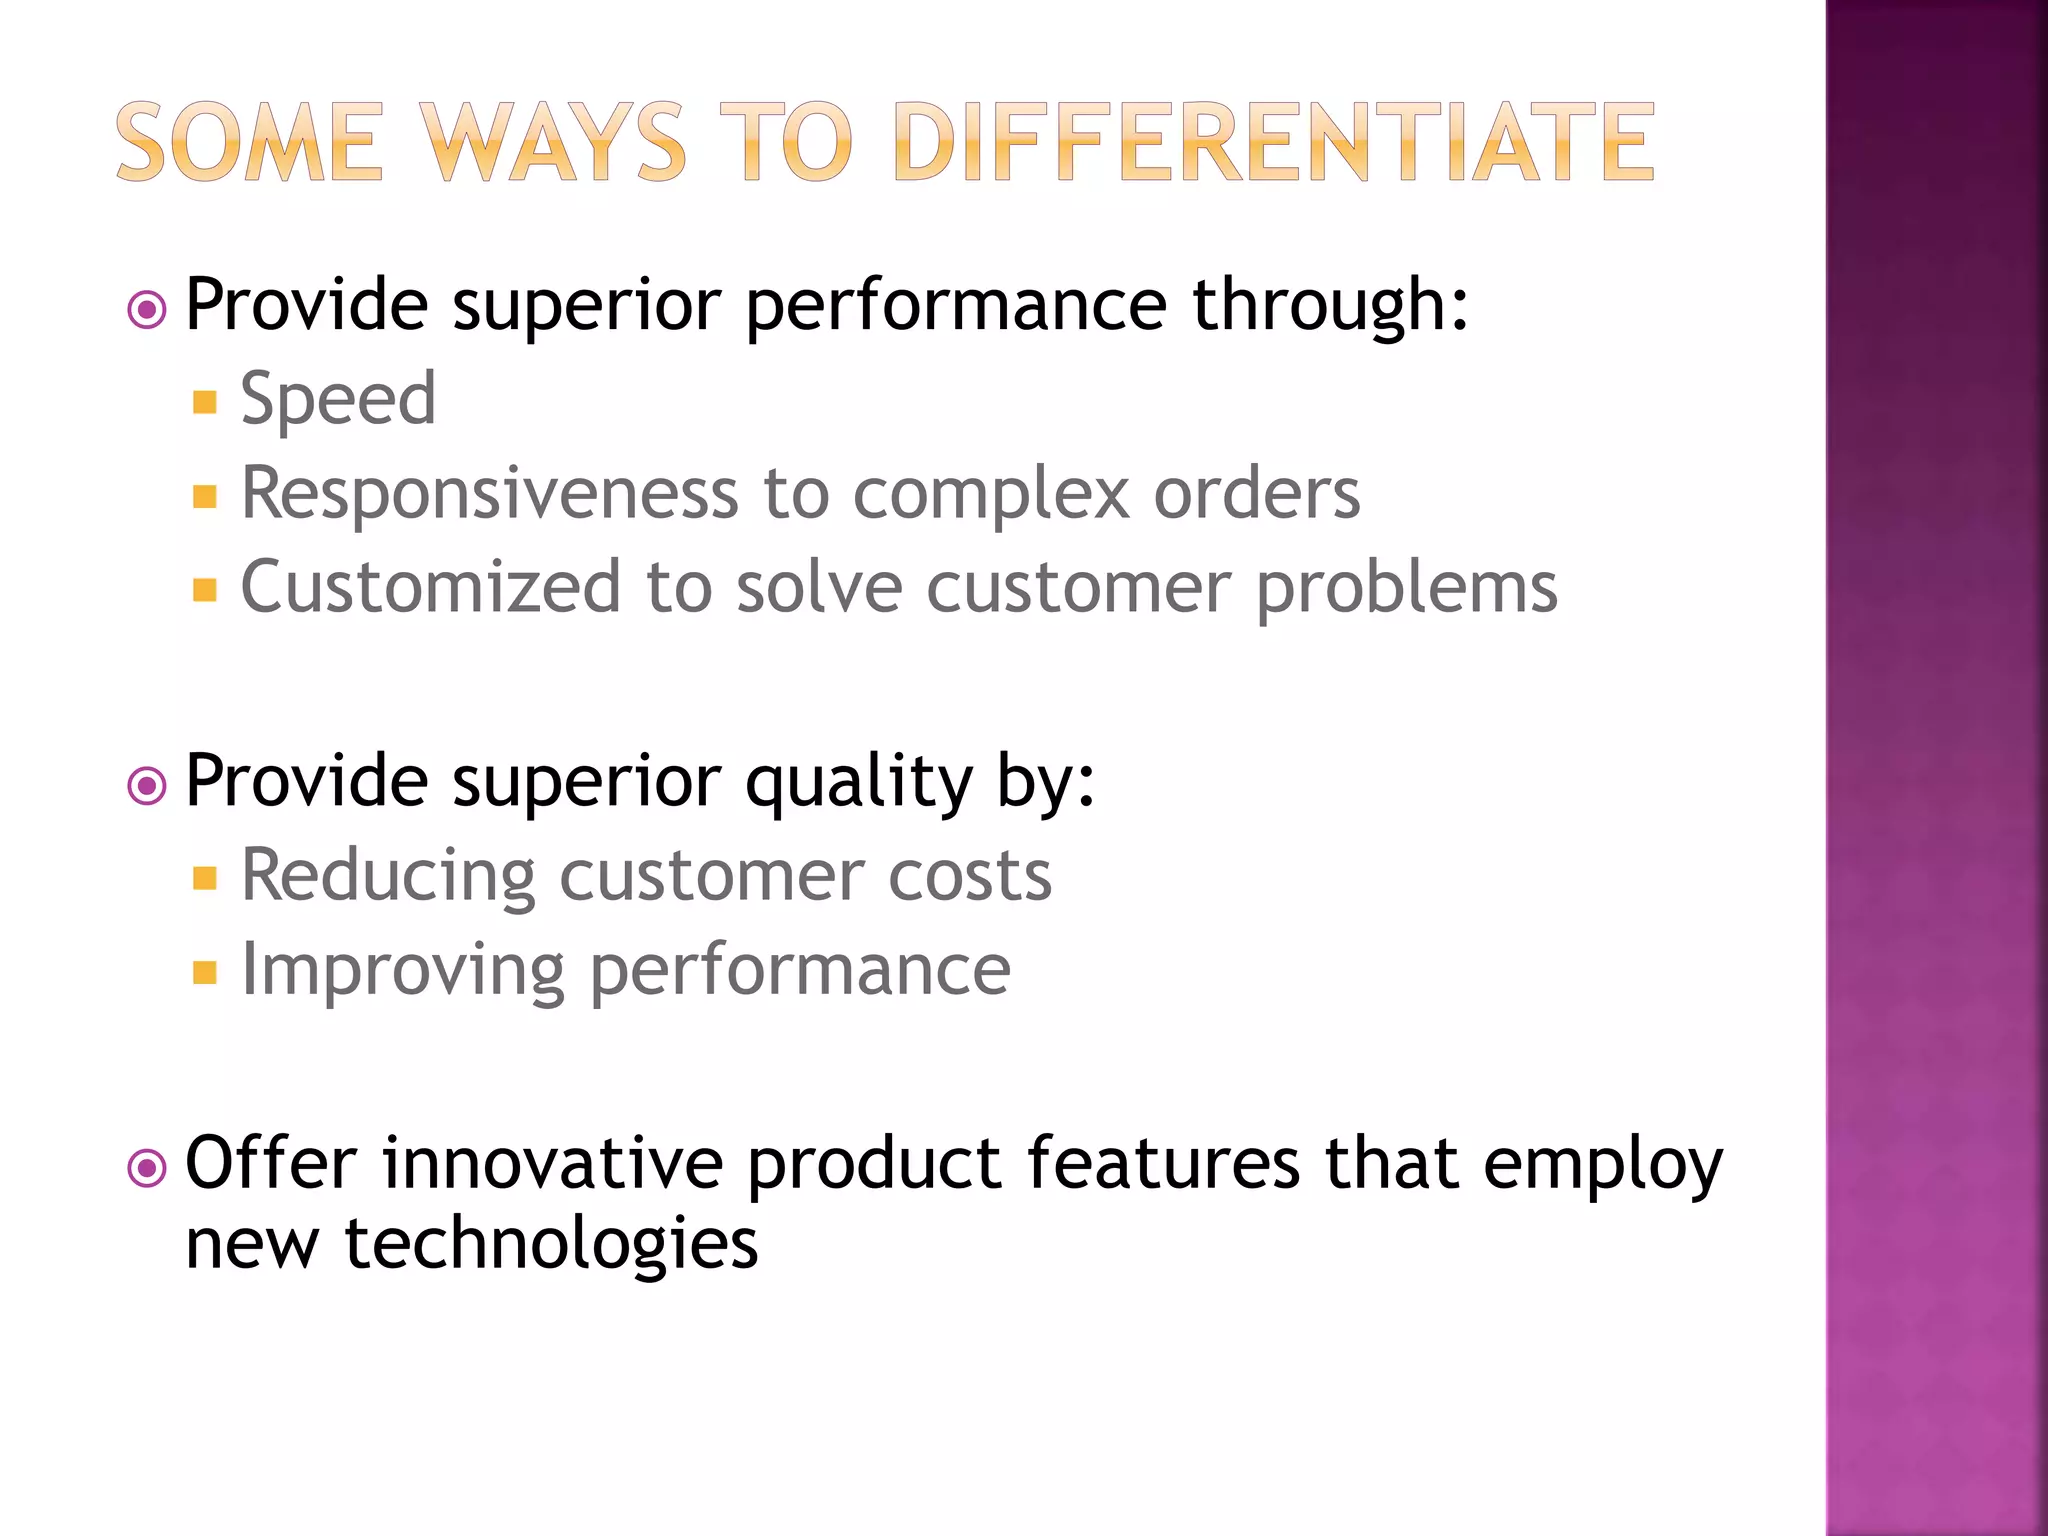

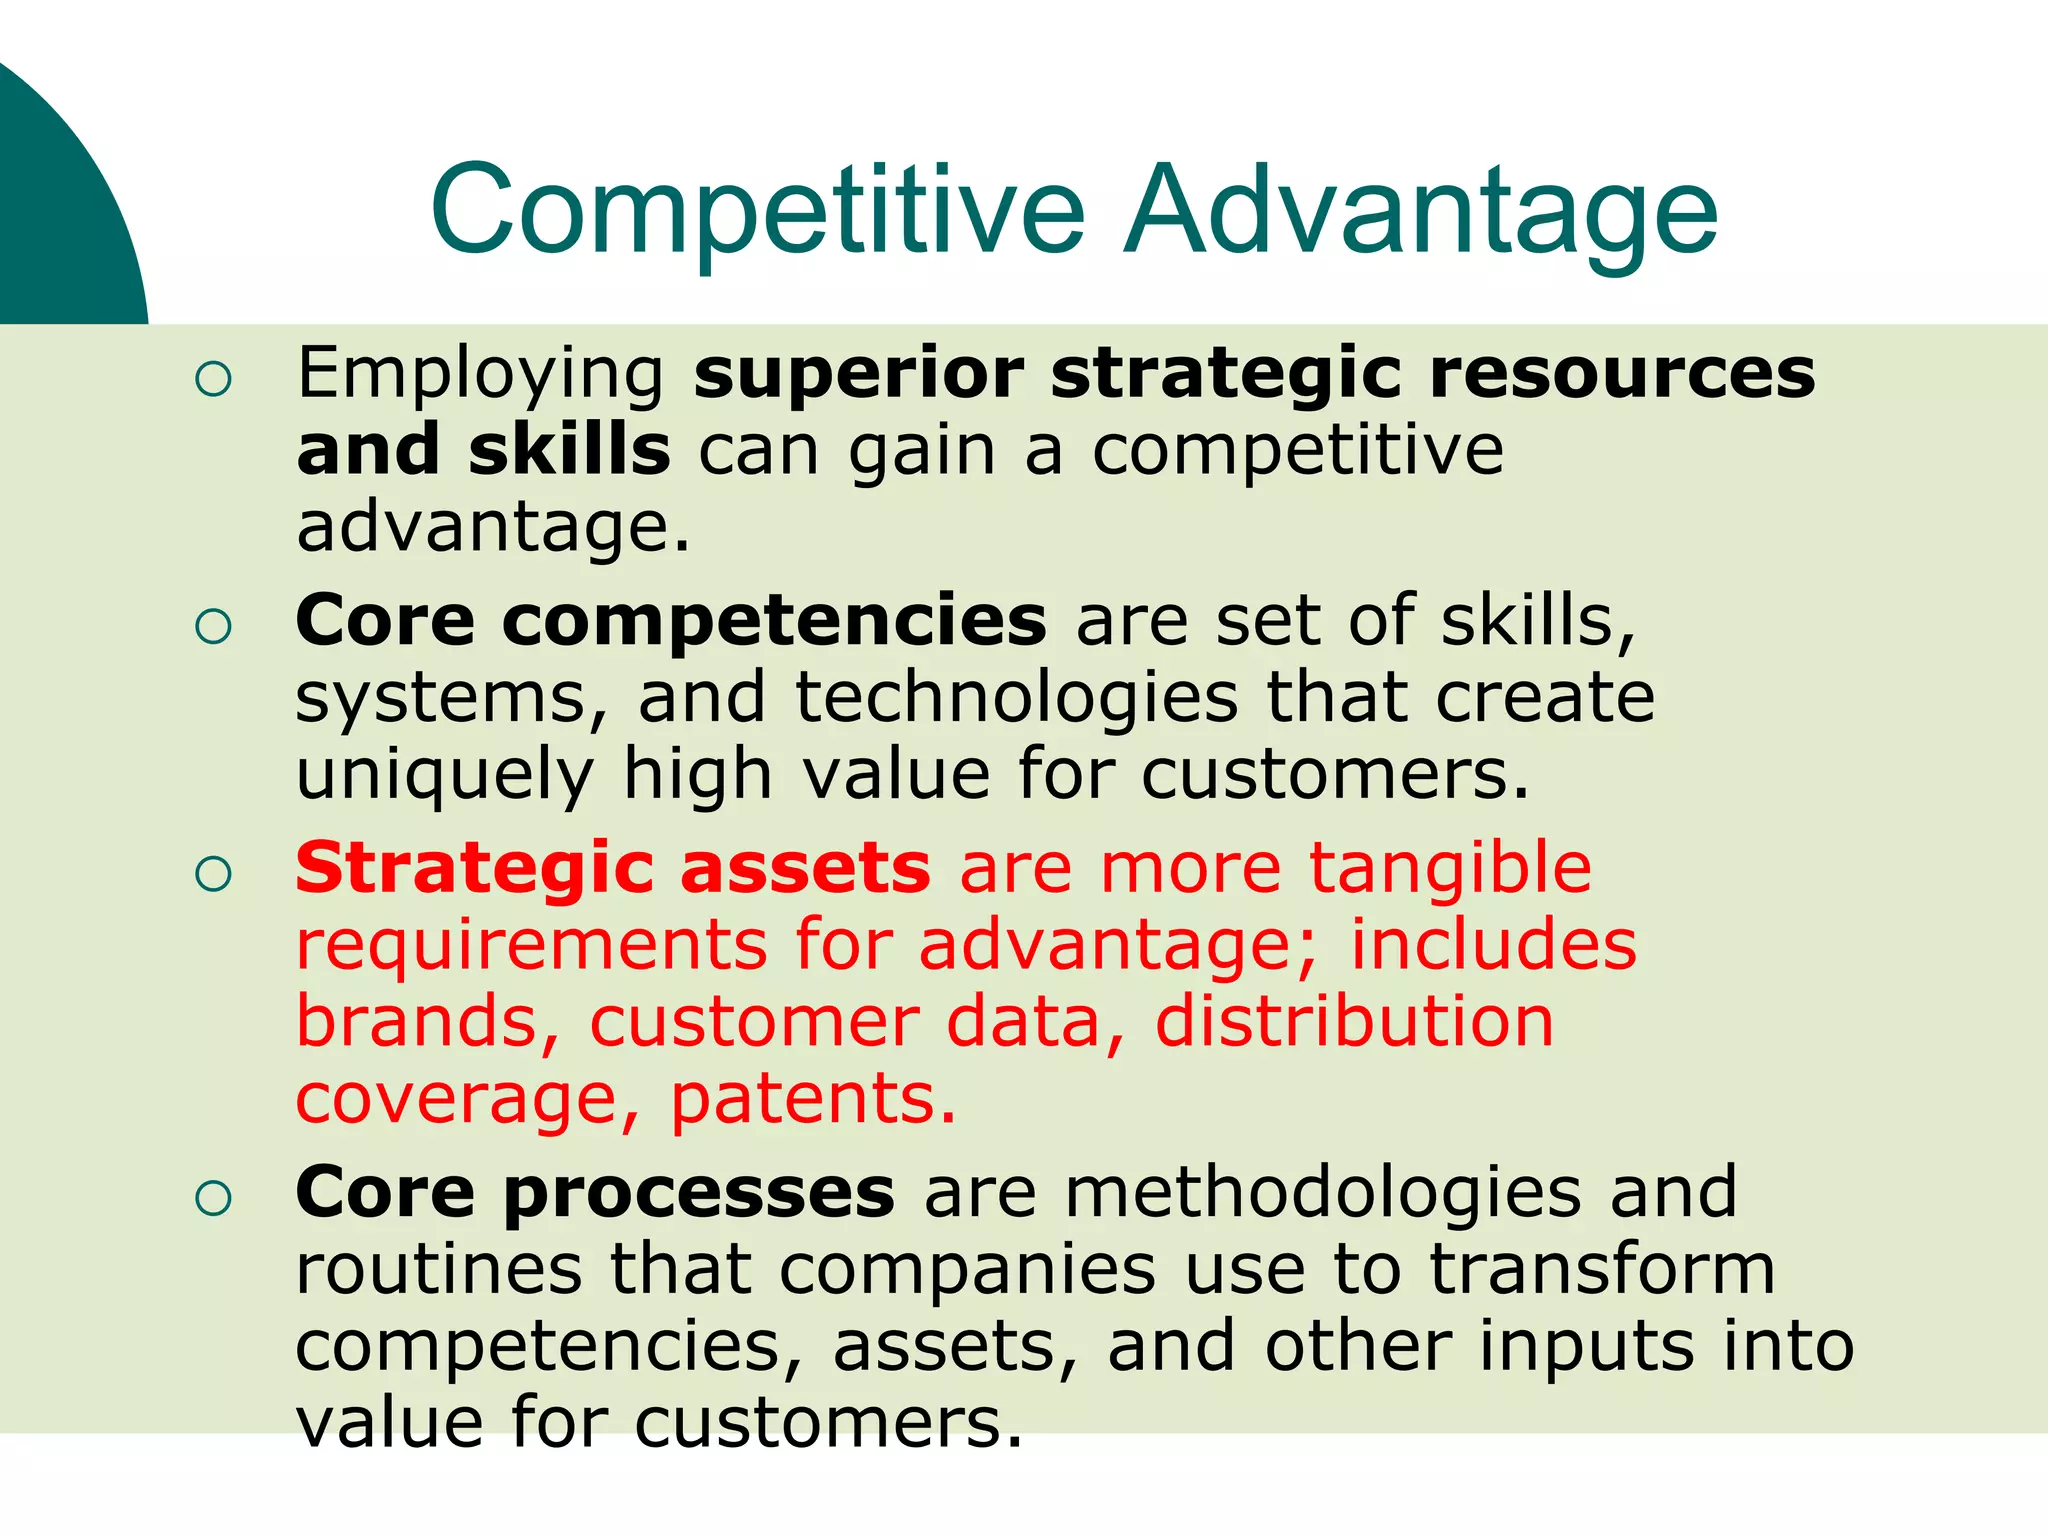


- The document discusses strategies at three levels: corporate, business, and functional. At the corporate level, marketing assesses market attractiveness and promotes customer orientation. At the business level, firms compete through differentiation and positioning. At the functional level, resources are allocated to support business strategies. - Developing strategies requires negotiation between different functional areas that may have competing interests. Successful marketing managers understand capabilities across functions and facilitate strategies responsive to customer needs. - Four components contribute to strategy success: the customer interface, core strategy, strategic resources, and value network. These must be tied together through customer benefits, configuration, and boundaries.


