Download as PDF, PPTX


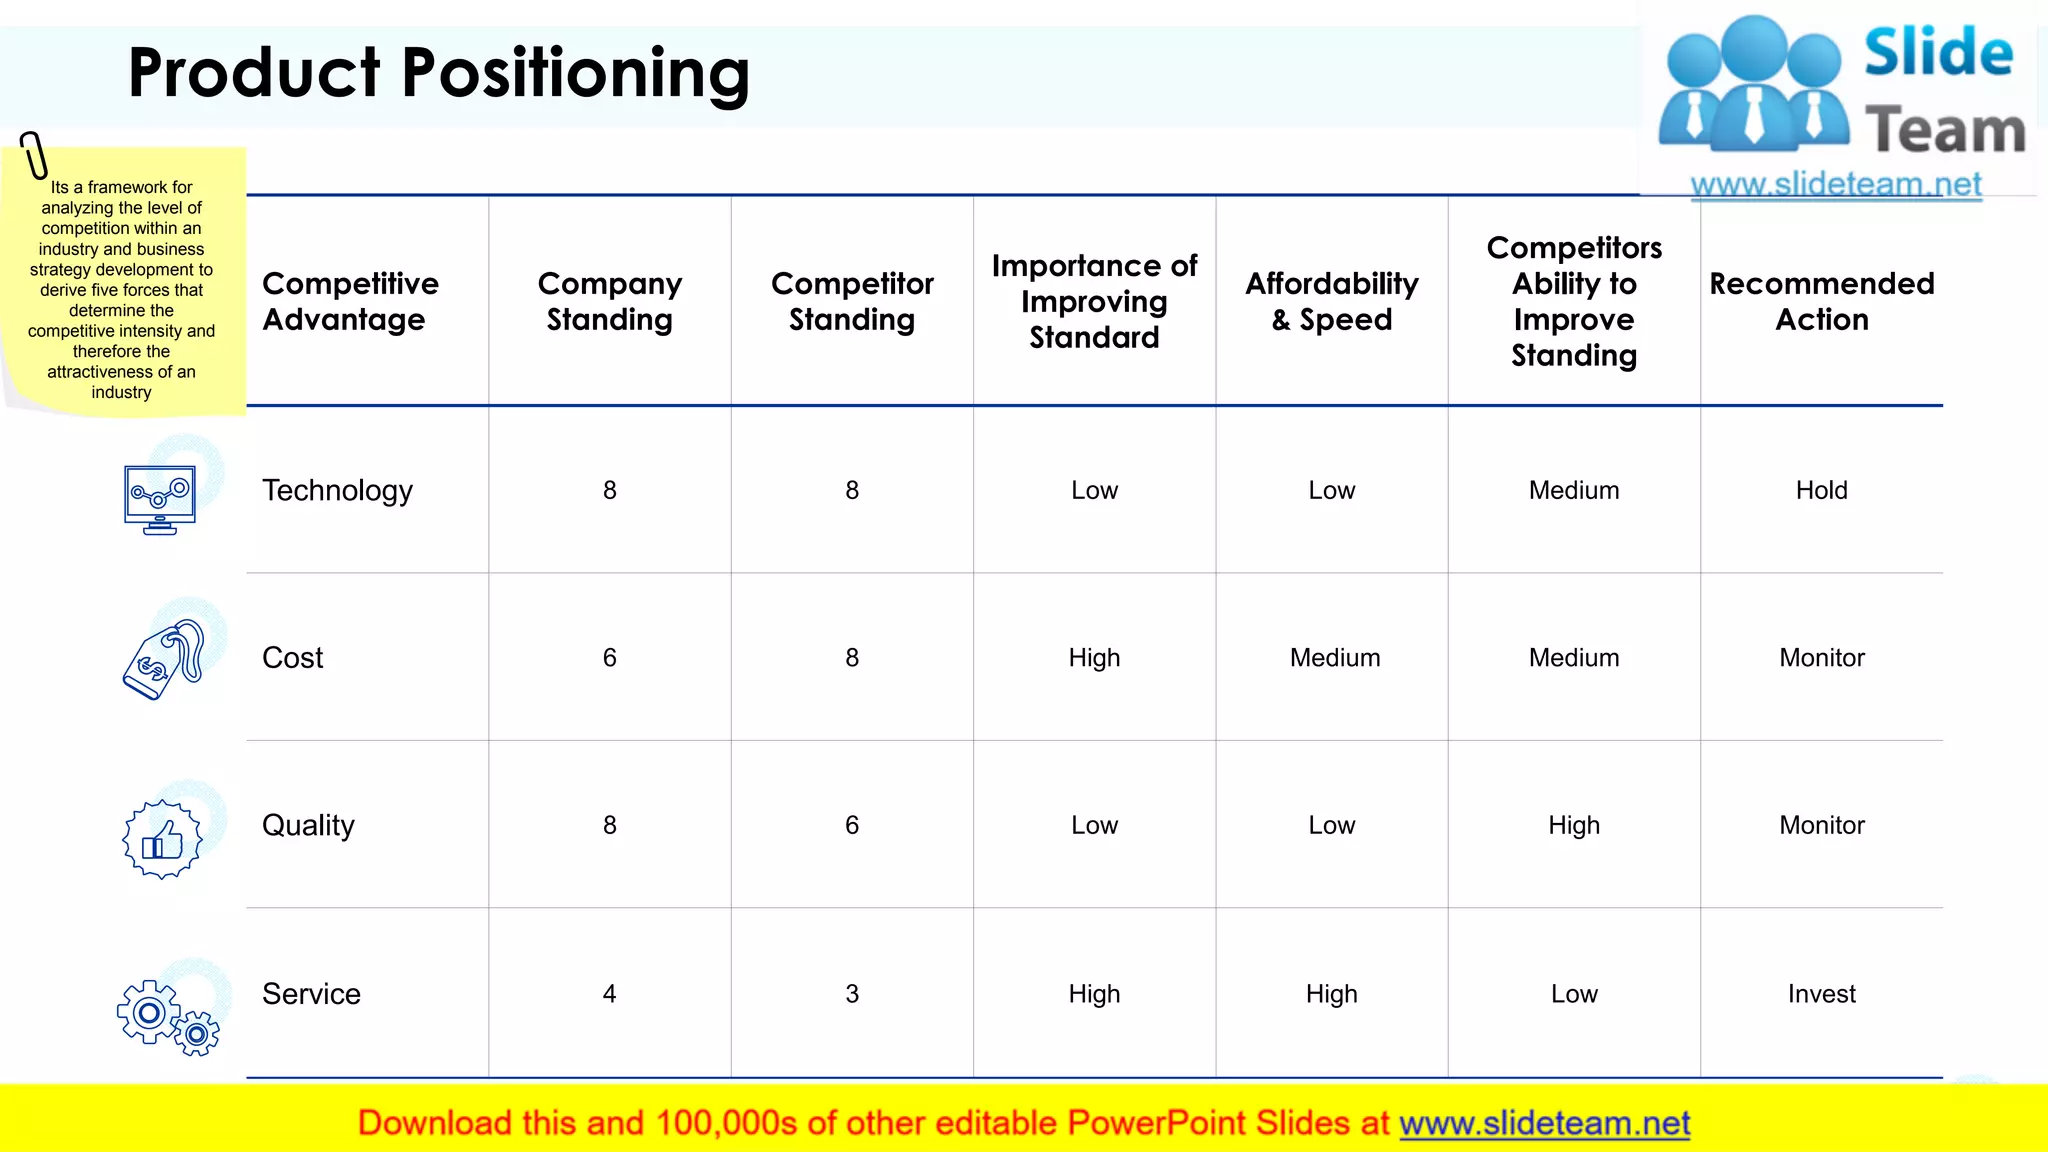
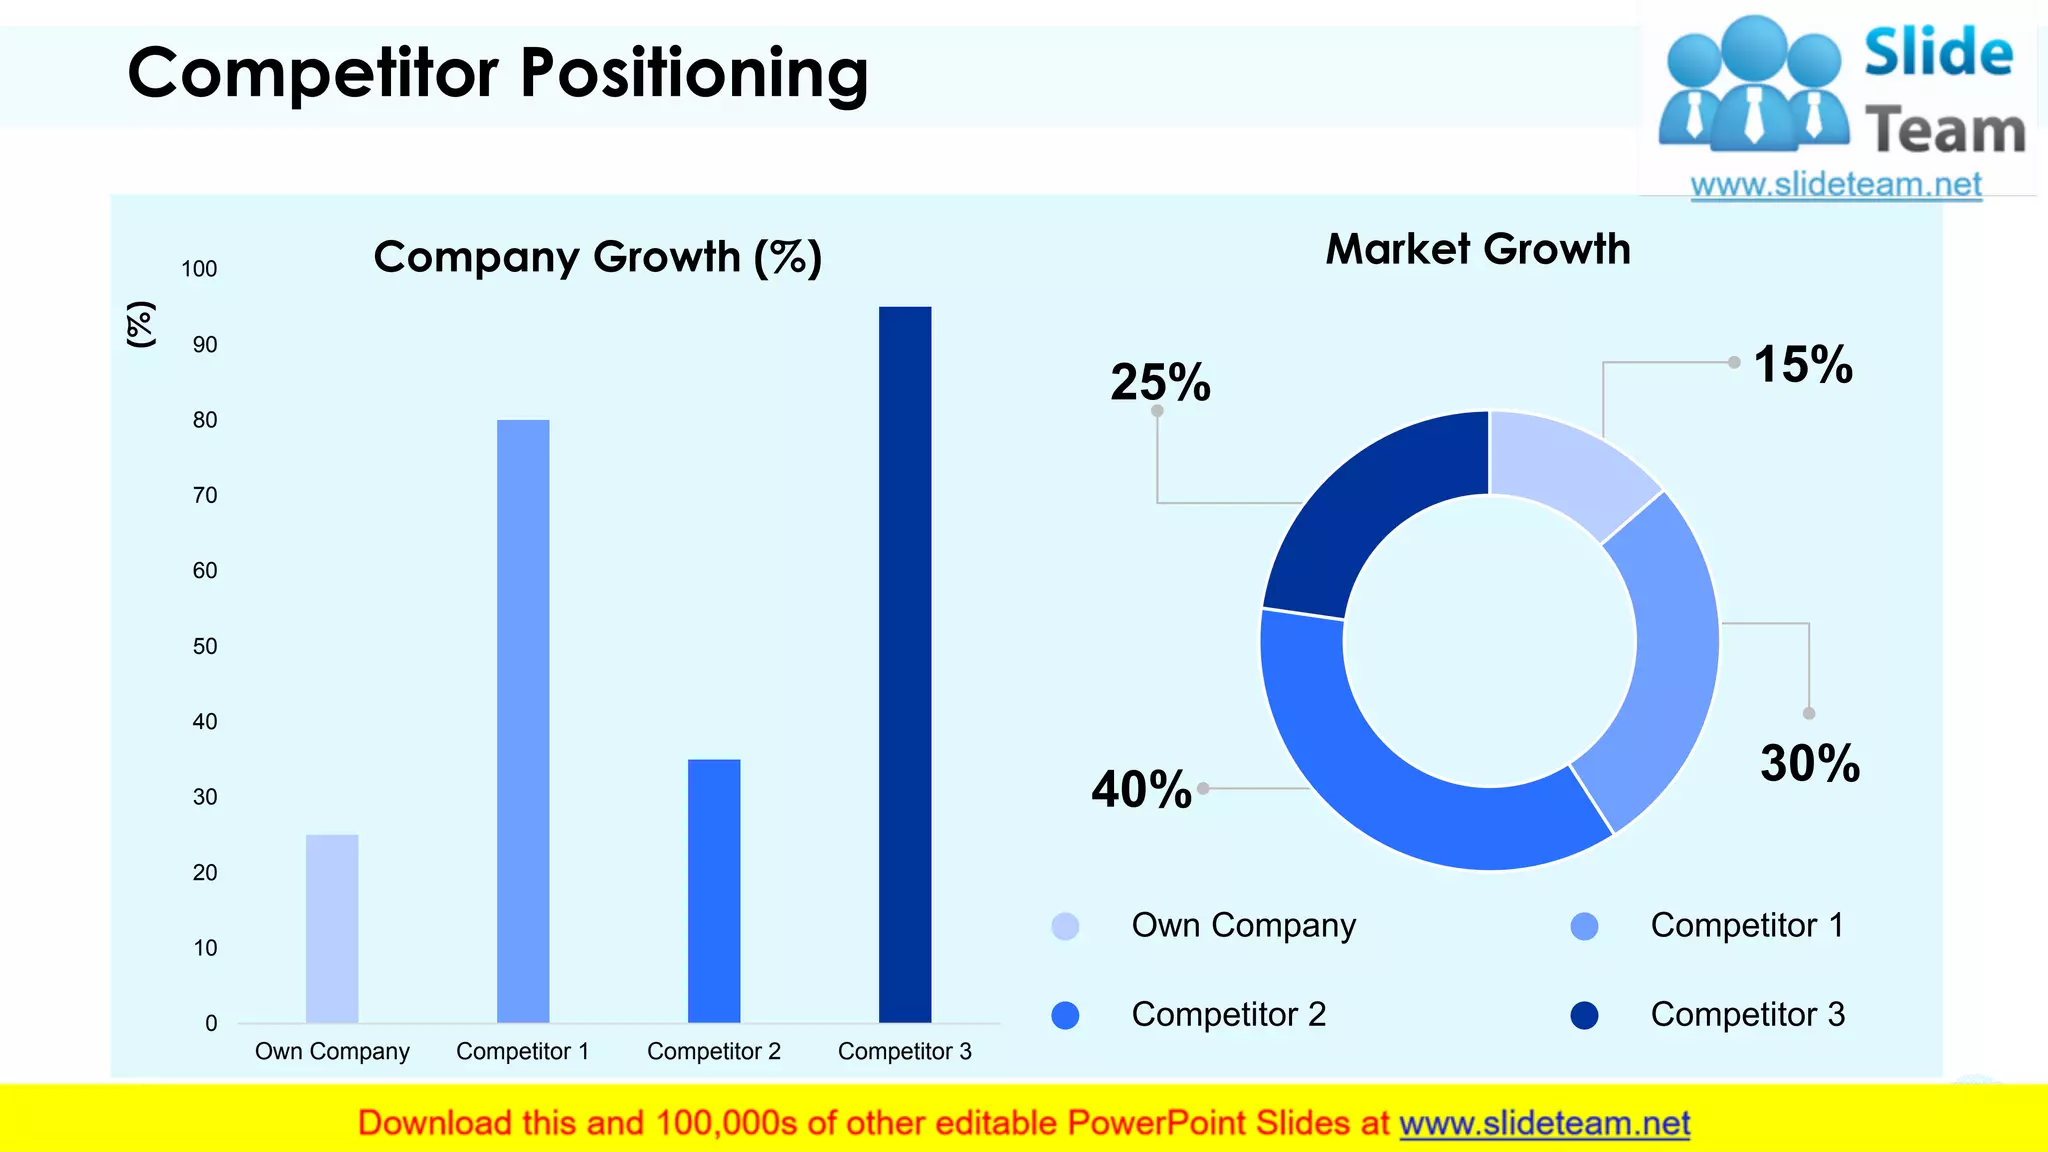
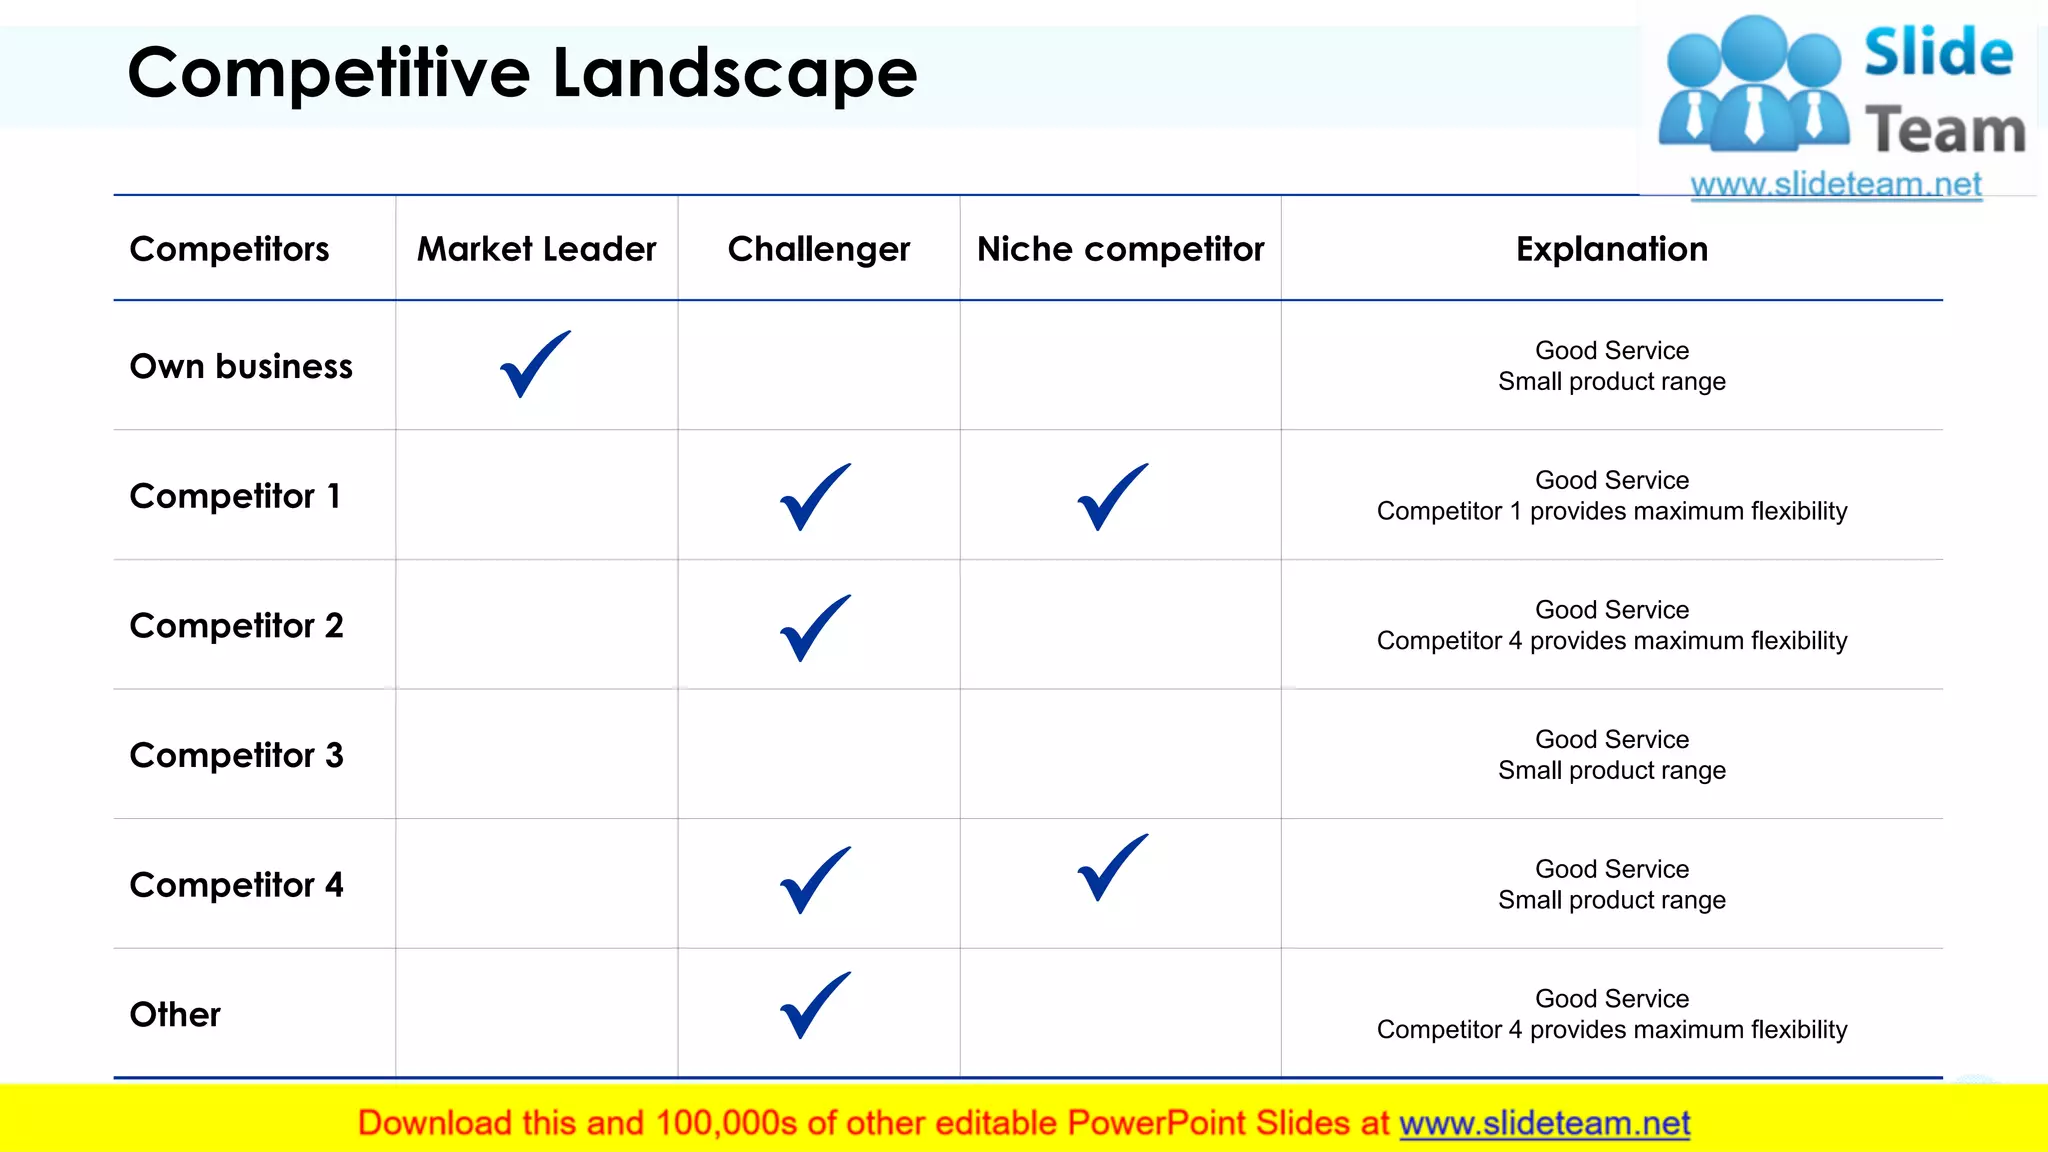
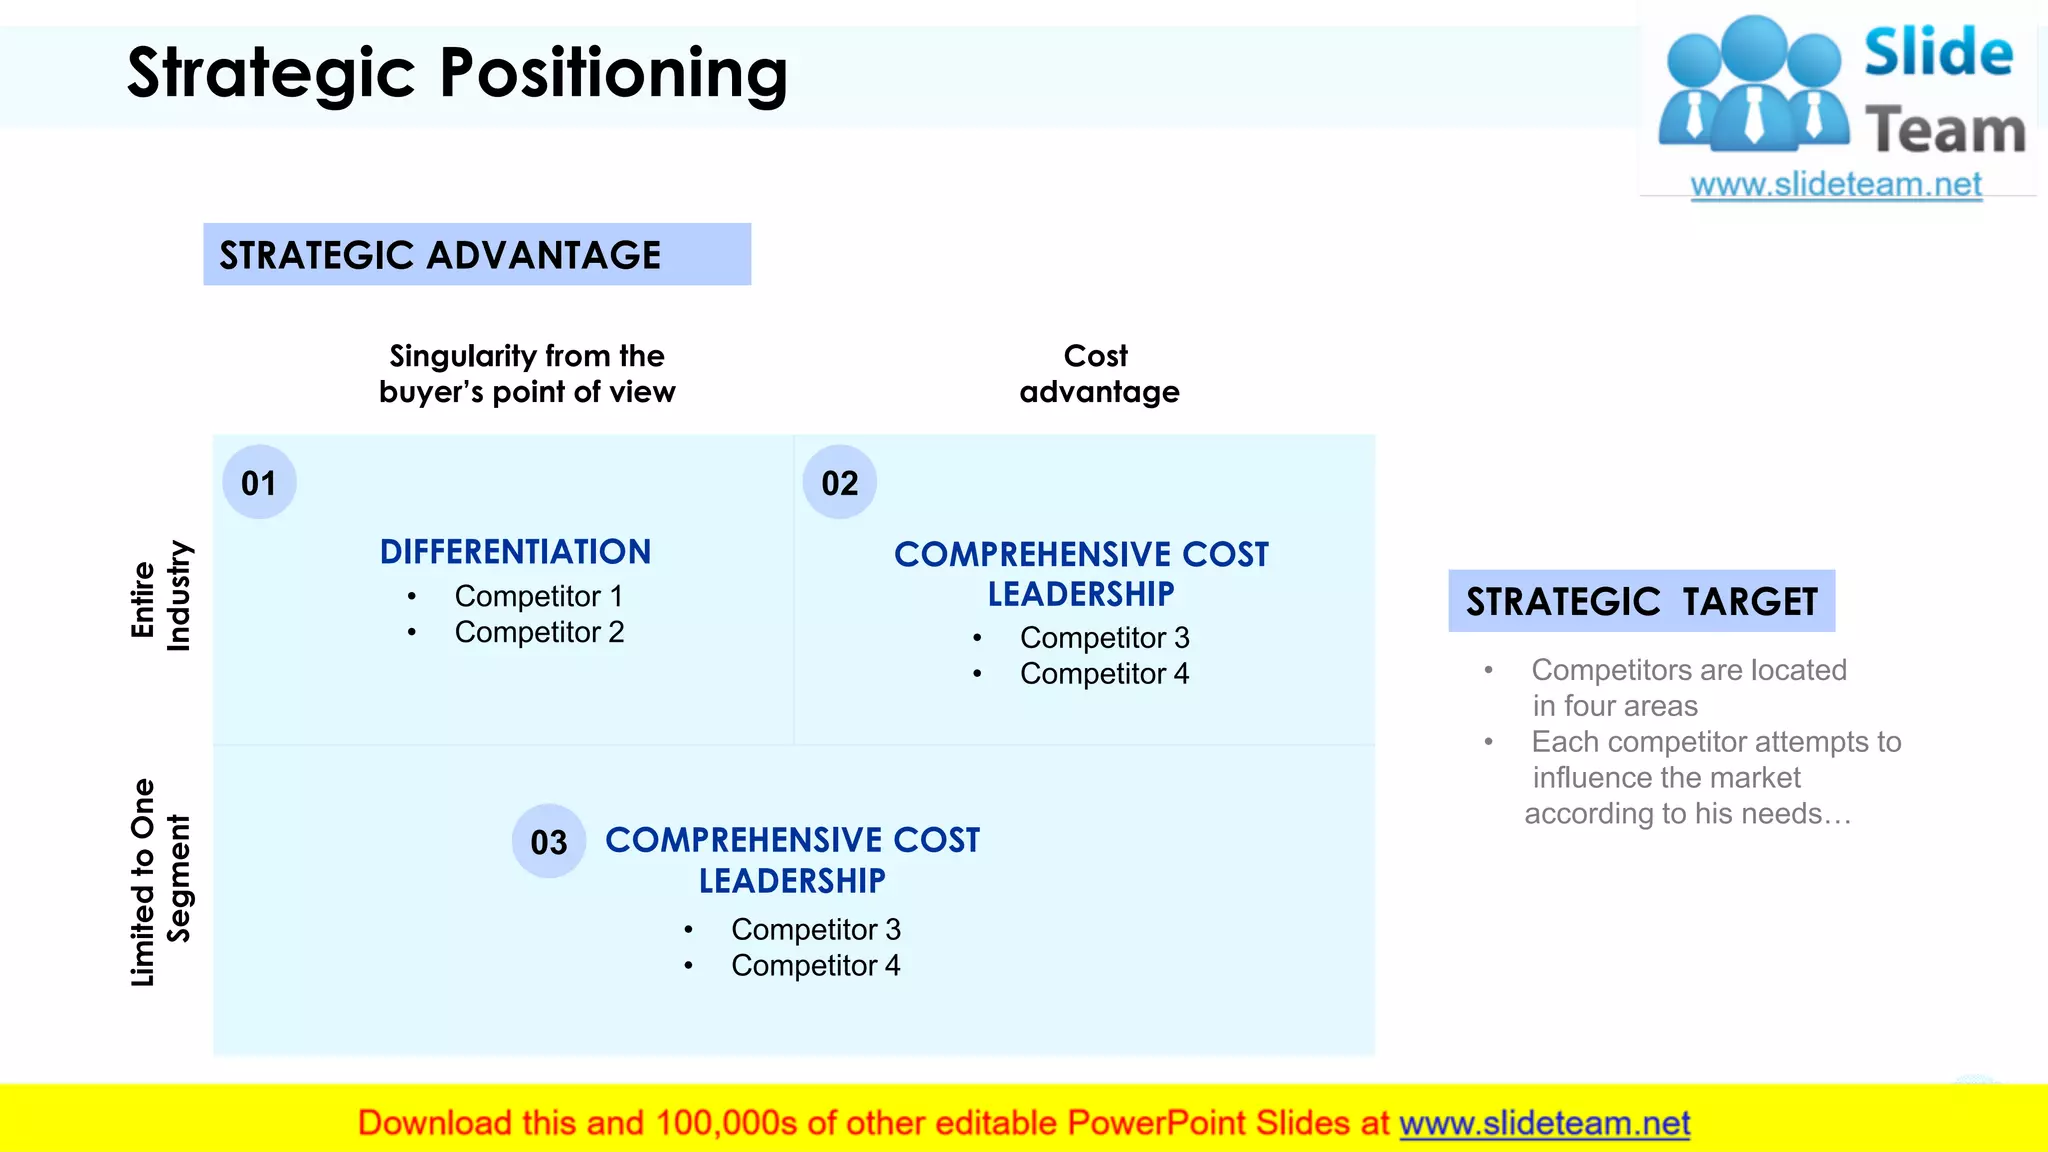


The document discusses strategic positioning for companies. It covers topics like market positioning, differentiation, target segments, positioning strategies for different sectors, competitive landscape analysis, and product positioning maps. Specific strategies discussed include benefit, surrogate, corporate identity, category, user, application, quality/price, and attribute-based positioning. Metrics like competitive advantage, company standing, and ability to improve standing are evaluated for recommended strategic actions.


