Downloaded 24 times

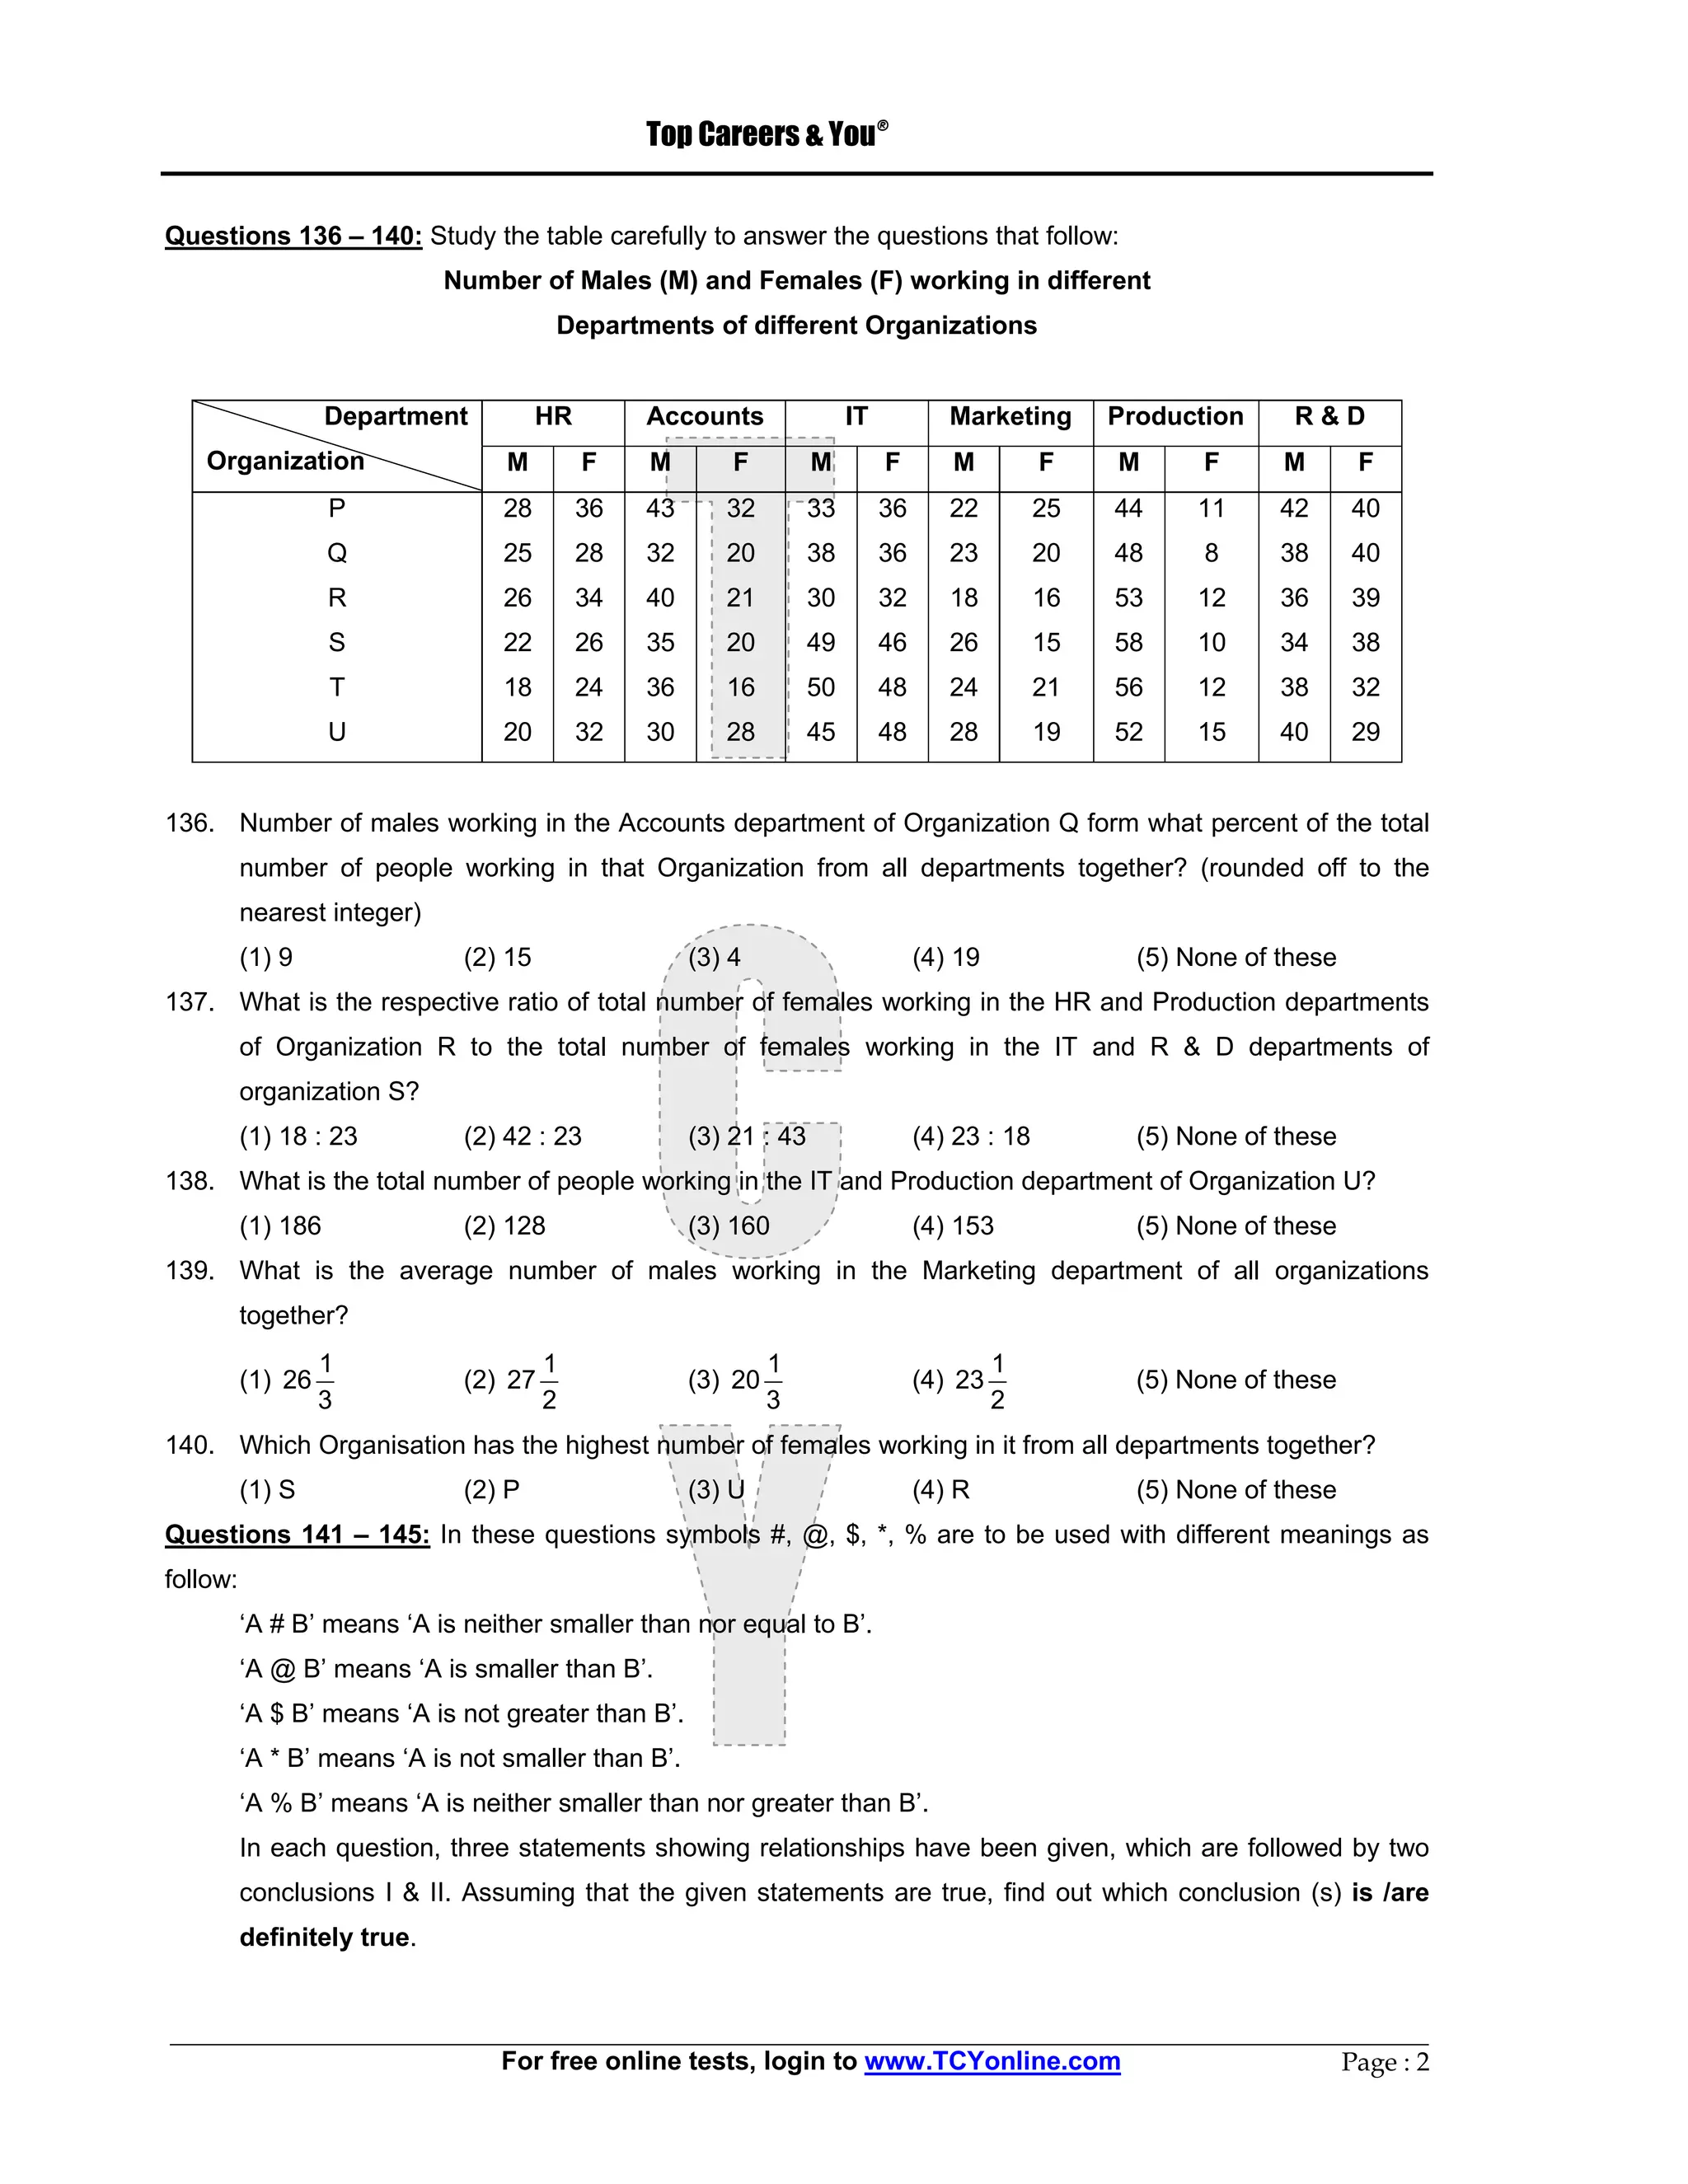


This document contains a graph showing the percentage increase in profit of three companies (Company A, B, and C) over the years from 2002 to 2007. It also contains a table showing the number of males and females working in different departments of different organizations. There are then several multiple choice questions related to analyzing and interpreting the data presented in the graph and table.