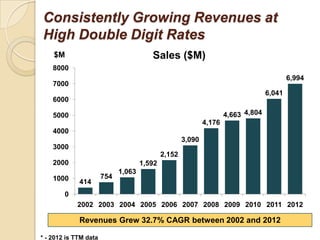
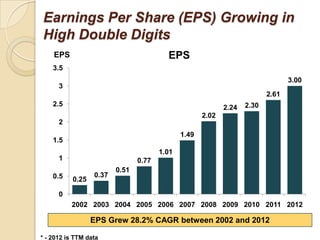
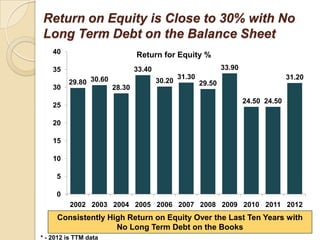
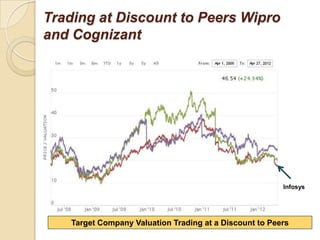
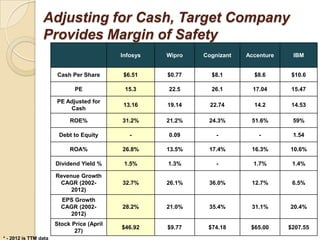
Infosys
Consistently Growing Revenues at
High Double Digit Rates
    $M                                  Sales ($M)
    8000
                                                                                           6,994
    7000
                                                                                   6,041
    6000

    5000                                                             4,663 4,804
                                                             4,176
    4000
                                                     3,090
    3000
                                             2,152
    2000                             1,592
                             1,063
    1000               754
             414
        0
            2002 2003 2004 2005 2006 2007 2008 2009 2010 2011 2012

             Revenues Grew 32.7% CAGR between 2002 and 2012

* - 2012 is TTM data
Earnings Per Share (EPS) Growing in
High Double Digits
    EPS                                  EPS
    3.5
                                                                                 3.00
      3
                                                                          2.61
    2.5                                                     2.24   2.30
                                                     2.02
      2
                                              1.49
    1.5
                                       1.01
      1                         0.77
                         0.51
    0.5           0.37
           0.25

      0
          2002 2003 2004 2005 2006 2007 2008 2009 2010 2011 2012

                  EPS Grew 28.2% CAGR between 2002 and 2012

* - 2012 is TTM data
Return on Equity is Close to 30% with No
Long Term Debt on the Balance Sheet
    40                         Return for Equity %
    35                         33.40                           33.90
                                               31.30                                 31.20
         29.80 30.60                   30.20           29.50
    30                 28.30
                                                                       24.50 24.50
    25

    20

    15

    10

     5

     0
          2002 2003 2004 2005 2006 2007 2008 2009 2010 2011 2012
     Consistently High Return on Equity Over the Last Ten Years with
                    No Long Term Debt on the Books
* - 2012 is TTM data
Trading at Discount to Peers Wipro
and Cognizant


                                                         Infosys


    Target Company Valuation Trading at a Discount to Peers
Adjusting for Cash, Target Company
                 Provides Margin of Safety
                                            Infosys   Wipro   Cognizant   Accenture    IBM


                        Cash Per Share      $6.51     $0.77     $8.1        $8.6       $10.6

                              PE             15.3     22.5      26.1        17.04      15.47

                       PE Adjusted for
                                            13.16     19.14     22.74       14.2       14.53
                           Cash

                            ROE%            31.2%     21.2%    24.3%       51.6%       59%

                        Debt to Equity         -      0.09        -           -        1.54

                            ROA%            26.8%     13.5%    17.4%       16.3%      10.6%

                       Dividend Yield %      1.5%     1.3%        -         1.7%       1.4%

                       Revenue Growth
                        CAGR (2002-         32.7%     26.1%    36.0%       12.7%       6.5%
                            2012)
                         EPS Growth
                         CAGR (2002-        28.2%     21.0%    35.4%       31.1%      20.4%
                           2012)
                       Stock Price (April
                                            $46.92    $9.77    $74.18      $65.00     $207.55
                              27)
* - 2012 is TTM data

Infosys

  • 1.
  • 2.
    Consistently Growing Revenuesat High Double Digit Rates $M Sales ($M) 8000 6,994 7000 6,041 6000 5000 4,663 4,804 4,176 4000 3,090 3000 2,152 2000 1,592 1,063 1000 754 414 0 2002 2003 2004 2005 2006 2007 2008 2009 2010 2011 2012 Revenues Grew 32.7% CAGR between 2002 and 2012 * - 2012 is TTM data
  • 3.
    Earnings Per Share(EPS) Growing in High Double Digits EPS EPS 3.5 3.00 3 2.61 2.5 2.24 2.30 2.02 2 1.49 1.5 1.01 1 0.77 0.51 0.5 0.37 0.25 0 2002 2003 2004 2005 2006 2007 2008 2009 2010 2011 2012 EPS Grew 28.2% CAGR between 2002 and 2012 * - 2012 is TTM data
  • 4.
    Return on Equityis Close to 30% with No Long Term Debt on the Balance Sheet 40 Return for Equity % 35 33.40 33.90 31.30 31.20 29.80 30.60 30.20 29.50 30 28.30 24.50 24.50 25 20 15 10 5 0 2002 2003 2004 2005 2006 2007 2008 2009 2010 2011 2012 Consistently High Return on Equity Over the Last Ten Years with No Long Term Debt on the Books * - 2012 is TTM data
  • 5.
    Trading at Discountto Peers Wipro and Cognizant Infosys Target Company Valuation Trading at a Discount to Peers
  • 6.
    Adjusting for Cash,Target Company Provides Margin of Safety Infosys Wipro Cognizant Accenture IBM Cash Per Share $6.51 $0.77 $8.1 $8.6 $10.6 PE 15.3 22.5 26.1 17.04 15.47 PE Adjusted for 13.16 19.14 22.74 14.2 14.53 Cash ROE% 31.2% 21.2% 24.3% 51.6% 59% Debt to Equity - 0.09 - - 1.54 ROA% 26.8% 13.5% 17.4% 16.3% 10.6% Dividend Yield % 1.5% 1.3% - 1.7% 1.4% Revenue Growth CAGR (2002- 32.7% 26.1% 36.0% 12.7% 6.5% 2012) EPS Growth CAGR (2002- 28.2% 21.0% 35.4% 31.1% 20.4% 2012) Stock Price (April $46.92 $9.77 $74.18 $65.00 $207.55 27) * - 2012 is TTM data