Data Interpretation Test
•
50 likes•27,174 views

This document contains a test with 20 multiple choice questions about interpreting data from tables, graphs, and charts. The test questions cover topics such as analyzing expenditures and production amounts for different companies over time, comparing income and expenditures for a company in different years based on a graph, and calculating costs and prices based on percentages given in a pie chart.

More Related Content
Similar to Data Interpretation Test
Similar to Data Interpretation Test (20)
Recently uploaded
Recently uploaded (20)
Data Interpretation Test
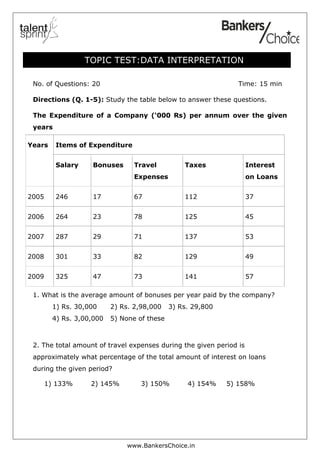
- 1. www.BankersChoice.in No. of Questions: 20 Time: 15 min Directions (Q. 1-5): Study the table below to answer these questions. The Expenditure of a Company (‘000 Rs) per annum over the given years Years Items of Expenditure Salary Bonuses Travel Expenses Taxes Interest on Loans 2005 246 17 67 112 37 2006 264 23 78 125 45 2007 287 29 71 137 53 2008 301 33 82 129 49 2009 325 47 73 141 57 1. What is the average amount of bonuses per year paid by the company? 1) Rs. 30,000 2) Rs. 2,98,000 3) Rs. 29,800 4) Rs. 3,00,000 5) None of these 2. The total amount of travel expenses during the given period is approximately what percentage of the total amount of interest on loans during the given period? 1) 133% 2) 145% 3) 150% 4) 154% 5) 158% TOPIC TEST:DATA INTERPRETATION
- 2. www.BankersChoice.in 3. Total expenditure on all these items in 2006 was approximately what percent of the total expenditure in 2008? 1)93% 2)90% 3)87% 4)83% 5) 79% 4. Which type of expenditure is always increasing over the given period? 1) Salary and Bonuses 2) Travel Expenses 3) Taxes 4) Interest on Loans 5) None of these 5. What is the ratio between the total amount of travel expenses of 2006 and 2008 to the salary of 2009? 1) 1 : 2 2) 2 : 1 3) 3 : 2 4) 65 : 32 5) 32 : 65 Directions (Q. 6-10): Study the data below to answer these questions. Production of Paper (in lakh tonnes) by three Companies X, Y and Z over the Years 6. For which of the following years, the percentage rise/fall in production from the previous year is the maximum for Company Y? 1)1997 2)1998 3)1999 4)2000 5) None of these 7.What is the ratio of the average production of Company X in the period 1998-2000 to the average production of Company Y in the same period? 1)1:1 2)15:17 3)23:25 4)27:29 5) None of these
- 3. www.BankersChoice.in 8. The average production for five years was maximum for which company? 1)X 2)Y 3)Z 4)X and Z both 5) None of these 9. In which year was the percentage of production of Company Z to the production of Company Y the maximum? 1)1996 2)1997 3)1998 4)1999 5) None of these 10.What is the percentage increase in the production of Company Y from 1996 to 1999? 1)30% 2)45% 3)50% 4)60% 5) None of these Directions (Q. 11 - 15): Study the following graph carefully and answer the questions given below it. Income and Expenditure of a Company over the years (Rs. in crore) 11. In which of the following years was the difference between the income and the expenditure the maximum? 1) 1988 2) 1991 3) 1986 4) 1987 5) none of these 12. The income in 1987 was equal to the expenditure in which of the following years? 1) 1985 only 2) 1990 only 3) 1985, 1989 and 1991 4) 1988 and 1989 5) None of these
- 4. www.BankersChoice.in 13. What was the approximate percentage drop in expenditure from 1988 to 1989? 1) 35 2) 25 3) 75 4) 40 5) None of these 14. What was the percentage increase in income from 1987 to 1988? 1) 175 2) 75 3) 60 4) 125 5) None of these 15. In how many of the given years was the expenditure more than the income? 1) 1 2) 3 3) 4 4) 2 5) None of these Directions (16-20): Study the data below to answer these questions. The pie chart given below shows the expenditure incurred in bringing out a book, by a publisher. 16. What is the central angle showing the cost of paper? 1) 16° 2) 32° 3) 28 . 8° 4) 57.6° 5) None of these 17. If the cost of printing is Rs. 23400, the royalty is: 1) Rs.6500 2) Rs.2340 3) Rs.4680 4) Rs.7840 5)None of these 18. If miscellaneous expenditures amount to Rs.18000, the expenditure on canvassing will be: 1) Rs. 8000 2) Rs. 14400 3) Rs. 46800
- 5. www.BankersChoice.in 4) Rs. 40500 5) None of these 19. Royalty on the book is less than canvassing expenditure by: 1) 8% 2) 80% 3) 44.44% 4) 46% 5) None of these 20. If 5500 copies are published and miscellaneous expenditures amount to Rs. 36960 and the marked price is 40% above cost price, then the marked price of each copy is: 1) Rs.122.50 2) Rs.117.60 3) Rs.126.40 4) Rs.92.40 5) None of these