Download to read offline


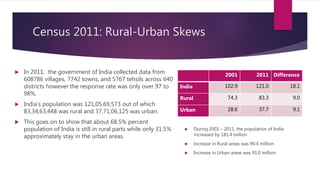
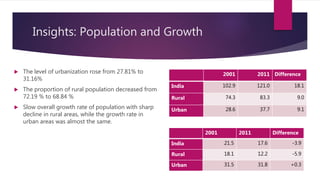
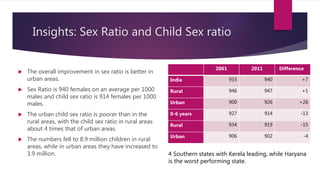
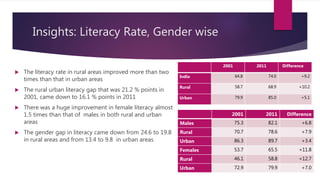


The document provides insights from India's 2011 Census, revealing that 68.5% of the population resides in rural areas while urbanization has increased to 31.16%. Key findings include an improvement in literacy rates, especially among females, and a concerning decline in the child sex ratio in urban areas compared to rural. The document also highlights demographic trends, with significant population increases in both rural and urban areas over the past decade.


