This document provides financial information for First Commonwealth Financial Corp for 2010-2018. It includes income statements, balance sheets, and cash flow statements. Some key highlights are:
- Revenues declined from 2010 to 2011 due to decreases in loans/leases and securities income. Noninterest revenue grew 18% from 2011 to 2012.
- Interest expenses declined 32% from 2010 to 2011 as deposit and borrowing costs fell.
- Net income declined from $23 million in 2010 to $15 million in 2011, a decrease of 40%. Earnings per share also fell 40% over this period.
- Total assets grew slightly from 2010 to 2011 but have increased each year since, reaching $7.1 billion by
This Slideshare presentation is a partial preview of the full business document. To view and download the full document, please go here:
http://flevy.com/browse/business-document/excel-model-of-trading-firm-1067
DESCRIPTION
Valuation of trading firm which is outsource major percentage of manufacturing to third party vendors.
In this valuation methodology we would primarily look into brand equity and relative valuation compared to its peers
Lincoln Crowne Weekly Engineering & Mining Services Report for date ended 30th August 2013. Reporting season is well under way now with the surprises and disappointments continuing.
Lincoln crowne engineering mining services 30 august 2013Nick Assef
Latest weekly research from LCC on the Australian engineering & mining services sector. Reporting season has produced some interesting results thus far, with a clearly mixed view on the expectations on the performance of the sector over the coming 12 months
This Slideshare presentation is a partial preview of the full business document. To view and download the full document, please go here:
http://flevy.com/browse/business-document/excel-model-for-valuation-of-natural-gas-firm-1138
DESCRIPTION
This is an valuation model of Petronet LNG. This model covers the different valuation types to arrive at the fair value of a stock.
Lincoln Crowne's Weekly Report on the Australian Engineering & Mining Services Sectors. Particular focus on the developments in certain sector competitors experienced over the last week.
Ishac Diwan - Harvard University
Jamal Ibrahim Haidar - Harvard University
ERF Seminar on The Political Economy of the Private Sector in the Middle East
Marrakech, Morocco, December 21-22, 2016
www.erf.org.eg
Highlights of Changes in Direct & Indirect Taxes in 2016-2017 budget
Direct Tax include Income tax,CHANGES IN INDIRECT TAXES - (CUSTOMS ACT, 1962 ,CENTRAL EXCISE ACT, 1944 ,AMENDMENTS IN SERVICE TAX )
this is description of UPFL and its valuation through FCF model. It is all about Finance. Also Ratio Analysis is included in it.Anyone can find and because it is about Financial management.
The Fiancial model of Nestle India Ltd Include:
- Income Statement, Balance sheet, Cash Flow Statement
- Ratio Analysis
- Scenerio Analysis
- WACC calculation
- Discounted Cash Flow Model
- Financial Dashboard etc,
**Disclaimer: This financial model only for education purpose not for any investment/trade recommendation.
please due your own due diligence before investment/trade in financial market.
Presentation on Private Equity Valuation of Bkash. This presentation was performed for a National Financial Modeling Competition called " Blueprints," organized by NSU Finance Club
Financial Modelling Videos (Fimovi) enables its customers to develop flexible and robust financial plans and cashflow models based on Microsoft Excel. Fimovi provides a broad range of financial modelling related services for clients across many industry sectors. http://www.excel-financial-model.com/
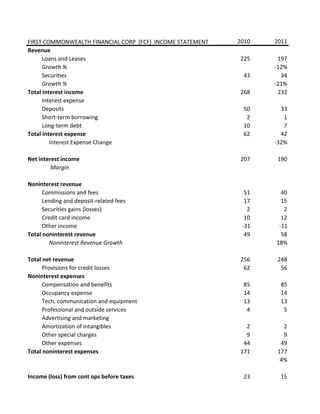
1. 2010 2011
Revenue
Loans and Leases 225 197
Growth % -12%
Securities 43 34
Growth % -21%
Total interest income 268 232
Interest expense
Deposits 50 33
Short-term borrowing 2 1
Long-term debt 10 7
Total interest expense 62 42
Interest Expense Change -32%
Net interest income 207 190
Margin
Noninterest revenue
Commissions and fees 51 40
Lending and deposit-related fees 17 15
Securities gains (losses) 2 2
Credit card income 10 12
Other income -31 -11
Total noninterest revenue 49 58
Noninterest Revenue Growth 18%
Total net revenue 256 248
Provisions for credit losses 62 56
Noninterest expenses
Compensation and benefits 85 85
Occupancy expense 14 14
Tech, communication and equipment 13 13
Professional and outside services 4 5
Advertising and marketing
Amortization of intangibles 2 2
Other special charges 9 9
Other expenses 44 49
Total noninterest expenses 171 177
4%
Income (loss) from cont ops before taxes 23 15
FIRST COMMONWEALTH FINANCIAL CORP (FCF) INCOME STATEMENT
2. Provision (benefit) for taxes 0 0
Effective Tax Rate 0% 0%
Net income 23 15
9% 6%
Net income available to common shareholders 23 15
Earnings per share
Diluted 0.25 0.15
EPS Growth -40%
Weighted average shares outstanding
Diluted 93 105
Dividened Discount Model
Net Income per share 0.25 0.15
Dividends 0.05 0.12
% Growth 130%
ROE 3.07% 1.98%
**Fiscal year ends in December. USD in millions except per share data.
5. FIRST COMMONWEALTH FINANCIAL CORP 2010 2011 2012
DIVIDEND DISCOUNT MODEL
Net Income per share 0.25 0.15 0.4
% Growth -40% 167%
Dividends 0.05 0.12 0.18
% Growth 130.3% 47.6%
Payout Ratio 21.5% 82.5% 45.7%
PV of Dividends
Terminal Value
DDM VALUATION
PV of dividends 0.95
PV of Terminal Value 6.96
Target price 7.92
Current 8.92
Upside -11%
* in dollars
Bear
Base
Bull
Weighted average shares outstanding
Diluted 93 105 104
6. 2013 2014 2015 2016 2017 2018
0.43 0.48 0.56 0.59 0.61 0.63
7% 12% 17% 6% 3% 3%
0.23 0.28 0.28 0.28 0.33 0.35
24.1% 23.3% 0.1% -0.3% 16.7% 7.1%
52.7% 58.2% 49.9% 47.1% 53.4% 55.8%
0.28 0.33 0.35
5.20
P/E MULTIPLE VALUTATION P/B MULTIPLE VALUTATION
TV of P/E 10.63 TV of P/B 1033.16
PV of TV 14.23 PV of TV 943.14
Sum of PV of Div. 0.95 Per Share 10.97
Target Price 15.18 Target Price 11.92
Current 8.92 Current 8.92
Upside 70% Upside 34%
Implied P/B Implied P/E Price Upside
1 15 10 15%
1.2 16 11 25%
1.3 17 12 31%
97 93 89 86 86 86
13. 2010 2011
Cash Flows From Operating Activities
Net income 23 15
Provision for credit losses 62 56
Depreciation & amortization 11 9
Depreciation/Amortization of Overall Revenue 3% 3%
Deferred tax (benefit) expense -5 -1
Investments (gains) losses 9 10
Receivable 4 1
Prepaid expenses 7 5
Payables 2 -5
Accrued liabilities -1 -1
Interest payable -1 -1
Income taxes payable 2 -5
Other assets and liabilities 4 8
Other operating activities -5 -6
Net cash provided by operating activities 111 84
Cash Flows From Investing Activities
Sales/maturity of investments 591 557
Purchases of investments -387 -724
Changes in loans, net 335 62
Acquisitions and dispositions
Property, and equipments, net -5 -8
Other investing activities 9 33
Net cash used for investing activities 543 -80
Cash Flows From Financing Activities
Change in deposits 82 -113
Change in federal funds purchased -92 62
Change in short-term borrowing -679 62
Long-term debt issued 50 30
Long-term debt repayment -117 -25
Common stock issued 88 0
Repurchases of treasury stock 0 0
Cash dividends paid -5 -13
Other financing activities 0 0
Net cash provided by (used for) financing activities -673 4
Net change in cash -20 9
Cash at beginning of period 90 70
Cash at end of period 70 78
FIRST COMMONWEALTH FINANCIAL CORP (FCF) Statement of CASH FLOW
17. 2011 % Total
Commercial, financial, agricultural and other 996,739 25%
Real estate construction 76,564 2%
Residential real estate 1,137,059 28%
Commerical real estate 1,267,432 31%
Loans to individuals 565,849 14%
Total loans & leases net of unearned income 4,043,643
Loans and Leases Interest Income 197,000
Average Interest Rate 4.87%
2011
Total Securities 1,182,572
Total Securities Interest Income 34,000
Average Interest Rate 2.88%
2011
Total Interest Bearing Deposits 3,724,307
Total Interest Expense on Deposits 33,000
Average Interest Rate 0.89%
Average Interest Earning Assets 8,640
Interest-bearing deposits with banks 0% 40,459
Tax-free Investment securities 1% 1,248,689
Taxable Investment Securities 21% 4,553,634
Loans, net of unearned income 78% 5,851,422
FIRST COMMONWEALTH FINANCIAL CORP LOAN MIX
0%1%
21%
78%
Interest-
bearing
deposits with
banks
Tax-free
Investment
securities
27. 2011 2012 2013 2014
Charge-offs as a % of total loans 1.51% 0.35% 0.76% 0.31%
Income Statement Highlights2014 Q4 2015 Q4 % Change
Net Interest Margin 3.27% 3.28% 0.3%
ROA 0.71% 0.78% 10%
ROE 6.18% 6.98% 13%
Net Income 44,453 50,143 13%
Diluted Earnings per Share 0.48 0.56 17%
Key Ratios 2011 2012 2013 2014
Return on average assets 0.27 0.71 0.68 0.71
Return on average equity 2 5.46 5.7 6.18
Net loans to deposits ratio 88.7 90.78 91.87 102.08
Dividends per share as a % of new income per share82.26 44.57 53.49 58.33
Average equity to avergae assets ratio 13.133 12.95 11.87 11.45