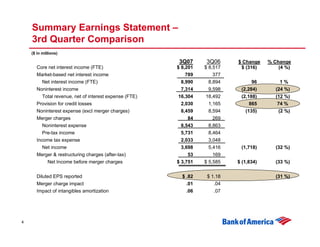
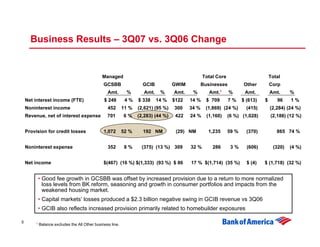
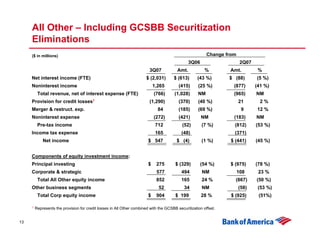
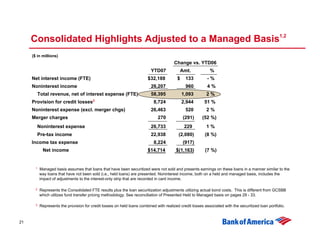
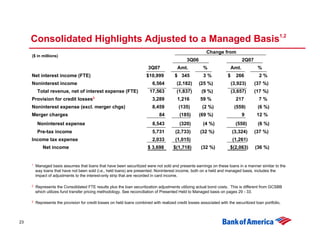
- Bank of America reported third quarter 2007 results with net income of $3.7 billion, down 32% from the third quarter of 2006. Earnings per share were $0.82.
- Revenues declined 12% due to a 24% drop in noninterest income driven by losses in Global Corporate and Investment Banking from market turbulence.
- The provision for credit losses increased 74% to $2.03 billion reflecting increased consumer loan loss rates and impacts from the weakened housing market.
- Bank of America reported third quarter 2006 results with total revenue of $18.961 billion, an 11% increase from third quarter 2005, and net income of $5.416 billion, a 20% increase.
- Net interest income was $8.894 billion, a 1% increase, impacted by the sale of Brazilian operations and prior year FAS 133 impact. Noninterest income increased 20% to $10.067 billion.
- Global Consumer & Small Business Banking reported net income of $2.889 billion, a 13% increase, driven by increases in cards, deposits, and debit purchase volume.
Bank of America reported record earnings of $16.9 billion for 2005, up 19% from 2004. Revenue grew 9% to $57.6 billion driven by a 19% increase in noninterest income. Earnings were driven by strong consumer growth and commercial lending recovery, despite higher provision costs and fewer securities gains. For the fourth quarter of 2005, earnings were $3.8 billion, down 9% from the previous quarter due to an 8% decline in noninterest income and a 21% rise in provision for credit losses.
Bank of America reported second quarter 2007 results. Net income was $5.8 billion, up 4% from the previous year. Revenue increased 8% due to strong noninterest income growth across all business lines. Credit quality remained sound although provision expenses increased due to reserve builds. The company continued to see increases in deposits, assets under management, retail sales and checking account openings.
Bank of America reported first quarter 2007 results with key highlights as follows:
- Earnings of $5.3 billion and diluted EPS of $1.16, up 8% from first quarter 2006.
- Total revenue grew 3% to $18.4 billion compared to first quarter 2006, driven by a 10% increase in noninterest income, though net interest income declined 5%.
- Credit quality remained sound though provision expenses increased 23% compared to first quarter 2006 as credit costs trend toward more normal levels.
- Global Wealth and Investment Management saw client assets reach new highs of $547 billion and added over 500 premier banking sales associates over the past year.
This document summarizes Viacom's financial results for the second quarter and first half of 2008. Key highlights include:
- Revenues for Q2 2008 increased 21% to $3.9 billion and increased 18% to $7 billion for the first half.
- Operating income for Q2 2008 increased 13% to $792 million and increased 19% to $1.4 billion for the first half.
- Earnings per share from continuing operations for Q2 2008 increased 2% to $0.64 and increased 15% to $1.06 for the first half.
- Media Networks revenues increased 11% in Q2 2008 and 14% for the first half, driven by increases in affiliate fees
- Bank of America reported second quarter 2006 results, with net income of $5.58 billion excluding merger charges, up 4% from the second quarter of 2005.
- The Global Consumer & Small Business Bank saw strong growth, with net income up 42% to $3.11 billion driven by increases in cards and deposits.
- The Global Corporate & Investment Bank reported net income of $1.72 billion, flat compared to the second quarter of 2005.
This document provides a summary of Fannie Mae's financial results for the first quarter of 2008. Some key points:
- Fannie Mae reported a net loss of $2.2 billion for the quarter, an improvement from a $3.6 billion loss in the previous quarter. Revenues grew but losses on investments and derivatives also increased.
- Credit losses rose to $3.2 billion due to higher mortgage defaults and loss severities from falling home prices and economic weakness.
- Fannie Mae plans to raise $6 billion in new capital through stock offerings to maintain a strong balance sheet and provide stability in the mortgage market.
- Management is focusing on tightening lending standards and mitigating
This document summarizes Viacom's financial results for the third quarter of 2008. Revenues increased 4% year-over-year to $3.4 billion. Operating income decreased 15% to $689 million due to an 11% increase in expenses. Adjusted net earnings decreased 22% to $339 million, while adjusted diluted EPS decreased 15% to $0.55. Free cash flow was $564 million for the quarter compared to a significant decrease year-to-date. Total debt was $8.95 billion as of September 30, 2008, while cash on hand was $525 million.
Bank of America reported record first quarter 2006 earnings of $5 billion, up 14% from the same period in 2005. Net income grew 1% excluding merger charges. Total revenue increased 10% driven by a 55% rise in market sensitive revenue and 5% growth in other revenue. Expenses grew 5% while operating leverage was positive at 5%. The financial results reflected strong performance across global consumer and small business banking and card services.
American Express Earnings Conference Call 4Q’08earningsreport
American Express reported financial results for 4Q 2008. Total revenues declined 11% to $6.5 billion due to decreases in billed business, cardmember spending, and interest income. Income from continuing operations declined 72% to $238 million and diluted EPS declined 71% to $0.21. Significant charges in 4Q 2008 included a $273 million reengineering charge and a $66 million Delta reserve increase. Metrics such as billed business, cardmember loans, and travel sales were down across all segments. The company emphasized strengthening its capital position and improving liquidity.
- Bank of America reported third quarter 2008 results, with earnings impacted by the challenging economic environment and market disruptions.
- Net income was $1.2 billion, down from the prior year due to higher credit costs from housing price declines and rising unemployment.
- Results also reflected charges related to financial institution failures, cash fund support, and losses on trading positions.
- Countrywide results were included for the first time, adding $259 million to earnings. Integration is proceeding as planned.
JPMorgan Chase Second Quarter 2008 Financial Results Conference Callfinance2
The document reports JPMorgan Chase's financial results for the second quarter of 2008. It notes a net income of $2 billion, excluding $540 million in losses from Bear Stearns merger-related items. It also discusses increasing credit reserves, markdowns on leveraged lending and mortgage positions, and the completed acquisition of Bear Stearns on May 30, 2008. For the Investment Bank specifically, it provides revenue and net income numbers and notes strong performance in some areas but markdowns on leveraged lending and mortgage-related positions.
Danaher Corporation reported financial results for the fourth quarter and full year of 2007. Net earnings for Q4 2007 were $320 million, or $0.97 per diluted share. For the full year 2007, net earnings were $1.37 billion, or $4.19 per diluted share. Sales for Q4 2007 were $3.14 billion, a 19.5% increase over Q4 2006. For the full year 2007, sales were $11.03 billion, a 16.5% increase over 2006. The company's president stated they were pleased with the record results and remain confident in their ability to deliver again in 2008 despite softness in some end markets.
United Health Group UnitedHealth Group Financial Reviewfinance3
UnitedHealth Group reported strong financial results in 2003 with revenues increasing 15% to $28.8 billion and earnings from operations growing 34% to $2.9 billion. Net earnings grew 35% to $1.8 billion resulting in diluted EPS of $2.96. The results were driven by revenue growth across all business segments, improved margins on risk-based products, and a shift toward higher-margin fee-based services. Looking ahead, the company expects continued growth from increasing premium rates, expanding into new geographies and services, and pursuing additional acquisitions.
Bank of America reported third quarter 2005 results with the following key points:
1) Diluted EPS was up 12% year-over-year but down 4% quarter-over-quarter due to higher credit costs and lower securities gains.
2) Revenue grew 16% year-over-year and 4% quarter-over-quarter driven by strong growth across all business segments.
3) Credit costs increased from very low levels in previous quarters as charge-offs moved off recent lows.
Danaher Corporation announced record third quarter results for 2008. Net earnings from continuing operations increased 11% to $372 million compared to $335 million in the third quarter of 2007. Sales increased 17.5% to $3.21 billion. For the first nine months of 2008, net earnings from continuing operations increased 13.2% to $1.01 billion compared to $894 million for the same period in 2007. Sales for the first nine months increased 20.5% to $9.51 billion. The company's president stated they delivered strong performance in the quarter and expect to continue outperforming during challenging economic times due to their portfolio of businesses and operational excellence initiatives.
- Aon reported a 6% increase in total revenue and 2% organic revenue growth for Q2 2008. EPS from continuing operations was $0.55.
- Adjusted EPS excluding certain items increased 25% to $0.71, driven by 2% organic revenue growth and margin expansion in brokerage.
- Aon completed sales of CICA and Sterling, generating $2.7B in after-tax proceeds and a $1.4B pretax gain.
This document summarizes the financial performance of a company for the third quarter and first six months of 2007 compared to the same periods in 2006. It shows that net sales increased 8% in the third quarter and 7% for the first six months. Earnings from continuing operations were $92 million in the third quarter and $203 million for the first six months. On a per share basis, diluted earnings from continuing operations were $0.65 per share for the third quarter and $1.41 per share for the first six months. The company's North America segment grew net sales 6% in the third quarter while the International segment grew 17%.
The Clorox Company reported financial results for the second quarter and first half of fiscal year 2009. Net sales increased 3% to $1.216 billion in the quarter and 7% to $2.6 billion in the first six months. Earnings per share were $0.62 for the quarter and $1.52 for the six month period. The North America segment grew net sales 3% to $1.007 billion and earnings 6% to $273 million in the quarter. International sales were flat at $209 million in the quarter but earnings declined 24% to $29 million. Total assets were $4.398 billion against $4.801 billion in total liabilities as of December 31, 2008.
Citigroup reported a 60% decline in third quarter net income to $2.21 billion compared to the prior year. Revenues increased 5% to $22.4 billion driven by 29% growth in international revenues, however this was more than offset by a $2.98 billion increase in credit costs. The revenue growth was primarily due to strong international consumer and wealth management results, while fixed income revenues declined significantly due to losses related to dislocations in the mortgage-backed securities and credit markets. Higher credit costs were the primary driver of the net income decline.
Fifth Third Bancorp reported a net loss for Q2 2008 due to charges related to leveraged leases. Excluding these charges, pre-tax earnings were up 16% year-over-year due to increases in noninterest income and average loans. However, credit costs increased significantly due to deteriorating economic conditions, particularly in real estate loans in Florida and Michigan. In response, Fifth Third raised capital levels and reduced the common dividend to strengthen its position during the economic downturn.
Danaher Corporation announced record results for the second quarter of 2008, with net earnings from continuing operations of $363 million, an 18% increase over the second quarter of 2007. Sales increased 25% to $3.28 billion. The company also saw a 22% increase in adjusted net earnings from continuing operations, which excludes certain charges related to an acquisition. For the first six months of 2008, net earnings from continuing operations were $640 million, up 14.5% compared to the same period in 2007. The company's CEO stated that despite economic conditions, the company's businesses are well positioned for the rest of 2008.
HSBC reported financial results for the first half of 2008. While total operating income increased slightly, pre-tax profits decreased 28% to $10.2 billion due to a 58% rise in loan impairment charges. Net income attributable to shareholders fell 29% to $7.7 billion. However, HSBC maintained a strong capital position with tier 1 and total capital ratios of 8.8% and 11.9% respectively. The company also announced a 6% increase in its interim dividend and the completion of the sale of its regional bank network in France.
Danaher Corporation announced record results for the second quarter and first half of 2005. Net earnings for the second quarter increased 25.5% compared to 2004, and sales increased 19%. For the first six months, net earnings increased 27.5% and sales increased 19%. The company's president stated that growth from existing businesses accounted for 5.5% sales growth in the quarter and that the company saw broad-based strength across its businesses.
CC Media Holdings reported financial results for Q4 and full year 2008. Q4 revenue was $1.6 billion, down 14% year-over-year, and full year revenue was $6.7 billion, down 3%. Operating expenses grew 3% in Q4 and 5% for the full year. The company reported a large net loss of $4.99 billion in Q4 and $4.6 billion for the full year, primarily due to a $5.3 billion impairment charge. OIBDAN (operating income before depreciation and amortization) declined 50% in Q4 to $309 million and 21% for the full year to $1.8 billion. The company also announced
allstate Quarterly Investor Information 2002 4th finance7
Allstate reported their fourth quarter and full year 2002 results. Some key highlights:
- Q4 2002 net income was $447 million, up 69% from Q4 2001. Full year 2002 net income was $1.13 billion, down slightly from 2001.
- Q4 2002 operating income was $618 million, up 100% from Q4 2001. Full year 2002 operating income was $2.08 billion, up from $1.49 billion in 2001.
- Results were driven by increased premiums earned, improved loss frequencies, and increased investment income, partly offset by higher claims severities and catastrophe losses.
- For 2003, Allstate expects operating income per share of $3.20-$3
1) Citi reported a significant year-over-year decline in 4th quarter 2007 earnings, with net income down 83% and EPS down 83% due to losses from sub-prime exposures and increased credit costs.
2) Revenue declined 70% year-over-year in 4Q2007 due to losses from sub-prime exposures in Fixed Income Markets and higher credit costs in U.S. Consumer.
3) Expenses increased 18% year-over-year in 2007, with 9% organic growth and 9% from acquisitions, while headcount increased 15% in 2007.
Olympic Steel reported financial results for the first quarter of 2009 with a net loss of $25.5 million compared to net income of $13.2 million in the first quarter of 2008. Net sales decreased 48.8% to $140.9 million due to a 45.6% decrease in tons sold. The results were negatively impacted by a $30.6 million inventory write-down and weaker demand and pricing due to the economic downturn. The company expects results to improve as market conditions stabilize but approved a reduced quarterly dividend.
This document is a letter from the Chairman and CEO of General Motors Corporation to stockholders summarizing the company's performance in 2005. It discusses GM's $10.6 billion loss for the year due to challenges in the US market from legacy costs and inability to cut structural costs as revenue fell. It outlines GM's four-point turnaround plan to address costs, including plant closures and workforce reductions estimated to cut annual costs by $7 billion. It also discusses GM's continued investments in new vehicles and technology while growing its global business outside North America.
This document is the 1999 annual report for Bank of America Corporation and Subsidiaries. It summarizes the company's financial performance for 1999, including operating earnings of $8.2 billion, a 27% increase over 1998. It discusses progress on integrating the merged companies and outlines the company's strategy to focus on building broad customer relationships across its businesses to drive revenue growth. Key financial targets for returns and earnings growth are also summarized.
The document provides an overview of Bank of America's Global Business & Financial Services division. It summarizes several key business lines including Middle Market Banking, Business Banking, Commercial Real Estate Banking, and others. For each business line, it provides revenue, net income, loans, deposits and other metrics for 2004. It also outlines the division's integrated operating model and global footprint.
The document is a presentation on doing business in India from the perspective of a banker. It discusses several key points:
1. The Indian economy is growing rapidly, driven by consumption growth and a strong services sector. New industries like IT and pharmaceuticals are emerging.
2. The financial sector in India is robust with established institutions and regulations. The banking sector is expanding into new areas and using new technologies to better serve customers.
3. Reforms have improved the business environment in India and increased its competitiveness globally according to World Bank reports. The financial system remains stable despite various economic challenges.
GM made significant progress in 2006, exceeding many goals and targets. While more work remains, GM is transforming itself for long-term, sustainable success by focusing on great vehicles, strong brands, and industry-leading technology. This includes reducing costs, improving products, expanding globally, strengthening its balance sheet, and developing advanced technologies like hybrids, plug-in hybrids, fuel cells, and electric vehicles to reduce dependence on oil.
Bank of America reported a loss of $1.8 billion for Q4 2008. This was due to capital markets dislocation charges of $4.6 billion and a $8.5 billion provision for credit losses, which included a $3 billion increase in loan loss reserves. Despite the loss, pre-provision profits were up in most primary businesses from Q3 2008. Total average deposits grew by $34.3 billion. The company also raised common equity and received capital from the TARP program. Credit costs were higher due to the deteriorating economy and rising unemployment.
Bank of America Corporation acquires Merrill Lynch & Co., Inc. PresentationQuarterlyEarningsReports3
This document summarizes the proposed merger between Bank of America and Merrill Lynch to create the premier financial services company. Some key points:
- Ken Lewis of Bank of America and John Thain of Merrill Lynch will lead the combined company.
- The merger combines Bank of America's retail banking franchise with Merrill Lynch's leading wealth management and investment banking businesses.
- The deal will diversify revenue streams and significantly enhance Bank of America's investment banking capabilities.
- Merrill Lynch brings over 20,000 financial advisors and $2.5 trillion in client assets to strengthen Bank of America's wealth management business.
This document provides supplemental financial information for Bank of America for the first quarter of 2006. Some key highlights include:
- Net income for the first quarter of 2006 was $4.986 billion, up from $3.574 billion in the fourth quarter of 2005.
- Total revenue for the first quarter was $17.677 billion, up from $13.810 billion in the previous quarter.
- Net interest income increased to $8.776 billion from $7.859 billion in the fourth quarter.
- The return on average assets was 1.43% and the return on average common shareholders' equity was 15.44% for the first quarter.
This document summarizes Bank of America's financial management strategies. It discusses generating diverse revenue streams, managing interest rate risk, maintaining strong capital and liquidity positions, and advantageously managing capital. Key points include generating over $74 billion in annual revenue from a variety of sources, holding net interest income steady despite rate changes, having enough liquidity to cover over 30 months of required funding, and returning over $80 billion to shareholders through buybacks and dividends. The goal is 10% annual EPS growth through revenue increases, operating efficiencies, controlled credit costs, and capital deployment.
Bank of America reported first quarter 2005 results with key highlights including a 21% increase in diluted EPS compared to fourth quarter 2004. Revenue was up 2% from the previous quarter driven by strength in trading and mortgage banking offsetting seasonal declines in consumer business. Credit quality continued to improve across both consumer and commercial portfolios although credit card losses rose due to portfolio growth and minimum payment changes. Overall, the results demonstrated continued momentum in the company's consumer and commercial businesses.
Bank of America is acquiring Countrywide Financial to become the largest mortgage originator and servicer in the US. The acquisition will strengthen Bank of America's position as a premier consumer bank by adding Countrywide's large mortgage capabilities and technology platform. The all-stock deal values Countrywide at $2.9 billion and is expected to close in the third quarter of 2008 pending regulatory and shareholder approvals. The acquisition faces near term challenges from the weak housing market but creates opportunities to improve origination practices and acquire a leading mortgage platform.
This document provides Bank of America's financial results for the full year and fourth quarter of 2007. Some key points:
- Net income for 2007 was $15 billion, down 29% from 2006, driven by higher credit costs and losses from subprime exposures.
- Revenue declined 8% for the year due to lower noninterest income. Credit costs rose significantly.
- In the fourth quarter, the company reported a net profit of $268 million compared to a $5.3 billion profit in 2006, with losses from subprime exposures weighing heavily.
- Global Consumer & Small Business Banking saw lower profits for the year and quarter due to rising credit costs, particularly in credit cards.
Citigroup reported quarterly financial results for 4Q08. Net income decreased 16% to $8.3 billion compared to 4Q07. Total revenues decreased 13% to $5.6 billion due to declines in principal transactions and other revenue. The provision for loan losses increased 66% to $12.7 billion, reflecting higher net charge-offs. Total assets declined 11% to $1.9 trillion as trading account assets fell 29% and loans decreased 11%.
Fifth Third Bancorp reported a net loss for Q2 2008 due to charges related to leveraged leases. Excluding these charges, pre-tax earnings were up 16% year-over-year due to increases in noninterest income and loans. However, credit costs rose significantly due to deteriorating economic conditions, particularly in real estate loans in Florida and Michigan. In response, Fifth Third raised capital levels and reduced dividends to strengthen its position for potential future losses.
Bank of America reported second quarter 2008 results. Key highlights included diluted EPS of $0.72, record quarterly revenue of $20.3 billion, and net income of $3.41 billion. Credit costs increased significantly to $5.83 billion due to weakness in the housing market. Revenue growth was driven by higher net interest income, though partially offset by lower noninterest income and higher expenses.
Citigroup reported financial results for the 4th quarter of 2008. Net income decreased 16% to a loss of $8.3 billion compared to a loss of $9.8 billion in 4th quarter 2007. Total revenues declined 13% to $5.6 billion. The provision for loan losses increased 66% to $12.7 billion due to higher credit costs. Total assets decreased 11% to $1.9 trillion and book value per share declined 35% to $14.70.
Viacom reported financial results for the first quarter of 2008 that showed increases in revenue, operating income, and earnings per share compared to the first quarter of 2007. Revenue grew 15% to $3.117 billion. Operating income increased 29% to $567 million. Diluted earnings per share from continuing operations rose 45% to $0.42. Media Networks and Filmed Entertainment, Viacom's two business segments, both saw revenue growth for the quarter despite lower theatrical revenues at Filmed Entertainment. Viacom also provided guidance for 2008-2010 of low double-digit annual growth in diluted earnings per share from continuing operations.
The document provides a summary of Citigroup's earnings for the first quarter of 2008. Key points include:
- Net income declined significantly to a $5.1 billion loss compared to a $5 billion profit in Q1 2007.
- Major losses were driven by write-downs on subprime exposures, consumer credit losses, and losses on leveraged finance commitments.
- Revenues declined 48% year-over-year due to losses in fixed income markets and the consumer segment.
- Expenses increased 4% year-over-year due to repositioning charges despite cost cutting efforts.
This document summarizes Bank of America's second quarter 2009 results. It reported net income of $3.2 billion and diluted EPS of $0.33. Revenue was $33.1 billion. Provision for credit losses was $13.4 billion as the allowance was strengthened for continued economic deterioration. Large items impacting earnings included gains from the sale of China Construction Bank shares and a merchant processing business, but losses from derivative adjustments and capital markets disruption charges. The company continued operating in a challenging economic environment.
Fifth Third Bancorp reported 2007 earnings of $1.1 billion, or $2.03 per diluted share, compared to $1.2 billion, or $2.13 per diluted share in 2006. Fourth quarter 2007 earnings were $38 million, or $0.07 per diluted share, compared to $325 million, or $0.61 per diluted share in the third quarter of 2007. Results were impacted by non-cash charges including lowering the value of a Bank-Owned Life Insurance policy and reserves related to potential Visa litigation settlements. Excluding these items, operating earnings were lower due to deterioration in credit performance and increased loan loss reserves in response to challenging credit conditions expected to continue in the near
Fifth Third Bancorp reported earnings for full year 2007 of $1.1 billion, down slightly from 2006. Earnings for Q4 2007 were $38 million, down significantly from previous quarters due to charges including a $155 million non-cash charge related to a decline in the value of a BOLI policy and $94 million in litigation reserves. Excluding these charges, operating earnings were relatively stable. Credit quality deteriorated during the quarter as loan loss provisions increased 105% from the previous quarter. Management expects further deterioration in credit conditions in the near term.
- In 3Q11, JPMorgan Chase reported net income of $4.3 billion and earnings per share of $1.02. Revenue for the quarter was $24.4 billion.
- The Investment Bank contributed net income of $1.6 billion on revenue of $6.4 billion, which included $1.9 billion in DVA gains.
- Retail Financial Services reported net income of $1.2 billion, with credit costs of $1 billion reflecting continued losses in mortgage and home equity portfolios.
- Mortgage Production and Servicing reported net income of $205 million, with production revenue of $1.3 billion and servicing revenue of $1.2 billion
This document provides financial highlights and consolidated statements for ALLTEL Corporation for the three and six month periods ending June 30, 2007 and 2006. Some key highlights include:
- Service revenues and total revenues increased 14% and 12% respectively for the three month period and year-to-date compared to the prior year.
- Operating income and net income from current businesses increased 18% and 25% respectively for the three month period compared to the prior year.
- Net income under GAAP decreased 54% and 41% for the three month and year-to-date periods due to one-time gains in the prior year.
- Total assets decreased 27% from the end of 2006 primarily due to the sale of business
Raytheon reported strong financial results for the fourth quarter and full year 2006. Quarterly sales increased 12% to $5.7 billion due to growth at Integrated Defense Systems, Missile Systems, and Network Centric Systems. Earnings per share from continuing operations increased 27% to $0.65 for the quarter. For the full year, sales increased 7% to $20.3 billion and earnings per share from continuing operations increased 37% to $2.46. Raytheon also provided guidance for 2007, forecasting earnings per share from continuing operations between $2.85 to $3.00 on sales between $21.4 to $21.9 billion.
Raytheon reported strong third quarter 2007 results with bookings of $6.5 billion and sales of $5.4 billion, up 8% from the prior year. Earnings per share from continuing operations were $0.69, up 17% year-over-year. Raytheon also announced a new $2 billion share repurchase program and the pending sale of its Flight Options subsidiary. Segment results were positive across Integrated Defense Systems, Missile Systems, Network Centric Systems and Intelligence and Information Systems on higher sales and margins.
Citi reported record quarterly revenues of $25.5 billion, up 15%, and net income of $5.01 billion, down 10% from the prior year. Net income was reduced by an $871 million after-tax charge related to a structural expense review. Excluding this charge, net income was $5.88 billion, down 9% due to higher credit costs and a lower tax benefit. Revenues grew across most business segments, led by a 23% increase in Markets & Banking revenues. Credit costs increased $1.26 billion due to higher net losses and increases to loan loss reserves.
Pfizer Quarterly Corporate Performance - Third Quarter 2008finance5
This document summarizes Pfizer's third quarter 2008 earnings teleconference. It discusses Pfizer's financial results for the third quarter and year-to-date, including adjusted revenues increasing 2% for both periods. It also reviews significant items that impacted results, progress on Pfizer's cost reduction target, and select product highlights for the quarter.
In the third quarter 2008 earnings teleconference, Pfizer reported increased revenues and earnings compared to the previous year. Adjusted revenues increased 2% to $12.2 billion while adjusted income and EPS grew 5% and 7% respectively. Key products such as Lyrica, Celebrex and Viagra performed well. Pfizer also exceeded its cost reduction target, achieving $1.7 billion in savings through the third quarter with a goal of $2 billion for 2008 versus 2006. Pfizer narrowed its full-year revenue and EPS guidance ranges.
Raytheon reported strong financial results for Q3 2006, with EPS up 41% and bookings of $6.1 billion. The company increased full-year 2006 guidance for EPS, bookings, operating cash flow and ROIC. Segments such as IDS, MS and RAC saw higher sales and improved operating performance compared to Q3 2005. Raytheon also provided initial guidance for 2007 with projected continued growth.
Danaher Corporation announced its second quarter 2007 results, with net earnings of $311 million compared to $314 million in the second quarter of 2006. Sales increased 13.5% to $2.67 billion. For the first six months of 2007, net earnings were $566 million on sales of $5.23 billion, increases of 5.5% and 16.5% respectively over the same period in 2006. The company stated that core revenue growth was 4.5% in the quarter despite difficult comparisons, and that performance through the first half gives them confidence in achieving positive results for the full year.
KPMG LLP is the US member firm of KPMG International, a Swiss cooperative. The document contains notes to the consolidated financial statements for JTH Tax, Inc. and Subsidiaries (doing business as Liberty Tax Service) for the years ending April 30, 2006, 2005 and 2004. During 2006, the Company was deemed the primary beneficiary of 16 franchise entities due to significant financial support provided, and therefore consolidated the assets, liabilities, and results of these entities. The summarized effect of consolidating these variable interest entities showed total assets of $99.7 million, total liabilities of $57.1 million, and net income of $8.3 million for the year ended April 30, 2006.
Similar to Third Quarter 2007 Earnings Presentation (20)
This document is a cookbook containing recipes for appetizers, relishes, and pickles that was published by the Pataskala Church of the Nazarene in Pataskala, Ohio. It includes over 50 recipes organized into sections for appetizers, relishes, and pickles. The recipes provide instructions for making items like bacon and egg cups, cheese balls, spinach dip, and various vegetable relishes. An introduction dedicates the cookbook to all cooks and thanks those who contributed recipes.
Innovating Through Recession by Andrew Razeghi of Kellog School of ManagementQuarterlyEarningsReports3
This document discusses strategies for innovating during an economic recession. It argues that recessions provide opportunities to launch new products and businesses when competition is reduced. It provides examples of companies from the 1930s Great Depression that successfully innovated, such as Fortune Magazine, Kraft, and Revlon. The document recommends listening closely to customer needs, investing in customer relationships to build loyalty, and adding more value rather than just reducing prices during economic downturns.
In 2006, Lehman Brothers pursued a diversified global growth strategy that identified opportunities worldwide. Its strategy was to continue investing in a diversified mix of businesses, expand its client base, deliver effective services to clients, effectively manage risks and expenses, and strengthen its culture. Financially, Lehman Brothers saw increases in net revenues, net income, total assets, long-term borrowings, stockholders' equity, and other metrics from 2005 to 2006.
1) The annual report summarizes AIG's financial performance in 2007, which saw a decline from 2006 levels. Net income fell 55.9% to $6.2 billion, while revenues fell 2.9% to $110.1 billion. Book value per share and shareholders' equity also declined.
2) Key events and accomplishments in 2007 included receiving approval to establish a wholly owned general insurance subsidiary in China, expanding operations in other Asian markets like Korea and Vietnam, and making progress on the "Deliver the Firm" customer-focused strategy.
3) Challenges in 2007 included higher losses and expenses in some businesses as well as weaknesses in some product lines and distribution channels that need to be addressed
This document provides an overview of the subprime mortgage meltdown that occurred from 2006 to 2008. It begins with quotes from Treasury Secretary Henry Paulson showing the changing view of the strength of the US financial system. It then discusses the growth of subprime lending and adjustable rate mortgages, fueled by low interest rates. This led to a housing bubble and boom in home construction. However, rising default rates among subprime borrowers triggered a wider crisis and collapse of major financial firms.
The document discusses the predictions of economic experts for a recession and market decline in the near future due to mismanagement by the Federal Reserve and federal government. It notes predictions from 2007 of a 50-60% market decline and recession worse than the Great Depression. It discusses the declining value of the US dollar and rising national debt. Finally, it summarizes recent retail store closures and bankruptcies as symptomatic of a struggling US economy.
- Freddie Mac's 2007 annual report summarizes the company's activities and financial results for the year.
- Freddie Mac faced significant challenges in 2007 due to the downturn in the housing market, including losses of $3.1 billion. However, a large portion of the losses were due to mark-to-market accounting rules rather than economic losses.
- Despite the difficulties, Freddie Mac continued its mission of providing liquidity and stability to the U.S. housing market. The company helped many families avoid foreclosure and expanded affordable housing programs.
This document provides an introduction and summary of the World Economic Forum's inaugural Financial Development Report 2008. It was published at a time of financial instability and uncertainty. The report aims to provide a holistic perspective on financial development by assessing countries' financial systems, examining the link between finance and economic growth, and discussing financial reforms. It incorporates input from academics, business and political leaders through the Forum's multistakeholder engagement process. The report includes the Financial Development Index, country profiles, data tables, and analysis to facilitate discussions on financial system strengths, priorities and reforms.
The document provides an overview and analysis of global risks for 2009 as identified by the World Economic Forum's Global Risk Network. It finds that risks related to deteriorating fiscal positions, a sudden slowdown in China's economy, further declines in asset prices, resource challenges exacerbated by climate change, and gaps in global governance pose significant threats. The financial crisis has demonstrated the interconnected nature of the global economy and amplified many pre-existing risks. Going forward, leadership and coordinated international cooperation will be needed to balance responses to the immediate economic situation with efforts to mitigate longer-term risks.
The document summarizes venture capital investment trends in the United States for the fourth quarter and full year of 2008 based on data from the MoneyTree Report published by PricewaterhouseCoopers and the National Venture Capital Association. US venture capital investments declined 8% in 2008 to $28.3 billion, down from $30.9 billion in 2007. The bulk of investments went to expansion and later stage deals rather than early stage/seed deals. The number of deals also declined in 2008 compared to 2007.
Hewlett-Packard reported their Q4 2008 earnings. Key points:
- Revenue grew 19% year-over-year to $33.6 billion, up 16% excluding EDS acquisition.
- Non-GAAP operating profit grew 21% to $3.4 billion, or 10.1% of revenue.
- Non-GAAP EPS grew 20% to $1.03.
- Personal Systems revenue grew 10% to $11.2 billion, with notebook revenue up 21%.
- Imaging and Printing revenue declined 1% to $7.5 billion, with supplies revenue up 9%.
- Enterprise Storage and Servers revenue declined 1% to $5.
This document discusses how businesses can prepare for unexpected events that could disrupt operations through developing a business continuity plan. It emphasizes that quality also means a business's ability to continuously supply customers' needs no matter what challenges occur. The document outlines key aspects a business continuity plan should address such as vulnerabilities, crisis management, information technology restoration, and training to test the plan. Developing a written, practiced plan can help businesses survive disruptions and be more resilient.
This document provides a summary of U.S. frequency allocations across various bands. It includes a table organized by frequency ranges listed in MHz along the left side and activity designations listed across the top. The table contents primary designations for different frequencies in capital letters and secondary designations in lowercase. It is intended to determine the current status of frequency allocations by the FCC and NTIA but may not reflect all recent changes.
Hewlett-Packard reported financial results for the third quarter of fiscal year 2008. Net revenue was $28.03 billion, a 10% increase from the same quarter last year. Earnings from operations were $2.53 billion. After accounting for various adjustments including amortization expenses and restructuring charges, non-GAAP earnings from operations were $2.75 billion, a 20% increase over the prior year. For the nine months ended July 31, 2008, net revenue increased 11% to $84.76 billion, while non-GAAP earnings from operations grew 25% to $8.39 billion compared to the same period last year.
Enhancing Asset Quality: Strategies for Financial Institutionsshruti1menon2
Ensuring robust asset quality is not just a mere aspect but a critical cornerstone for the stability and success of financial institutions worldwide. It serves as the bedrock upon which profitability is built and investor confidence is sustained. Therefore, in this presentation, we delve into a comprehensive exploration of strategies that can aid financial institutions in achieving and maintaining superior asset quality.
Discover the Future of Dogecoin with Our Comprehensive Guidance36 Crypto
Learn in-depth about Dogecoin's trajectory and stay informed with 36crypto's essential and up-to-date information about the crypto space.
Our presentation delves into Dogecoin's potential future, exploring whether it's destined to skyrocket to the moon or face a downward spiral. In addition, it highlights invaluable insights. Don't miss out on this opportunity to enhance your crypto understanding!
https://36crypto.com/the-future-of-dogecoin-how-high-can-this-cryptocurrency-reach/
Abhay Bhutada, the Managing Director of Poonawalla Fincorp Limited, is an accomplished leader with over 15 years of experience in commercial and retail lending. A Qualified Chartered Accountant, he has been pivotal in leveraging technology to enhance financial services. Starting his career at Bank of India, he later founded TAB Capital Limited and co-founded Poonawalla Finance Private Limited, emphasizing digital lending. Under his leadership, Poonawalla Fincorp achieved a 'AAA' credit rating, integrating acquisitions and emphasizing corporate governance. Actively involved in industry forums and CSR initiatives, Abhay has been recognized with awards like "Young Entrepreneur of India 2017" and "40 under 40 Most Influential Leader for 2020-21." Personally, he values mindfulness, enjoys gardening, yoga, and sees every day as an opportunity for growth and improvement.
South Dakota State University degree offer diploma Transcriptynfqplhm
办理美国SDSU毕业证书制作南达科他州立大学假文凭定制Q微168899991做SDSU留信网教留服认证海牙认证改SDSU成绩单GPA做SDSU假学位证假文凭高仿毕业证GRE代考如何申请南达科他州立大学South Dakota State University degree offer diploma Transcript
Economic Risk Factor Update: June 2024 [SlideShare]Commonwealth
May’s reports showed signs of continued economic growth, said Sam Millette, director, fixed income, in his latest Economic Risk Factor Update.
For more market updates, subscribe to The Independent Market Observer at https://blog.commonwealth.com/independent-market-observer.
University of North Carolina at Charlotte degree offer diploma Transcripttscdzuip
办理美国UNCC毕业证书制作北卡大学夏洛特分校假文凭定制Q微168899991做UNCC留信网教留服认证海牙认证改UNCC成绩单GPA做UNCC假学位证假文凭高仿毕业证GRE代考如何申请北卡罗莱纳大学夏洛特分校University of North Carolina at Charlotte degree offer diploma Transcript
"Does Foreign Direct Investment Negatively Affect Preservation of Culture in the Global South? Case Studies in Thailand and Cambodia."
Do elements of globalization, such as Foreign Direct Investment (FDI), negatively affect the ability of countries in the Global South to preserve their culture? This research aims to answer this question by employing a cross-sectional comparative case study analysis utilizing methods of difference. Thailand and Cambodia are compared as they are in the same region and have a similar culture. The metric of difference between Thailand and Cambodia is their ability to preserve their culture. This ability is operationalized by their respective attitudes towards FDI; Thailand imposes stringent regulations and limitations on FDI while Cambodia does not hesitate to accept most FDI and imposes fewer limitations. The evidence from this study suggests that FDI from globally influential countries with high gross domestic products (GDPs) (e.g. China, U.S.) challenges the ability of countries with lower GDPs (e.g. Cambodia) to protect their culture. Furthermore, the ability, or lack thereof, of the receiving countries to protect their culture is amplified by the existence and implementation of restrictive FDI policies imposed by their governments.
My study abroad in Bali, Indonesia, inspired this research topic as I noticed how globalization is changing the culture of its people. I learned their language and way of life which helped me understand the beauty and importance of cultural preservation. I believe we could all benefit from learning new perspectives as they could help us ideate solutions to contemporary issues and empathize with others.
Independent Study - College of Wooster Research (2023-2024) FDI, Culture, Glo...AntoniaOwensDetwiler
"Does Foreign Direct Investment Negatively Affect Preservation of Culture in the Global South? Case Studies in Thailand and Cambodia."
Do elements of globalization, such as Foreign Direct Investment (FDI), negatively affect the ability of countries in the Global South to preserve their culture? This research aims to answer this question by employing a cross-sectional comparative case study analysis utilizing methods of difference. Thailand and Cambodia are compared as they are in the same region and have a similar culture. The metric of difference between Thailand and Cambodia is their ability to preserve their culture. This ability is operationalized by their respective attitudes towards FDI; Thailand imposes stringent regulations and limitations on FDI while Cambodia does not hesitate to accept most FDI and imposes fewer limitations. The evidence from this study suggests that FDI from globally influential countries with high gross domestic products (GDPs) (e.g. China, U.S.) challenges the ability of countries with lower GDPs (e.g. Cambodia) to protect their culture. Furthermore, the ability, or lack thereof, of the receiving countries to protect their culture is amplified by the existence and implementation of restrictive FDI policies imposed by their governments.
My study abroad in Bali, Indonesia, inspired this research topic as I noticed how globalization is changing the culture of its people. I learned their language and way of life which helped me understand the beauty and importance of cultural preservation. I believe we could all benefit from learning new perspectives as they could help us ideate solutions to contemporary issues and empathize with others.
A toxic combination of 15 years of low growth, and four decades of high inequality, has left Britain poorer and falling behind its peers. Productivity growth is weak and public investment is low, while wages today are no higher than they were before the financial crisis. Britain needs a new economic strategy to lift itself out of stagnation.
Scotland is in many ways a microcosm of this challenge. It has become a hub for creative industries, is home to several world-class universities and a thriving community of businesses – strengths that need to be harness and leveraged. But it also has high levels of deprivation, with homelessness reaching a record high and nearly half a million people living in very deep poverty last year. Scotland won’t be truly thriving unless it finds ways to ensure that all its inhabitants benefit from growth and investment. This is the central challenge facing policy makers both in Holyrood and Westminster.
What should a new national economic strategy for Scotland include? What would the pursuit of stronger economic growth mean for local, national and UK-wide policy makers? How will economic change affect the jobs we do, the places we live and the businesses we work for? And what are the prospects for cities like Glasgow, and nations like Scotland, in rising to these challenges?
In a tight labour market, job-seekers gain bargaining power and leverage it into greater job quality—at least, that’s the conventional wisdom.
Michael, LMIC Economist, presented findings that reveal a weakened relationship between labour market tightness and job quality indicators following the pandemic. Labour market tightness coincided with growth in real wages for only a portion of workers: those in low-wage jobs requiring little education. Several factors—including labour market composition, worker and employer behaviour, and labour market practices—have contributed to the absence of worker benefits. These will be investigated further in future work.
What's a worker’s market? Job quality and labour market tightness
Third Quarter 2007 Earnings Presentation
1. Bank of America
Third Quarter 2007 Results
Ken Lewis
Chairman, CEO and President
Joe Price
Chief Financial Officer
October 18, 2007
2. Forward Looking Statements
This presentation contains forward-looking statements, including statements about the
financial conditions, results of operations and earnings outlook of Bank of America
Corporation. The forward-looking statements involve certain risks and uncertainties. Factors
that may cause actual results or earnings to differ materially from such forward-looking
statements include, among others, the following: 1) projected business increases following
process changes and other investments are lower than expected; 2) competitive pressure
among financial services companies increases significantly; 3) general economic conditions
are less favorable than expected; 4) political conditions including the threat of future terrorist
activity and related actions by the United States abroad may adversely affect the company’s
businesses and economic conditions as a whole; 5) changes in the interest rate environment
and market liquidity reduce interest margins, impact funding sources and effect the ability to
originate and distribute financial products in the primary and secondary markets; 6) changes in
foreign exchange rates increases exposure; 7) changes in market rates and prices may
adversely impact the value of financial products; 8) legislation or regulatory environments,
requirements or changes adversely affect the businesses in which the company is engaged; 9)
changes in accounting standards, rules or interpretations, 10) litigation liabilities, including
costs, expenses, settlements and judgments, may adversely affect the company or its
businesses; 11) mergers and acquisitions and their integration into the company; and 12)
decisions to downsize, sell or close units or otherwise change the business mix of any of the
company. Accordingly, readers are cautioned not to place undue reliance on forward-looking
statements, which speak only as of the date on which they are made. Bank of America does
not undertake to update forward-looking statements to reflect the impact of circumstances or
events that arise after the date the forward-looking statements are made. For further
information regarding Bank of America Corporation, please read the Bank of America reports
filed with the SEC and available at www.sec.gov.
2
3. Important Presentation Format Information
• Certain prior period amounts have been reclassified to conform
to current period presentation
• The Corporation reports its Global Consumer & Small Business
Banking (GCSBB) results, specifically Card Services, on a
managed basis. Refer to Exhibit A in the Supplemental Package
for a reconciliation from Managed to Held Results
3
4. Summary Earnings Statement –
3rd Quarter Comparison
($ in millions)
3Q07 3Q06 $ Change % Change
Core net interest income (FTE) $ 8,201 $ 8,517 $ (316) (4 %)
Market-based net interest income 789 377
Net interest income (FTE) 8,990 8,894 96 1%
Noninterest income 7,314 9,598 (2,284) (24 %)
Total revenue, net of interest expense (FTE) 16,304 18,492 (2,188) (12 %)
Provision for credit losses 2,030 1,165 865 74 %
Noninterest expense (excl merger charges) 8,459 8,594 (135) (2 %)
Merger charges 84 269
Noninterest expense 8,543 8,863
Pre-tax income 5,731 8,464
Income tax expense 2,033 3,048
Net income 3,698 5,416 (1,718) (32 %)
Merger & restructuring charges (after-tax) 53 169
Net Income before merger charges $ 3,751 $ 5,585 $ (1,834) (33 %)
Diluted EPS reported $ .82 $ 1.18 (31 %)
Merger charge impact .01 .04
Impact of intangibles amortization .06 .07
4
5. Business Results – 3Q07 vs. 3Q06 Change
Managed Total Core Total
GCSBB GCIB GWIM Businesses Other Corp
Amt.1
Amt. % Amt. % Amt. % % Amt. Amt. %
Net interest income (FTE) $ 249 4% $ 338 14 % $122 14 % $ 709 7% $ (613) $ 96 1%
Noninterest income 452 11 % (2,621) (95 %) 300 34 % (1,869) (24 %) (415) (2,284) (24 %)
Revenue, net of interest expense 701 6% (2,283) (44 %) 422 24 % (1,160) (6 %) (1,028) (2,188) (12 %)
Provision for credit losses 1,072 52 % 192 NM (29) NM 1,235 59 % (370) 865 74 %
Noninterest expense 352 8% (375) (13 %) 309 32 % 286 3% (606) (320) (4 %)
Net income $(467) (16 %) $(1,333) (93 %) $ 86 17 % $(1,714) (35 %) $ (4) $ (1,718) (32 %)
• Good fee growth in GCSBB was offset by increased provision due to a return to more normalized
loss levels from BK reform, seasoning and growth in consumer portfolios and impacts from the
weakened housing market.
• Capital markets’ losses produced a $2.3 billion negative swing in GCIB revenue vs 3Q06
• GCIB also reflects increased provision primarily related to homebuilder exposures
5 1 Balance excludes the All Other business line.
6. Highlights – 3rd Quarter
• Earnings of $3.7 billion
• Diluted EPS of $0.82 (includes $0.01 of merger charges) decreased 31% from 3Q06 and
down 36% from 2Q07
• Market turbulence reduced fee revenue opportunities and contributed to trading losses
in Global Corporate and Investment Banking (GCIB)
• Provision exceeded net charge-offs in 3Q by $457 million
• Credit quality remains sound, with some softening experienced in certain sectors.
• Good loan growth of 5% from 2Q07
• Total retail unit sales increased 12% over 3Q06 to 13.3 million
– Introduction of innovative products like No Fee Mortgage PLUS gaining momentum
– Net new retail checking accounts of 757,000 up from 2Q07 and 3Q06
• Closed U.S. Trust acquisition adding nearly $116 billion in Assets Under Management
(AUM)
• AUM again reached new highs increasing to nearly $710 billion
• Tier 1 Capital ratio declined to 8.22%, as a result of the U.S. Trust acquisition
6
7. Global Consumer & Small Business Banking (GCSBB)
– Managed Basis
Change from
($ in millions)
3Q06 2Q07
3Q07 Amt. % Amt. %
Net interest income (FTE) $ 7,265 $ 249 4% $ 133 2%
Noninterest income 4,720 452 11 % 8 -%
Total revenue, net of interest expense (FTE) 11,985 701 6% 141 1%
Provision for credit losses1 3,121 1,072 52 % 27 1%
Noninterest expense 4,971 352 8% 60 1%
Pre-tax income 3,893 (723) (16 %) 54 1%
Income tax expense 1,441 (256) 38
Net income $ 2,452 $ (467) (16 %) $ 16 1%
ROE 15.63 % (307 bps) (21 bps)
Efficiency ratio 41.48 % 54 bps 1 bps
• Card Services average loans grew 10% over 3Q06, led by Unsecured Lending, US Card and Business Card
• Consumer Card loss rate decreased to 4.67%, as expected, from 2Q07.
• Retail sales of 13.0 million grew 12% over 3Q06
• Noninterest income growth over 3Q06 led by a combined 10% improvement in service charges and card income
• Small business unit sales grew 24% over 3Q06, led by online banking, business checking and debit
• Provision expense increased resulting from portfolio seasoning due to growth in the businesses. The weak housing
market was also a contributor.
1 Represents the provision for credit losses on held loans combined with realized credit losses associated with the securitized loan portfolio.
7
8. Retail Sales Highlights – 3Q07
Product Metric Performance Highlight
Checking Net new retail 757,000 units • Sales up 11% from 2Q07 and up 16% from
accounts 3Q06
Credit card New accounts 3.7 million units • Lower cost delivery strategy driving
increasing sales coupled with e-Commerce
Mortgage Production $26.9 billion • Ranked #1 in total direct to consumer retail
originations
Home equity Production $21.1 billion • Remains the #1 provider in home equity
lending
Debit card Revenue $552 million up • Remains #1 with projected 17% market
10% over 3Q06 share driven by record level unit sales
Online banking Activations 1.7 million units • Largest active online banking customer
base with 23 million, industry leading DDA-
based bill pay market share of 64%
Small business Sales 817,000 units • Continued growth in all major channels
including E-Commerce and Banking Center
8
9. Deposits Business Metrics (GCSBB)
Trend of deposit indicators:
3Q07 2Q07 3Q06
Average balances (in billions)
Checking $121.9 $125.8 $125.8
Savings 28.5 30.0 31.1
MMS 60.9 62.6 69.0
CDs & IRAs 101.4 99.5 97.5
Foreign & Other 2.7 2.4 2.6
Total GCSBB deposits 315.4 320.3 326.0
GWIM and Business Banking deposits 1 162.1 152.0 135.0
Total retail deposit balances $477.5 $472.3 $461.0
Deposit Spreads
Checking 4.30 % 4.27 % 4.19 %
Savings 3.71 3.71 3.45
MMS 3.43 3.36 2.87
CDs & IRAs 1.06 1.10 1.21
Foreign & Other 4.32 4.28 4.23
Total GCSBB deposits 3.02 3.04 2.93
1
9 Retail deposit balances in business segments other than GCSBB
10. Global Corporate & Investment Banking (GCIB)
Change from
($ in millions)
3Q06 2Q07
3Q07 Amt. % Amt. %
Net interest income (FTE) $2,747 $ 338 14 % $ 113 4%
Noninterest income 138 (2,621) (95 %) (3,135) (96 %)
Total revenue, net of interest expense (FTE) 2,885 (2,283) (44 %) (3,022) (51 %)
Provision for credit losses 228 192 NM 187 NM
Noninterest expense 2,486 (375) (13 %) (677) (21 %)
Pre-tax income 171 (2,100) (92 %) (2,532) (94 %)
Income tax expense 71 (767) (921)
Net income $ 100 $(1,333) (93 %) $(1,611) (94 %)
ROE 0.91 % NM NM
Efficiency ratio 86.19 % NM NM
• Capital Markets and Advisory Services reported a loss of $717 million in 3Q07 vs earnings of $298 million in 3Q06
and record earnings of $641 million in 2Q07
• Sales and trading revenue were negative $642 million in the qtr vs positive $1,827 million in 2Q07 and positive
$1,373 million in 3Q06
• Reduced revenue opportunities lowered Investment banking fees 21% from 3Q06 and 47% vs 2Q07
• Revenue includes markdowns on loans and loan commitments of $247 million, net of loan fees
• Loans grew 14% vs 3Q06.
• Provision reflected the impact of the housing market primarily on our home builder portfolios.
10
11. Market Dislocations Created Losses in Capital Markets
and Advisory Services Business
($ in millions)
Capital Markets and Advisory Services Market-Based Revenue
Change in revenue from 2Q07
Sales & Investment
3Q07 Trading Banking Total
Liquid Products $ 585 $ 23 $ (14) $9
Credit Products (697) (1,211) (202) (1,413)
Structured Products (527) (1,090) (114) (1,204)
Equities 305 (191) (39) (230)
Other 128 - (16) (16)
Total $(206) $(2,469) $(385) $(2,854)
• Excludes $22 million margin from FVO loan book
11
12. Global Wealth & Investment Management (GWIM)
Change from
($ in millions)
3Q06 2Q07
3Q07 Amt. % Amt. %
Net interest income (FTE) $1,009 $122 14 % $ 51 5%
Noninterest income 1,191 300 34 % 141 13 %
Total revenue, net of interest expense (FTE) 2,200 422 24 % 192 10 %
Provision for credit losses (29) (29) NM (15) NM
Noninterest expense 1,274 309 32 % 241 23 %
Pre-tax income 955 142 17 % (34) (3 %)
Income tax expense 356 56 (7)
Net income $ 599 $ 86 17 % $ (27) (4 %)
ROE 19.98 % (97 bps) (529 bps)
Efficiency ratio 57.91 % 360 bps 651 bps
• Closed U.S. Trust acquisition adding more than 1,000 associates and nearly $116 billion in assets under management
and $7 billion each in loans and deposits
• Assets under management, including U.S. Trust, grew to nearly $710 billion.
• Excluding U.S. Trust, AUM is up 15% over 3Q06 due to strong money market and equity net flows and favorable
market activity
• Excluding U.S. Trust loans are up 13% from 3Q06 while organic deposit growth is up 8%
12
13. All Other – Including GCSBB Securitization
Eliminations
Change from
($ in millions)
3Q06 2Q07
3Q07 Amt. % Amt. %
Net interest income (FTE) $ (2,031) $ (613) (43 %) $ (88) (5 %)
Noninterest income 1,265 (415) (25 %) (877) (41 %)
Total revenue, net of interest expense (FTE) (766) (1,028) NM (965) NM
Provision for credit losses1 (1,290) (370) (40 %) 21 2%
Merger & restruct. exp. 84 (185) (69 %) 9 12 %
Noninterest expense (272) (421) NM (183) NM
Pre-tax income 712 (52) (7 %) (812) (53 %)
Income tax expense 165 (48) (371)
Net income $ 547 $ (4) (1 %) $ (441) (45 %)
Components of equity investment income:
Principal investing $ 275 $ (329) (54 %) $ (975) (78 %)
Corporate & strategic 577 494 NM 108 23 %
Total All Other equity income 852 165 24 % (867) (50 %)
Other business segments 52 34 NM (58) (53 %)
Total Corp equity income $ 904 $ 199 28 % $ (925) (51%)
1 Represents the provision for credit losses in All Other combined with the GCSBB securitization offset.
13
14. Asset Quality Remains Sound
• Managed net credit loss ratio across all businesses was 1.27%, down 4
basis points from the second quarter
– Held net charge-offs remained relatively flat with 2Q07 at .80%
• Provision was higher than net charge-offs by $457 million
– Reserve build reflects seasoning and higher loss expectations in targeted growth
portfolios including small business and home equity in consumer
– Commercial includes reserve build for homebuilder exposures
• Consumer card losses tracking as expected
– Managed consumer credit card net loss rate decreased to 4.67% as expected from
5.02% in 2Q07. 30 day delinquencies increased to 5.24% from 5.08% in 2Q07. 90
day delinquencies declined to 2.48% from 2.55% in 2Q07.
• Growth in Small Business Lending drove the commercial losses in 3Q
• Commercial losses net charge-off ratio excluding small business
remained at historic lows of 0.05%, no change from 2Q07
14
15. Balanced Mix of Managed Consumer Loans
Total Managed Consumer 3Q07 Average Balances 1
$630.6B
Other Consumer 1%
DFS 6%
Unsecured Lending
5%
Residential Mortgage
Foreign Consumer Card
44%
5%
Avg. FICO 739 2
Avg. LTV 61%
3Q07 Managed loss ratio .02%
US Consumer Card
23%
Avg. FICO 687 2
3Q07 Managed loss ratio 4.76%
1 Includes certain securitizations in addition to
Avg. FICO 721 2
those within Card Services
Home Equity
2 FICOs and LTVs are on a refreshed basis as
Avg. CLTV 68%
16%
of 9/30/07, values are based upon Case-
3Q07 Managed loss ratio .20%
Shiller data as of 6/30/07.
15
16. Net Interest Income
Linked Quarter Net Interest Income & Yield
($ in millions)
3Q07 2Q07 $ Change % Change
Reported net interest income (FTE) $ 8,990 $ 8,781 $ 209 2%
Market based NII (789) (635) (154)
Core net interest income (FTE) 8,201 8,146 55 1%
Impact of securitizations 2,009 1,952 57
Core NII - Managed Basis $10,210 $10,098 $ 112 1%
Avg. earning assets $1,375,795 $1,358,199 $ 17,596 1%
Market based earning assets (406,947) (426,598) 19,651 5%
Impact of securitizations 104,181 102,357 1,824 2%
Reported net interest yield 2.61 % 2.59 % 2 bps
Core net interest yield 3.38 % 3.50 % (12 bps)
Core net interest yield – Managed Basis 3.80 % 3.91 % (11 bps)
• Change in core net interest income – managed basis driven by:
Consumer and commercial loan growth ($200 mm)
1 more accrual day in the qtr ($75 mm)
Offset by negative impact of rates ($200 mm)
16
17.
18.
19. Net Interest Income – Managed Sensitivity
($ in millions)
Managed Net interest income impact for next 12 months
Forward curve interest rate scenarios @9/30/07 @6/30/07
+ 100 bp parallel shift $(461) $(511)
- 100 bp parallel shift 398 840
Flattening scenario from forward curve
+ 100 bp flattening on short end (574) (586)
- 100 bp flattening on long end (209) (94)
Steepening scenario from forward curve
+ 100 bp steepening on long end 122 61
- 100 bp steepening on short end 612 938
19
20. Capital Strength
3Q07 2Q07 3Q06
($ in millions)
Tier 1 Capital $ 94,108 $ 94,979 $ 88,085
Risk Weighted Assets 1,145,065 1,115,150 1,039,283
Tier 1 Capital Ratio 8.22 % 8.52 % 8.48 %
Total Capital Ratio 11.86 % 12.11 % 11.46 %
Tier 1 Leverage Ratio 6.20 % 6.33 % 6.16 %
Tangible Equity $ 61,442 $61,186 $58,021
Tangible Equity Ratio 4.09 % 4.19 % 4.22 %
Tangible Equity Ratio Adj for OCI 4.62 % 4.82 % 4.69 %
Months to required funding- Parent Co. 28 26 22
Earnings Returned to Common Shareholders
Dividends paid $2,851 $ 2,494 $ 2,536
Cost of net share repurchases 152 273 2,082
Dividends & net repur. as % of earnings 81 % 48 % 85 %
Dividend yield 5.09 % 4.58 % 4.18 %
20
21. Consolidated Highlights Adjusted to a Managed Basis1,2
($ in millions)
Change vs. YTD06
YTD07 Amt. %
Net interest income (FTE) $32,188 $ 133 -%
Noninterest income 26,207 960 4%
Total revenue, net of interest expense (FTE) 58,395 1,093 2%
Provision for credit losses3 8,724 2,944 51 %
Noninterest expense (excl. merger chgs) 26,463 520 2%
Merger charges 270 (291) (52 %)
Noninterest expense 26,733 229 1%
Pre-tax income 22,938 (2,080) (8 %)
Income tax expense 8,224 (917)
Net income $14,714 $(1,163) (7 %)
1 Managed basis assumes that loans that have been securitized were not sold and presents earnings on these loans in a manner similar to the
way loans that have not been sold (i.e., held loans) are presented. Noninterest income, both on a held and managed basis, includes the
impact of adjustments to the interest-only strip that are recorded in card income.
2 Represents the Consolidated FTE results plus the loan securitization adjustments utilizing actual bond costs. This is different from GCSBB
which utilizes fund transfer pricing methodology. See reconciliation of Presented Held to Managed basis on pages 29 - 33.
3 Represents the provision for credit losses on held loans combined with realized credit losses associated with the securitized loan portfolio.
21
23. Consolidated Highlights Adjusted to a Managed Basis1,2
Change from
($ in millions)
3Q06 2Q07
3Q07 Amt. % Amt. %
Net interest income (FTE) $10,999 $ 345 3% $ 266 2%
Noninterest income 6,564 (2,182) (25 %) (3,923) (37 %)
Total revenue, net of interest expense (FTE) 17,563 (1,837) (9 %) (3,657) (17 %)
Provision for credit losses3 3,289 1,216 59 % 217 7%
Noninterest expense (excl. merger chgs) 8,459 (135) (2 %) (559) (6 %)
Merger charges 84 (185) (69 %) 9 12 %
Noninterest expense 8,543 (320) (4 %) (550) (6 %)
Pre-tax income 5,731 (2,733) (32 %) (3,324) (37 %)
Income tax expense 2,033 (1,015) (1,261)
Net income $ 3,698 $(1,718) (32 %) $(2,063) (36 %)
1 Managed basis assumes that loans that have been securitized were not sold and presents earnings on these loans in a manner similar to the
way loans that have not been sold (i.e., held loans) are presented. Noninterest income, both on a held and managed basis, includes the
impact of adjustments to the interest-only strip that are recorded in card income.
2 Represents the Consolidated FTE results plus the loan securitization adjustments utilizing actual bond costs. This is different from GCSBB
which utilizes fund transfer pricing methodology. See reconciliation of Presented Held to Managed basis on pages 29 - 33.
3 Represents the provision for credit losses on held loans combined with realized credit losses associated with the securitized loan portfolio.
23
24. Summary Earnings Statement –
1st 9 Months Comparison
($ in millions)
YTD 07 YTD 06 $ Change % Change
Core net interest income (FTE) $ 24,461 $25,687 $ (1,226) (5) %
Market-based net interest income 1,907 1,173
Net interest income (FTE) 26,368 26,860 (492) (2) %
Noninterest income 28,378 28,102 276 1%
Total revenue, net of interest expense (FTE) 54,746 54,962 (216) -%
Provision for credit losses 5,075 3,440 1,635 48 %
Noninterest expense (excl. merger charges) 26,463 25,943 520 2%
Merger charges 270 561
Noninterest expense 26,733 26,504
Pre-tax income 22,938 25,018
Income tax expense 8,224 9,141
Net income 14,714 15,877 (1,163) (7) %
Merger & restructuring charges (after-tax) 170 353
Net Income before merger charges $ 14,884 $16,230 $(1,346) (8) %
Diluted EPS reported $ 3.25 $ 3.44 (6) %
Merger charge impact .04 .08
Impact of intangibles amortization .17 .18
24
25. Global Consumer & Small Business Banking (GCSBB)
– Managed Basis
($ in millions)
Change vs. YTD06
YTD07 Amt. %
Net interest income (FTE) $21,409 $ 350 2%
Noninterest income 13,759 1,563 13 %
Total revenue, net of interest expense (FTE) 35,168 1,913 6%
Provision for credit losses1 8,626 2,869 50 %
Noninterest expense 14,567 976 7%
Pre-tax income 11,975 (1,932) (14 %)
Income tax expense 4,416 (707)
Net income $ 7,559 $(1,225) (14 %)
ROE 16.35 % (221 bps)
Efficiency ratio 41.42 % 55 bps
• Card Services average loans grew 9% over YTD06, led by Business Card, Unsecured Lending and International
• Consumer Card loss rate YTD increased to 4.81%
• Retail sales of 36.4 million grew 9% over YTD06
• Noninterest income growth over YTD06 led by a combined 12% improvement in service charges and card income
• Small business unit sales grew 33% over YTD06, led by online banking, business checking and debit
• Provision expense increased resulting from portfolio seasoning due to growth in the businesses. The weak housing
market was also a contributor.
1 Represents the provision for credit losses on held loans combined with realized credit losses associated with the securitized loan portfolio.
25
26. Global Corporate & Investment Banking (GCIB)
($ in millions)
Change vs. YTD06
YTD07 Amt. %
Net interest income (FTE) $ 7,809 $ 453 6%
Noninterest income 6,389 (2,263) (26 %)
Total revenue, net of interest expense (FTE) 14,198 (1,810) (11 %)
Provision for credit losses 384 302 NM
Noninterest expense 8,566 (6) -%
Pre-tax income 5,248 (2,106) (29 %)
Income tax expense 1,948 (772)
Net income $ 3,300 $(1,334) (29 %)
ROE 10.38 % (421 bps)
Efficiency ratio 60.33 % 678 bps
• Capital Markets and Advisory Services revenue declined 24% from YTD06
• Sales and trading revenue decreased 39% vs YTD06
• Investment banking revenue grew 14% over YTD06
• Provision reflected the impact of the housing market primarily on our home builder portfolios
26
27. Global Wealth & Investment Management (GWIM)
($ in millions)
Change vs. YTD06
YTD07 Amt. %
Net interest income (FTE) $ 2,893 $ 145 5%
Noninterest income 3,203 493 18 %
Total revenue, net of interest expense (FTE) 6,096 638 12 %
Provision for credit losses (20) 21 51 %
Noninterest expense 3,317 436 15 %
Pre-tax income 2,799 181 7%
Income tax expense 1,038 70
Net income $ 1,761 $ 111 7%
ROE 22.18 % (1 bps)
Efficiency ratio 54.42 % 163 bps
• Investment and brokerage services is up 21% from YTD06 as client asset growth and a more productive sales force
yielded results
27
28. All Other – Including GCSBB Securitization
Eliminations
($ in millions)
Change vs. YTD06
YTD07 Amt. %
Net interest income (FTE) $ (5,743) $(1,440) (33 %)
Noninterest income 5,027 483 11 %
Total revenue, net of interest expense (FTE) (716) (957) NM
Provision for credit losses1 (3,915) (1,557) (66 %)
Merger & restruct. exp. 270 (291) (52 %)
Noninterest expense 13 (886) (99 %)
Pre-tax income 2,916 1,777 NM
Income tax expense 822 492
Net income $ 2,094 $1,285 NM
Components of equity investment income:
Principal investing $ 2,100 $ 753 56 %
Corporate & strategic 1,367 873 NM
Total All Other equity income 3,467 1,626 88 %
Other business segments 280 (1) -%
Total Corp equity income $ 3,747 $1,625 77 %
1 Represents the provision for credit losses in All Other combined with the GCSBB securitization offset.
28
29. Reconciliation of Presented Held to Managed Basis –
Consolidated 3Q071
($ in millions)
3Q07
Held Securitization Managed
Basis2
Basis Impact
Net interest income (FTE) $ 8,990 $ 2,009 $ 10,999
Noninterest income 7,314 (750) 6,564
Total revenue, net of interest expense (FTE) 16,304 1,259 17,563
Provision for credit losses 2,030 1,259 3,289
Noninterest expense (excl. merger chgs) 8,459 - 8,459
Merger charges 84 - 84
Noninterest expense 8,543 - 8,543
Pre-tax income 5,731 - 5,731
Income tax expense 2,033 - 2,033
Net income $ 3,698 $ - $ 3,698
1 Represents the Consolidated FTE results plus the loan securitization adjustments utilizing actual bond costs. This is different from GCSBB
which utilizes fund transfer pricing methodology.
2 Provision for credit losses on a managed basis represents the provision for credit losses on held loans combined with realized credit losses
associated with the securitized loan portfolio.
29
30. Reconciliation of Presented Held to Managed Basis –
Consolidated 3Q061
($ in millions)
3Q06
Held Securitization Managed
Basis2
Basis Impact
Net interest income (FTE) $ 8,894 $ 1,760 $ 10,654
Noninterest income 9,598 (852) 8,746
Total revenue, net of interest expense (FTE) 18,492 908 19,400
Provision for credit losses 1,165 908 2,073
Noninterest expense (excl. merger chgs) 8,594 - 8,594
Merger charges 269 - 269
Noninterest expense 8,863 - 8,863
Pre-tax income 8,464 - 8,464
Income tax expense 3,048 - 3,048
Net income $ 5,416 $ - $ 5,416
1 Represents the Consolidated FTE results plus the loan securitization adjustments utilizing actual bond costs. This is different from GCSBB
which utilizes fund transfer pricing methodology.
2 Provision for credit losses on a managed basis represents the provision for credit losses on held loans combined with realized credit losses
associated with the securitized loan portfolio.
30
31. Reconciliation of Presented Held to Managed Basis –
Consolidated 2Q071
($ in millions)
2Q07
Held Securitization Managed
Basis2
Basis Impact
Net interest income (FTE) $ 8,781 $ 1,952 $10,733
Noninterest income 11,177 (690) 10,487
Total revenue, net of interest expense (FTE) 19,958 1,262 21,220
Provision for credit losses 1,810 1,262 3,072
Noninterest expense (excl. merger chgs) 9,018 - 9,018
Merger charges 75 - 75
Noninterest expense 9,093 - 9,093
Pre-tax income 9,055 - 9,055
Income tax expense 3,294 - 3,294
Net income $ 5,761 $ - $ 5,761
1 Represents the Consolidated FTE results plus the loan securitization adjustments utilizing actual bond costs. This is different from GCSBB
which utilizes fund transfer pricing methodology.
2 Provision for credit losses on a managed basis represents the provision for credit losses on held loans combined with realized credit losses
associated with the securitized loan portfolio.
31
32. Reconciliation of Presented Held to Managed Basis –
Consolidated YTD 20071
($ in millions)
YTD 2007
Held Securitization Managed
Basis2
Basis Impact
Net interest income (FTE) $ 26,368 $ 5,820 $ 32,188
Noninterest income 28,378 (2,171) 26,207
Total revenue, net of interest expense (FTE) 54,746 3,649 58,395
Provision for credit losses 5,075 3,649 8,724
Noninterest expense (excl. merger chgs) 26,463 - 26,463
Merger charges 270 - 270
Noninterest expense 26,733 - 26,733
Pre-tax income 22,938 - 22,938
Income tax expense 8,224 - 8,224
Net income $ 14,714 $ - $ 14,714
1 Represents the Consolidated FTE results plus the loan securitization adjustments utilizing actual bond costs. This is different from GCSBB
which utilizes fund transfer pricing methodology.
2 Provision for credit losses on a managed basis represents the provision for credit losses on held loans combined with realized credit losses
associated with the securitized loan portfolio.
32
33. Reconciliation of Presented Held to Managed Basis –
Consolidated YTD 20061
($ in millions)
YTD 2006
Held Securitization Managed
Basis2
Basis Impact
Net interest income (FTE) $26,860 $ 5,195 $ 32,055
Noninterest income 28,102 (2,855) 25,247
Total revenue, net of interest expense (FTE) 54,962 2,340 57,302
Provision for credit losses 3,440 2,340 5,780
Noninterest expense (excl. merger chgs) 25,943 - 25,943
Merger charges 561 - 561
Noninterest expense 26,504 - 26,504
Pre-tax income 25,018 - 25,018
Income tax expense 9,141 - 9,141
Net income $15,877 $ - $ 15,877
1 Represents the Consolidated FTE results plus the loan securitization adjustments utilizing actual bond costs. This is different from GCSBB
which utilizes fund transfer pricing methodology.
2 Provision for credit losses on a managed basis represents the provision for credit losses on held loans combined with realized credit losses
associated with the securitized loan portfolio.
33