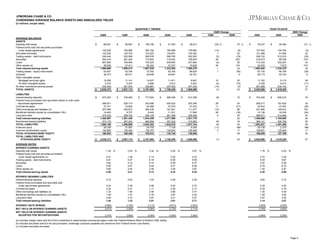
EARNINGS RELEASE FINANCIAL SUPPLEMENT
SECOND QUARTER 2009
JPMORGAN CHASE & CO.
TABLE OF CONTENTS
Page

Consolidated Results
Consolidated Financial Highlights
Statements of Income
Consolidated Balance Sheets
Condensed Average Balance Sheets and Annualized Yields
Reconciliation from Reported to Managed Summary

2
3
4
5
6

Business Detail
Line of Business Financial Highlights - Managed Basis
Investment Bank
Retail Financial Services
Card Services - Managed Basis
Commercial Banking
Treasury & Securities Services
Asset Management
Corporate/Private Equity

7
8
11
17
20
22
24
27

Credit-Related Information

29

Market Risk-Related Information

34

Supplemental Detail
Capital, Intangible Assets and Deposits
Per Share-Related Information

35
36

Glossary of Terms

37

Page 1
JPMORGAN CHASE & CO.
CONSOLIDATED FINANCIAL HIGHLIGHTS
(in millions, except per share, ratio and headcount data)
QUARTERLY TRENDS

YEAR-TO-DATE
2Q09 Change

2Q09
SELECTED INCOME STATEMENT DATA:
Reported Basis
Total net revenue
Total noninterest expense
Pre-provision profit
Provision for credit losses
Income (loss) before extraordinary gain
Extraordinary gain
NET INCOME
Managed Basis (a)
Total net revenue
Total noninterest expense
Pre-provision profit
Provision for credit losses
Income (loss) before extraordinary gain
Extraordinary gain
NET INCOME

1Q09

4Q08

3Q08

2Q08

1Q09

2Q08

2009

2009 Change
2008

2008

$

25,623
13,520
12,103
8,031
2,721
2,721

$

25,025
13,373
11,652
8,596
2,141
2,141

$

17,226
11,255
5,971
7,313
(623)
1,325
702

$

14,737
11,137
3,600
5,787
(54)
581
527

$

18,399
12,177
6,222
3,455
2,003
2,003

2 %
1
4
(7)
27
27

39 %
11
95
132
36
36

$

50,648
26,893
23,755
16,627
4,862
4,862

$

35,289
21,108
14,181
7,879
4,376
4,376

44 %
27
68
111
11
11

$

27,709
13,520
14,189
9,695
2,721
2,721

$

26,922
13,373
13,549
10,060
2,141
2,141

$

19,108
11,255
7,853
8,541
(623)
1,325
702

$

16,088
11,137
4,951
6,660
(54)
581
527

$

19,678
12,177
7,501
4,285
2,003
2,003

3
1
5
(4)
27
27

41
11
89
126
36
36

$

54,631
26,893
27,738
19,755
4,862
4,862

$

37,576
21,108
16,468
9,390
4,376
4,376

45
27
68
110
11
11

PER COMMON SHARE:
Basic Earnings (b)
Income (loss) before extraordinary gain
Net income

0.28
0.28

0.40
0.40

(0.29)
0.06

(0.08)
0.09

0.54
0.54

(30)
(30)

(48)
(48)

0.68
0.68

1.21
1.21

(44)
(44)

Diluted Earnings (b) (c)
Income (loss) before extraordinary gain
Net income

0.28
0.28

0.40
0.40

(0.29)
0.06

(0.08)
0.09

0.53
0.53

(30)
(30)

(47)
(47)

0.68
0.68

1.20
1.20

(43)
(43)

Cash dividends declared
Book value
Closing share price
Market capitalization

0.05
37.36
34.11
133,852

0.05
36.78
26.58
99,881

0.38
36.15
31.53
117,695

0.38
36.95
46.70
174,048

0.38
37.02
34.31
117,881

2
28
34

(87)
1
(1)
14

0.10
37.36
34.11
133,852

0.76
37.02
34.31
117,881

(87)
1
(1)
14

COMMON SHARES OUTSTANDING:
Weighted-average diluted shares outstanding (b)
Common shares outstanding at period-end

3,824.1
3,924.1

3,758.7
3,757.7

3,737.5
3,732.8

3,444.6
3,726.9

3,453.1
3,435.7

2
4

11
14

3,791.4
3,924.1

3,438.2
3,435.7

10
14

FINANCIAL RATIOS: (d)
Income (loss) before extraordinary gain:
Return on common equity ("ROE") (e)
Return on equity-goodwill ("ROE-GW") (e) (f)
Return on assets ("ROA")
Net income:
ROE (e)
ROE-GW (e) (f)
ROA

3 %
5
0.54

5 %
7
0.42

3
5
0.54

5
7
0.42

1
1
0.13

1
2
0.12

6
10
0.48

CAPITAL RATIOS:
Tier 1 capital ratio
Total capital ratio

9.7 (g)
13.3 (g)

11.4
15.2

10.9
14.8

8.9
12.6

9.2
13.4

SELECTED BALANCE SHEET DATA (Period-end)
Total assets
Wholesale loans
Consumer loans
Deposits
Common stockholders' equity
Total stockholders' equity

$

Headcount
LINE OF BUSINESS NET INCOME (LOSS)
Investment Bank
Retail Financial Services
Card Services
Commercial Banking
Treasury & Securities Services
Asset Management
Corporate/Private Equity
Net income

2,026,642
231,625
448,976
866,477
146,614
154,766

$

220,255

$

$

1,471
15
(672)
368
379
352
808
2,721

2,079,188
242,284
465,959
906,969
138,201
170,194

(3) %
(5)
(0.11)

$

219,569

$

$

1,606
474
(547)
338
308
224
(262)
2,141

2,175,052
262,044
482,854
1,009,277
134,945
166,884

(1) %
(1)
(0.01)

$

224,961

$

$

(2,364)
624
(371)
480
533
255
1,545
702

2,251,469
288,445
472,936
969,783
137,691
145,843

6
10
0.48

$

228,452

$

$

882
64
292
312
406
351
(1,780)
527

1,775,670
229,359
308,670
722,905
127,176
133,176
195,594

$

$

394
503
250
355
425
395
(319)
2,003

%

4
6
0.48

%

7
11
0.54

4
6
0.48

(3)
(4)
(4)
(4)
6
(9)

14
1
45
20
15
16

-

13

(8)
(97)
(23)
9
23
57
NM
27

273
(97)
NM
4
(11)
(11)
NM
36

$

2,026,642
231,625
448,976
866,477
146,614
154,766

7
11
0.54

$

$

3,077
489
(1,219)
706
687
576
546
4,862

$

$

1,775,670
229,359
308,670
722,905
127,176
133,176

14
1
45
20
15
16

195,594

220,255

$

%

13

307
192
859
647
828
751
792
4,376

NM
155
NM
9
(17)
(23)
(31)
11

(a) For further discussion of managed basis, see Reconciliation from reported to managed summary on page 6.
(b) Effective January 1, 2009, the Firm adopted FSP EITF 03-6-1. Accordingly, prior period numbers have been revised as required. For further discussion of this FSP, see Per share-related information on page 36.
(c) The calculation of second quarter 2009 earnings per share includes a one-time, non-cash reduction of $1.1 billion, or $0.27 per share, resulting from repayment of TARP preferred capital.
(d) Ratios are based upon annualized amounts.
(e) The calculation of second quarter and year-to-date 2009 net income applicable to common equity includes a one-time, non-cash reduction of $1.1 billion resulting from repayment of TARP preferred capital. Excluding this reduction the
adjusted ROE and ROE-GW were 6% and 10% for the second quarter 2009 , respectively, and 6% and 9% for the year-to-date, respectively. The Firm views the adjusted ROE and ROE-GW, non-GAAP financial measures, as meaningful
because it increases the comparability to prior periods.
(f) Net income applicable to common equity divided by total average common equity (net of goodwill). The Firm uses return on equity less goodwill, a non-GAAP financial measure, to evaluate the operating performance of the Firm. The Firm utilizes
this measure to facilitate comparisons to competitors.
(g) Estimated.

Page 2
JPMORGAN CHASE & CO.
STATEMENTS OF INCOME
(in millions, except per share and ratio data)
QUARTERLY TRENDS

YEAR-TO-DATE
2009 Change
2008

2Q09 Change
2Q09
REVENUE
Investment banking fees
Principal transactions
Lending & deposit-related fees
Asset management, administration and commissions
Securities gains
Mortgage fees and related income
Credit card income
Other income
Noninterest revenue

$

Interest income
Interest expense
Net interest income

1Q09

2,106
3,097
1,766
3,124
347
784
1,719
10
12,953

$

4Q08

1,386
2,001
1,688
2,897
198
1,601
1,837
50
11,658

$

3Q08

1,382
(7,885)
1,776
3,234
456
1,789
2,049
593
3,394

$

2Q08

1,316
(2,763)
1,168
3,485
424
457
1,771
(115)
5,743

$

1Q09

2Q08

2009

1,612
752
1,105
3,628
647
696
1,803
(138)
10,105

52 %
55
5
8
75
(51)
(6)
(80)
11

31 %
312
60
(14)
(46)
13
(5)
NM
28

(8)
(15)
(5)

$

(53)
53

2008

3,492
5,098
3,454
6,021
545
2,385
3,556
60
24,611

$

2,828
(51)
2,144
7,224
680
1,221
3,599
1,691
19,336

23 %
NM
61
(17)
(20)
95
(1)
(96)
27

34,475
8,438
26,037

34,061
18,108
15,953

1
(53)
63

16,549
3,879
12,670

17,926
4,559
13,367

21,631
7,799
13,832

17,326
8,332
8,994

16,529
8,235
8,294

TOTAL NET REVENUE

25,623

25,025

17,226

14,737

18,399

2

39

50,648

35,289

44

Provision for credit losses

8,031

8,596

7,313

5,787

3,455

(7)

132

16,627

7,879

111

6,917
914
1,156
1,518
417
2,190
265
143
13,520

7,588
885
1,146
1,515
384
1,375
275
205
13,373

5,024
955
1,207
1,819
501
1,242
326
181
11,255

5,858
766
1,112
1,451
453
1,096
305
96
11,137

6,913
669
1,028
1,450
413
1,233
316
155
12,177

(9)
3
1
9
59
(4)
(30)
1

37
12
5
1
78
(16)
(8)
11

14,505
1,799
2,302
3,033
801
3,565
540
348
26,893

11,864
1,317
1,996
2,783
959
1,402
632
155
21,108

22
37
15
9
(16)
154
(15)
125
27

4,072
1,351
2,721
2,721

3,056
915
2,141
2,141

(1,342)
(719)
(623)
1,325
702

(2,187)
(2,133)
(54)
581
527

2,767
764
2,003
2,003

33
48
27
27

47
77
36
36

7,128
2,266
4,862
4,862

6,302
1,926
4,376
4,376

13
18
11
11

0.53
0.53

(30)
(30)

(47)
(47)

1.20
1.20

(43)
(43)

NONINTEREST EXPENSE
Compensation expense
Occupancy expense
Technology, communications and equipment expense
Professional & outside services
Marketing
Other expense (a)
Amortization of intangibles
Merger costs
TOTAL NONINTEREST EXPENSE
Income (loss) before income tax expense and extraordinary gain
Income tax expense (benefit) (b)
Income (loss) before extraordinary gain
Extraordinary gain (c)
NET INCOME

DILUTED EARNINGS PER SHARE
Income (loss) before extraordinary gain (d)(e)
Extraordinary gain
NET INCOME (d)(e)

$

$
$

FINANCIAL RATIOS
Income (loss) before extraordinary gain:
ROE (f)
ROE-GW (f)
ROA
Net income:
ROE (f)
ROE-GW (f)
ROA
Effective income tax rate (b)
Overhead ratio

$

0.28
0.28

3
5
0.54

$
$

%

EXCLUDING IMPACT OF MERGER COSTS (g)
Income (loss) before extraordinary gain
Merger costs (after-tax)
Income (loss) before extraordinary gain excluding merger costs

$

Diluted Per Share:
Income (loss) before extraordinary gain (d)(e)
Merger costs (after-tax)
Income (loss) before extraordinary gain excluding merger costs (d)(e)

$

$

$

0.40
0.40

5
7
0.42

3
5
0.54
33
53

$

$
$

%

$

$

0.28
0.02
0.30

$

$

$
$

(3) %
(5)
(0.11)

5
7
0.42
30
53

2,721
89
2,810

(0.29)
0.35
0.06

$

$

$

0.40
0.03
0.43

$

$

$
$

(1) %
(1)
(0.01)

1
1
0.13
54
65

2,141
127
2,268

(0.08)
0.17
0.09

$

6
10
0.48

1
2
0.12
98
76

(623)
112
(511)

$

$

(0.29)
0.03
(0.26)

$

$

$

$

0.68
0.68

$

%

4
6
0.48

6
10
0.48
28
66

(54)
60
6

$

$

(0.08)
0.02
(0.06)

$

$

$

$
$

%

7
11
0.54

4
6
0.48
32
53

2,003
96
2,099

27
(30)
24

36
(7)
34

$

$

0.53
0.03
0.56

(30)
(33)
(30)

(47)
(33)
(46)

$

7
11
0.54
31
60

4,862
216
5,078

$

0.68
0.05
0.73

$

$

%

$

$

4,376
96
4,472

11
125
14

1.20
0.03
1.23

(43)
67
(41)

(a) Second quarter 2009 includes a $675 million FDIC special assessment.
(b) The income tax benefit in the third quarter of 2008 includes the realization of a benefit from the release of deferred tax liabilities associated with the undistributed earnings of certain non-U.S. subsidiaries that were deemed to be reinvested
indefinitely.
(c) JPMorgan Chase acquired the banking operations of Washington Mutual Bank for $1.9 billion. The fair value of the net assets acquired exceeded the purchase price, which resulted in negative goodwill. In accordance with SFAS 141,
nonfinancial assets that are not held-for-sale were written down against that negative goodwill. The negative goodwill that remained after writing down nonfinancial assets was recognized as an extraordinary gain.
(d) Effective January 1, 2009, the Firm adopted FSP EITF 03-6-1. Accordingly, prior period numbers have been revised as required. For further discussion of this FSP, see Per share-related information on page 36.
(e) The calculation of second quarter 2009 earnings per share includes a one-time, non-cash reduction of $1.1 billion, or $0.27 per share, resulting from repayment of TARP preferred capital.
(f) The calculation of second quarter and year-to-date 2009 net income applicable to common equity includes a one-time, non-cash reduction of $1.1 billion resulting from repayment of TARP preferred capital. Excluding this reduction the
adjusted ROE and ROE-GW were 6% and 10% for the second quarter 2009 , respectively, and 6% and 9% for the year-to-date, respectively. The Firm views the adjusted ROE and ROE-GW, non-GAAP financial measures, as meaningful
because it increases the comparability to prior periods.
(g) Net income excluding merger costs, a non-GAAP financial measure, is used by the Firm to facilitate comparison of results against the Firm's ongoing operations and with other companies' U.S. GAAP financial statements.

Page 3
JPMORGAN CHASE & CO.
CONSOLIDATED BALANCE SHEETS
(in millions)

Jun 30
2009
ASSETS
Cash and due from banks
Deposits with banks
Federal funds sold and securities purchased under resale agreements
Securities borrowed
Trading assets:
Debt and equity instruments
Derivative receivables
Securities
Loans
Less: allowance for loan losses
Loans, net of allowance for loan losses
Accrued interest and accounts receivable
Premises and equipment
Goodwill
Other intangible assets:
Mortgage servicing rights
Purchased credit card relationships
All other intangibles
Other assets (a)
TOTAL ASSETS
LIABILITIES
Deposits
Federal funds purchased and securities loaned or sold under
repurchase agreements
Commercial paper
Other borrowed funds (a)
Trading liabilities:
Debt and equity instruments
Derivative payables
Accounts payable and other liabilities
(including the allowance for lending-related commitments)
Beneficial interests issued by consolidated VIEs
Long-term debt
Junior subordinated deferrable interest debentures held by trusts that issued
guaranteed capital debt securities
TOTAL LIABILITIES
STOCKHOLDERS' EQUITY
Preferred stock
Common stock
Capital surplus
Retained earnings
Accumulated other comprehensive income (loss)
Shares held in RSU trust
Treasury stock, at cost
TOTAL STOCKHOLDERS' EQUITY
TOTAL LIABILITIES AND STOCKHOLDERS' EQUITY

$

25,133
61,882
159,170
129,263

Mar 31
2009
$

26,681
89,865
157,237
127,928

Dec 31
2008
$

26,895
138,139
203,115
124,000

Sep 30
2008
$

54,350
34,372
233,668
152,050

Jun 30
2008
$

Jun 30, 2009
Change
Mar 31
Jun 30
2009
2008

32,255
17,150
176,287
142,854

(6) %
(31)
1
1

(22) %
261
(10)
(10)

298,135
97,491
345,563
680,601
29,072
651,529
61,302
10,668
48,288

298,453
131,247
333,861
708,243
27,381
680,862
52,168
10,336
48,201

347,357
162,626
205,943
744,898
23,164
721,734
60,987
10,045
48,027

401,609
118,648
150,779
761,381
19,052
742,329
104,232
9,962
46,121

409,608
122,389
119,173
538,029
13,246
524,783
64,294
10,333
45,993

(26)
4
(4)
6
(4)
18
3
-

(27)
(20)
190
26
119
24
(5)
3
5

$

14,600
1,431
3,651
118,536
2,026,642

$

10,634
1,528
3,821
106,366
2,079,188

$

9,403
1,649
3,932
111,200
2,175,052

$

17,048
1,827
3,653
180,821
2,251,469

$

11,617
1,984
3,675
93,275
1,775,670

37
(6)
(4)
11
(3)

26
(28)
(1)
27
14

$

866,477

$

906,969

$

1,009,277

$

969,783

$

722,905

(4)

20

300,931
42,713
73,968

192,546
37,845
132,400

224,075
54,480
167,827

194,724
50,151
22,594

8
29
(34)

55
(15)
227

56,021
67,197

53,786
86,020

45,274
121,604

76,213
85,816

87,841
95,749

4
(22)

(36)
(30)

171,685
20,945
254,226

165,521
9,674
243,569

187,978
10,561
252,094

260,563
11,437
238,034

171,004
20,071
260,192

4
117
4

4
(2)

17,713
1,871,876

$

279,837
33,085
112,257

18,276
1,908,994

18,589
2,008,168

17,398
2,105,626

17,263
1,642,494

(3)
(2)

3
14

8,152
4,105
97,662
56,355
(3,438)
(86)
(7,984)
154,766
2,026,642

31,993
3,942
91,469
55,487
(4,490)
(86)
(8,121)
170,194
2,079,188

31,939
3,942
92,143
54,013
(5,687)
(217)
(9,249)
166,884
2,175,052

8,152
3,942
90,535
55,217
(2,227)
(267)
(9,509)
145,843
2,251,469

6,000
3,658
78,870
56,313
(1,566)
(269)
(9,830)
133,176
1,775,670

(75)
4
7
2
23
2
(9)
(3)

36
12
24

$

$

$

$

(120)
68
19
16
14

(a) On September 19, 2008, the Federal Reserve established a special lending facility, the AML Facility, to provide liquidity to eligible money market mutual funds. The Firm participated in the AML Facility and had
ABCP investments totaling $14.5 billion, $6.0 billion, $11.2 billion, and $61.3 billion at June 30, 2009, March 31, 2009, December 31, 2008, and September 30, 2008, respectively. These ABCP investments were
recorded in other assets with the corresponding nonrecourse liability to the Federal Reserve Bank of Boston for the same amounts recorded in other borrowed funds.

Page 4
JPMORGAN CHASE & CO.
CONDENSED AVERAGE BALANCE SHEETS AND ANNUALIZED YIELDS
(in millions, except rates)
QUARTERLY TRENDS

YEAR-TO-DATE
2Q09 Change

2Q09
AVERAGE BALANCES
ASSETS
Deposits with banks
Federal funds sold and securities purchased
under resale agreements
Securities borrowed
Trading assets - debt instruments
Securities
Loans
Other assets (a)
Total interest-earning assets
Trading assets - equity instruments
Goodwill
Other intangible assets:
Mortgage servicing rights
All other intangible assets
All other noninterest-earning assets
TOTAL ASSETS
LIABILITIES
Interest-bearing deposits
Federal funds purchased and securities loaned or sold under
repurchase agreements
Commercial paper
Other borrowings and liabilities (b)
Beneficial interests issued by consolidated VIEs
Long-term debt
Total interest-bearing liabilities
Noninterest-bearing liabilities
TOTAL LIABILITIES
Preferred stock
Common stockholders' equity
TOTAL STOCKHOLDERS' EQUITY
TOTAL LIABILITIES AND
STOCKHOLDERS' EQUITY

$

1Q09

68,001

$

4Q08

88,587

$

3Q08

106,156

$

2Q08

41,303

$

1Q09

38,813

2Q08

(23) %

2009

75 %

$

2009 Change
2008

2008

78,237

$

35,394

121 %

142,226
122,235
245,444
354,216
697,908
36,638
1,666,668
63,507
48,273

160,986
120,752
252,098
281,420
726,959
27,411
1,658,213
62,748
48,071

205,182
123,523
269,576
174,652
752,524
56,322
1,687,935
72,782
46,838

164,980
134,651
298,760
119,443
536,890
37,237
1,333,264
92,300
45,947

155,664
100,322
302,053
109,834
537,964
15,629
1,260,279
99,525
45,781

(12)
1
(3)
26
(4)
34
1
1
-

(9)
22
(19)
223
30
134
32
(36)
5

151,554
121,498
248,753
318,019
712,353
32,050
1,662,464
63,130
48,173

154,764
91,906
312,519
99,796
532,281
7,815
1,234,475
89,168
45,740

(2)
32
(20)
219
34
310
35
(29)
5

$

12,256
5,218
242,450
2,038,372

$

11,141
5,443
281,503
2,067,119

$

14,837
5,586
339,887
2,167,865

$

11,811
5,512
267,525
1,756,359

$

9,947
5,823
247,344
1,668,699

10
(4)
(14)
(1)

23
(10)
(2)
22

$

11,702
5,329
261,868
2,052,666

$

9,110
6,012
234,743
1,619,248

28
(11)
12
27

$

672,350

$

736,460

$

777,604

$

589,348

$

612,305

(9)

10

$

704,228

$

606,218

203,348
47,323
111,477
17,990
229,336
1,221,779
315,965
1,537,744
4,549
126,406
130,955

28
11
(12)
49
6
(6)
(2)
(11)
3
-

43
(21)
86
(19)
20
22
18
22
NM
11
29

1,668,699

(1)

22

289,971
37,371
207,489
14,493
274,323
1,495,997
373,172
1,869,169
28,338
140,865
169,203
$

226,110
33,694
236,673
9,757
258,732
1,501,426
397,243
1,898,669
31,957
136,493
168,450

2,038,372

$

203,568
40,486
264,236
9,440
248,125
1,543,459
460,894
2,004,353
24,755
138,757
163,512

2,067,119

$

200,032
47,579
161,821
11,431
261,385
1,271,596
351,023
1,622,619
7,100
126,640
133,740

2,167,865

$

1,756,359

$

258,217
35,543
221,999
12,138
266,571
1,498,696
385,141
1,883,837
30,138
138,691
168,829
$

16

191,622
47,453
109,515
16,036
214,846
1,185,690
305,790
1,491,480
2,275
125,493
127,768

2,052,666

$

35
(25)
103
(24)
24
26
26
26
NM
11
32

1,619,248

27

AVERAGE RATES
INTEREST-EARNING ASSETS
Deposits with banks
Federal funds sold and securities purchased
under resale agreements (c)
Trading assets - debt instruments
Securities
Loans
Other assets (a)
Total interest-earning assets
INTEREST-BEARING LIABILITIES
Interest-bearing deposits
Federal funds purchased and securities sold
under repurchase agreements
Commercial paper
Other borrowings and liabilities (b)
Beneficial interests issued by consolidated VIEs
Long-term debt
Total interest-bearing liabilities
INTEREST RATE SPREAD
NET YIELD ON INTEREST-EARNING ASSETS
ADJUSTED FOR SECURITIZATIONS

1.45

%

2.03

%

3.34

%

3.04

%

3.87

%

1.78

%

4.03

0.41
4.91
3.64
5.65
0.80
4.00

1.06
5.27
4.16
5.87
2.44
4.41

2.14
6.18
5.14
6.44
3.06
5.12

3.00
6.06
5.09
6.31
3.29
5.22

3.23
5.59
5.27
6.36
3.97
5.34

0.74
5.09
3.87
5.76
1.50
4.20

3.46
5.67
5.36
6.72
3.97
5.60

0.70

0.93

1.53

2.26

2.36

0.82

2.72

0.23
0.24
1.32
1.59
2.60
1.04

0.36
0.47
1.46
1.57
2.73
1.23

0.95
1.17
2.56
3.79
3.87
2.01

2.63
2.05
2.84
2.87
3.31
2.61

2.73
2.17
3.77
2.24
3.27
2.71

0.29
0.35
1.39
1.58
2.67
1.14

3.00
2.79
4.39
2.92
3.52
3.07

2.96%
3.07%

3.18%
3.29%

3.11%
3.28%

2.61%
2.73%

2.63%
2.71%

3.06%
3.18%

2.53%
2.65%

3.37%

3.60%

3.55%

3.06%

3.06%

3.48%

%

3.00%

(a) Includes margin loans and the Firm's investment in asset-backed commercial paper under the Federal Reserve Bank of Boston's AML facility.
(b) Includes securities sold but not yet purchased, brokerage customer payables and advances from Federal Home Loan Banks.
(c) Includes securities borrowed.

Page 5
JPMORGAN CHASE & CO.
RECONCILIATION FROM REPORTED TO MANAGED SUMMARY
(in millions)

The Firm prepares its consolidated financial statements using accounting principles generally accepted in the United States of America ("U.S. GAAP"). That presentation, which is referred to as "reported basis," provides the reader with an understanding of the Firm's results
that can be tracked consistently from year to year and enables a comparison of the Firm's performance with other companies' U.S. GAAP financial statements.
In addition to analyzing the Firm's results on a reported basis, management reviews the Firm's results and the results of lines of business on a "managed" basis, which is a non-GAAP financial measure. The Firm's definition of managed basis starts with the reported U.S.
GAAP results and includes certain reclassifications that assume credit card loans securitized by Card Services remain on the balance sheet and presents revenue on a fully taxable-equivalent ("FTE") basis. These adjustments do not have any impact on net income as
reported by the lines of business or by the Firm as a whole. The impact of these adjustments are summarized below. For additional information about managed basis, please refer to the Glossary of Terms on page 37.
QUARTERLY TRENDS

YEAR-TO-DATE
2Q09 Change

2Q09
CREDIT CARD INCOME
Credit card income - reported
Impact of:
Credit card securitizations
Credit card income - managed
OTHER INCOME
Other income - reported
Impact of:
Tax-equivalent adjustments
Other income - managed
TOTAL NONINTEREST REVENUE
Total noninterest revenue - reported
Impact of:
Credit card securitizations
Tax-equivalent adjustments
Total noninterest revenue - managed
NET INTEREST INCOME
Net interest income - reported
Impact of:
Credit card securitizations
Tax-equivalent adjustments
Net interest income - managed
TOTAL NET REVENUE
Total net revenue - reported
Impact of:
Credit card securitizations
Tax-equivalent adjustments
Total net revenue - managed
PRE-PROVISION PROFIT
Total pre-provision profit - reported
Impact of:
Credit card securitizations
Tax-equivalent adjustments
Total pre-provision profit - managed
PROVISION FOR CREDIT LOSSES
Provision for credit losses - reported
Impact of:
Credit card securitizations
Provision for credit losses - managed
INCOME TAX EXPENSE
Income tax expense (benefit) - reported
Impact of:
Tax-equivalent adjustments
Income tax expense (benefit) - managed

1Q09

4Q08

3Q08

2Q08

$

1,719

$

1,837

$

2,049

$

1,771

$

$

(294)
1,425

$

(540)
1,297

$

(710)
1,339

$

(843)
928

$

1Q09

1,803

2Q08

2009

2008

2009 Change
2008

(6) %

(5) %

$

3,556

$

3,599

(1) %

(843)
960

46
10

65
48

$

(834)
2,722

$

(1,780)
1,819

53
50

NM

$

10

$

50

$

593

$

(115)

$

(138)

(80)

$

60

$

1,691

(96)

$

335
345

$

337
387

$

556
1,149

$

323
208

$

247
109

(1)
(11)

36
217

$

672
732

$

450
2,141

49
(66)

$

12,953

$

11,658

$

3,394

$

5,743

$

10,105

11

28

$

24,611

$

19,336

27

$

(294)
335
12,994

$

(540)
337
11,455

$

(710)
556
3,240

$

(843)
323
5,223

$

(843)
247
9,509

46
(1)
13

65
36
37

$

(834)
672
24,449

$

(1,780)
450
18,006

53
49
36

$

12,670

$

13,367

$

13,832

$

8,994

$

8,294

(5)

53

$

26,037

$

15,953

63

$

1,958
87
14,715

$

2,004
96
15,467

$

1,938
98
15,868

$

1,716
155
10,865

$

1,673
202
10,169

(2)
(9)
(5)

17
(57)
45

$

3,962
183
30,182

$

3,291
326
19,570

20
(44)
54

$

25,623

$

25,025

$

17,226

$

14,737

$

18,399

2

39

$

50,648

$

35,289

44

$

1,664
422
27,709

$

1,464
433
26,922

$

1,228
654
19,108

$

873
478
16,088

$

830
449
19,678

14
(3)
3

100
(6)
41

$

3,128
855
54,631

$

1,511
776
37,576

107
10
45

$

12,103

$

11,652

$

5,971

$

3,600

$

6,222

4

95

$

23,755

$

14,181

68

$

1,664
422
14,189

$

1,464
433
13,549

$

1,228
654
7,853

$

873
478
4,951

$

830
449
7,501

14
(3)
5

100
(6)
89

$

3,128
855
27,738

$

1,511
776
16,468

107
10
68

$

8,031

$

8,596

$

7,313

$

5,787

$

3,455

(7)

132

$

16,627

$

7,879

111

$

1,664
9,695

$

1,464
10,060

$

1,228
8,541

$

873
6,660

$

830
4,285

14
(4)

100
126

$

3,128
19,755

$

1,511
9,390

107
110

$

1,351

$

915

$

(719)

$

(2,133)

$

764

48

77

$

2,266

$

1,926

18

$

422
1,773

$

433
1,348

$

654
(65)

$

478
(1,655)

$

449
1,213

(3)
32

(6)
46

$

855
3,121

$

776
2,702

10
16

Page 6
JPMORGAN CHASE & CO.
LINE OF BUSINESS FINANCIAL HIGHLIGHTS - MANAGED BASIS
(in millions, except ratio data)
QUARTERLY TRENDS

YEAR-TO-DATE
2Q09 Change

2Q09
TOTAL NET REVENUE (FTE)
Investment Bank (a)
Retail Financial Services
Card Services
Commercial Banking
Treasury & Securities Services
Asset Management
Corporate/Private Equity (a)
TOTAL NET REVENUE
TOTAL PRE-PROVISION PROFIT
Investment Bank (a)
Retail Financial Services
Card Services
Commercial Banking
Treasury & Securities Services
Asset Management
Corporate/Private Equity (a)
TOTAL PRE-PROVISION PROFIT
NET INCOME (LOSS)
Investment Bank
Retail Financial Services
Card Services
Commercial Banking
Treasury & Securities Services
Asset Management
Corporate/Private Equity
TOTAL NET INCOME
AVERAGE EQUITY (b)
Investment Bank
Retail Financial Services
Card Services
Commercial Banking
Treasury & Securities Services
Asset Management
Corporate/Private Equity
TOTAL AVERAGE EQUITY
RETURN ON EQUITY (b)
Investment Bank
Retail Financial Services
Card Services
Commercial Banking
Treasury & Securities Services
Asset Management

$

$

$

$

$

$

$

$

1Q09

7,301
7,970
4,868
1,453
1,900
1,982
2,235
27,709

3,234
3,891
3,535
918
612
628
1,371
14,189

1,471
15
(672)
368
379
352
808
2,721

33,000
25,000
15,000
8,000
5,000
7,000
47,865
140,865

18 %
(18)
18
30
20

$

$

$

$

$

$

$

$

4Q08

8,371
8,835
5,129
1,402
1,821
1,703
(339)
26,922

3,597
4,664
3,783
849
502
405
(251)
13,549

1,606
474
(547)
338
308
224
(262)
2,141

33,000
25,000
15,000
8,000
5,000
7,000
43,493
136,493

20 %
8
(15)
17
25
13

$

$

$

$

$

$

$

$

3Q08

(272)
8,684
4,908
1,479
2,249
1,658
402
19,108

(3,013)
4,638
3,419
980
910
445
474
7,853

(2,364)
624
(371)
480
533
255
1,545
702

33,000
25,000
15,000
8,000
4,500
7,000
46,257
138,757

(28) %
10
(10)
24
47
14

$

$

$

$

$

$

$

$

2Q08

4,066
4,963
3,887
1,125
1,953
1,961
(1,867)
16,088

$

$

250
2,184
2,693
639
614
599
(2,028)
4,951

$

$

882
64
292
312
406
351
(1,780)
527

$

$

26,000
17,000
14,100
7,000
3,500
5,500
53,540
126,640

13
1
8
18
46
25

$

$

%

1Q09

5,500
5,110
3,775
1,106
2,019
2,064
104
19,678

2Q08

2009

(13) %
(10)
(5)
4
4
16
NM
3

33 %
56
29
31
(6)
(4)
NM
41

$

766
2,430
2,590
630
702
664
(281)
7,501

(10)
(17)
(7)
8
22
55
NM
5

322
60
36
46
(13)
(5)
NM
89

$

394
503
250
355
425
395
(319)
2,003

(8)
(97)
(23)
9
23
57
NM
27

273
(97)
NM
4
(11)
(11)
NM
36

10
3

42
47
6
14
43
38
(15)
11

23,319
17,000
14,100
7,000
3,500
5,066
56,421
126,406

7
12
7
20
49
31

%

$

$

$

$

$

$

2009 Change
2008

2008

15,672
16,805
9,997
2,855
3,721
3,685
1,896
54,631

6,831
8,555
7,318
1,767
1,114
1,033
1,120
27,738

3,077
489
(1,219)
706
687
576
546
4,862

33,000
25,000
15,000
8,000
5,000
7,000
45,691
138,691

19 %
4
(16)
18
28
17

$

$

$

$

$

$

$

$

8,541
9,873
7,679
2,173
3,932
3,965
1,413
37,576

83 %
70
30
31
(5)
(7)
34
45

1,254
4,621
5,222
1,212
1,387
1,242
1,530
16,468

445
85
40
46
(20)
(17)
(27)
68

307
192
859
647
828
751
792
4,376

NM
155
NM
9
(17)
(23)
(31)
11

22,659
17,000
14,100
7,000
3,500
5,033
56,201
125,493

46
47
6
14
43
39
(19)
11

3
2
12
19
48
30

%

(a) In the second quarter of 2009, Investment Bank ("IB") began reporting credit reimbursement from TSS as a component of total net revenue, whereas TSS continues to report its credit reimbursement to IB as a separate line item on its income statement
(not part of net revenue). Corporate/Private Equity includes an adjustment to offset IB's inclusion of the credit reimbursement in total net revenue. Prior periods have been revised for IB and Corporate/Private Equity to reflect this presentation.
(b) Each business segment is allocated capital by taking into consideration stand-alone peer comparisons, economic risk measures and regulatory capital requirements. The amount of capital assigned to each business is referred to as equity.

Page 7
JPMORGAN CHASE & CO.
INVESTMENT BANK
FINANCIAL HIGHLIGHTS
(in millions, except ratio data)
QUARTERLY TRENDS

YEAR-TO-DATE
2009 Change
2008

2Q09 Change
2Q09
INCOME STATEMENT
REVENUE
Investment banking fees
Principal transactions
Lending & deposit-related fees
Asset management, administration and commissions
All other income (a)
Noninterest revenue
Net interest income
TOTAL NET REVENUE (b)

$

Provision for credit losses

REVENUE BY REGION (a)
Americas
Europe/Middle East/Africa
Asia/Pacific
Total net revenue

$

1,380
3,515
138
692
(56)
5,669
2,702
8,371

$

3Q08

1,373
(6,160)
138
764
139
(3,746)
3,474
(272)

$

2Q08

1,593
(922)
118
847
(248)
1,388
2,678
4,066

$

1Q09

1,735
838
105
709
(196)
3,191
2,309
5,500

2Q08

2009

62 %
(48)
21
4
(93)
(14)
(10)
(13)

29 %
120
59
1
45
52
6
33

$

2008

3,619
5,356
305
1,409
(164)
10,525
5,147
15,672

$

2,941
40
207
1,453
(232)
4,409
4,132
8,541

23 %
NM
47
(3)
29
139
25
83
105

$

1,210

765

234

398

(28)

119

2,081

1,016

2,677
1,390
4,067

FINANCIAL RATIOS
ROE
ROA
Overhead ratio
Compensation expense as a % of total net revenue
REVENUE BY BUSINESS
Investment banking fees:
Advisory
Equity underwriting
Debt underwriting
Total investment banking fees
Fixed income markets
Equity markets
Credit portfolio (a)
Total net revenue

2,239
1,841
167
717
(108)
4,856
2,445
7,301

4Q08

871

NONINTEREST EXPENSE
Compensation expense
Noncompensation expense
TOTAL NONINTEREST EXPENSE
Income (loss) before income tax expense
Income tax expense (benefit) (c)
NET INCOME (LOSS)

1Q09

3,330
1,444
4,774

1,166
1,575
2,741

2,162
1,654
3,816

3,132
1,602
4,734

(20)
(4)
(15)

(15)
(13)
(14)

6,007
2,834
8,841

4,373
2,914
7,287

(1)
14
(8)

NM
NM
273

2,363
892
1,471

$

18 %
0.83
56
37

$

$

$

$

393
1,103
743
2,239
4,929
708
(575)
7,301

4,177
2,235
889
7,301

2,387
781
1,606

$

20 %
0.89
57
40

$

$

$

$

479
308
593
1,380
4,889
1,773
329
8,371

4,800
2,595
976
8,371

(3,778)
(1,414)
(2,364)

$

(28) %
(1.08)
NM
NM

$

$

$

$

579
330
464
1,373
(1,671)
(94)
120
(272)

(2,203)
2,026
(95)
(272)

16
(866)
882

$

13 %
0.39
94
53

$

$

$

$

576
518
499
1,593
815
1,650
8
4,066

1,072
2,517
477
4,066

368
(26)
394

$

7 %
0.19
86
57

$

$

$

$

4,750
1,673
3,077

$

19 %
0.86
56
38

370
542
823
1,735
2,347
1,079
339
5,500

(18)
258
25
62
1
(60)
NM
(13)

6
104
(10)
29
110
(34)
NM
33

3,185
1,519
796
5,500

(13)
(14)
(9)
(13)

31
47
12
33

$

$

$

$

872
1,411
1,336
3,619
9,818
2,481
(246)
15,672

8,977
4,830
1,865
15,672

238
(69)
307

37
(3)
21
NM
NM
NM

3 %
0.08
85
51

$

$

$

$

853
901
1,187
2,941
2,813
2,055
732
8,541

2
57
13
23
249
21
NM
83

3,741
3,167
1,633
8,541

140
53
14
83

(a) Treasury & Securities Services ("TSS") was charged a credit reimbursement related to certain exposures managed within the Investment Bank credit portfolio on behalf of clients shared with TSS. IB recognizes this credit reimbursement
in its credit portfolio business in all other income. Prior periods have been revised to conform with the current presentation.
(b) Total net revenue included tax-equivalent adjustments, predominantly due to income tax credits related to affordable housing and alternative energy investments, as well as, tax-exempt income from municipal bond investments, of $334 million,
$365 million, $583 million, $427 million, and $404 million, for the quarters ended June 30, 2009, March 31, 2009, December 31, 2008, September 30, 2008, and June 30, 2008, respectively, and $699 million and $693 million for year-to-date 2009
and 2008, respectively.
(c) The income tax benefit in the third quarter of 2008 is predominantly the result of reduced deferred tax liabilities on overseas earnings.

Page 8
JPMORGAN CHASE & CO.
INVESTMENT BANK
FINANCIAL HIGHLIGHTS, CONTINUED
(in millions, except headcount and ratio data)
QUARTERLY TRENDS

YEAR-TO-DATE
2009 Change
2008

2Q09 Change
2Q09
SELECTED BALANCE SHEET DATA (Period-end)
Loans:
Loans retained (a)
Loans held-for-sale & loans at fair value
Total loans
Equity
SELECTED BALANCE SHEET DATA (Average)
Total assets
Trading assets - debt and equity instruments
Trading assets - derivative receivables
Loans:
Loans retained (a)
Loans held-for-sale & loans at fair value
Total loans
Adjusted assets (b)
Equity

Net charge-off (recovery) rate (a) (d)
Allowance for loan losses to period-end loans (a) (d)
Allowance for loan losses to average loans (a) (d) (e)
Allowance for loan losses to nonperforming loans (c)
Nonperforming loans to period-end loans
Nonperforming loans to average loans

4Q08

3Q08

2Q08

1Q09

$

64,500
6,814
71,314
33,000

$

66,506
10,993
77,499
33,000

$

71,357
13,660
85,017
33,000

$

73,347
16,667
90,014
33,000

$

70,690
19,699
90,389
26,000

$

710,825
265,336
100,536

$

733,166
272,998
125,021

$

869,159
306,168
153,875

$

890,040
360,821
105,462

$

2Q08

2009

2008

(3) %
(38)
(8)
-

(9) %
(65)
(21)
27

$

64,500
6,814
71,314
33,000

$

70,690
19,699
90,389
26,000

(9) %
(65)
(21)
27

814,860
367,184
99,395

(3)
(3)
(20)

(13)
(28)
1

$

721,934
269,146
112,711

$

785,344
368,320
94,814

(8)
(27)
19

68,224
8,934
77,158
531,632
33,000

$

70,041
12,402
82,443
589,163
33,000

73,110
16,378
89,488
685,242
33,000

69,022
17,612
86,634
694,459
26,000

76,239
20,440
96,679
676,777
23,319

(3)
(28)
(6)
(10)
-

(11)
(56)
(20)
(21)
42

69,128
10,658
79,786
560,239
33,000

75,173
20,026
95,199
669,598
22,659

(8)
(47)
(16)
(16)
46

25,783

Headcount
CREDIT DATA AND QUALITY STATISTICS
Net charge-offs (recoveries)
Nonperforming assets:
Loans (c)
Derivative receivables
Assets acquired in loan satisfactions
Total nonperforming assets
Allowance for credit losses:
Allowance for loan losses
Allowance for lending-related commitments
Total allowance for credit losses

1Q09

26,142

27,938

30,993

37,057

(1)

(30)

25,783

37,057

(30)

NM

NM

5

NM

96
(30)
32
49

NM
NM
208
NM

3,519
704
311
4,534

313
76
101
490

NM
NM
208
NM

9
19
10

110
(25)
88

5,101
351
5,452

2,429
469
2,898

110
(25)
88

433

$

36

$

87

$

13

$

(8)

3,519
704
311
4,534

1,795
1,010
236
3,041

1,175
1,079
247
2,501

436
34
113
583

313
76
101
490

5,101
351
5,452

4,682
295
4,977

3,444
360
3,804

2,654
463
3,117

2,429
469
2,898

2.55 %
7.91
7.48
150
4.93
4.56

0.21 %
7.04
6.68
269
2.32
2.18

0.47 %
4.83
4.71
301
1.38
1.31

0.07 %
3.62
3.85
657
0.48
0.50

(0.04) %
3.44
3.19
843
0.35
0.32

$

469

$

1.37 %
7.91
7.38
150
4.93
4.41

0.01 %
3.44
3.23
843
0.35
0.33

(a) Loans retained included credit portfolio loans, leveraged leases and other accrual loans, and excluded loans held-for-sale and loans accounted for at fair value.
(b) Adjusted assets, a non-GAAP financial measure, equals total assets minus (1) securities purchased under resale agreements and securities borrowed less securities sold, not yet purchased; (2) assets of variable interest entities ("VIEs")
consolidated under FIN 46R; (3) cash and securities segregated and on deposit for regulatory and other purposes; (4) goodwill and intangibles; (5) securities received as collateral; and (6) investments purchased under the Asset-Backed
Commercial Paper Money Market Mutual Fund Liquidity Facility. The amount of adjusted assets is presented to assist the reader in comparing the Investment Bank's ("IB") asset and capital levels to other investment banks in the
securities industry. Asset-to-equity leverage ratios are commonly used as one measure to assess a company’s capital adequacy. IB believes an adjusted asset amount that excludes the assets discussed above, which were considered
to have a low risk profile, provides a more meaningful measure of balance sheet leverage in the securities industry.
(c) Nonperforming loans included loans held-for-sale and loans at fair value of $112 million, $57 million, $32 million, $32 million, and $25 million, at June 30, 2009, March 31, 2009, December 31, 2008, September 30, 2008, and June 30, 2008,
respectively, which were excluded from the allowance coverage ratios. Nonperforming loans excluded distressed loans held-for-sale that were purchased as part of IB's proprietary activities.
(d) Loans held-for-sale and loans at fair value were excluded when calculating the allowance coverage ratio and net charge-off (recovery) rate.
(e) Excluding the impact of a loan originated in March 2008 to Bear Stearns, the adjusted ratio would be 3.46% and 3.40% for the quarter ended June 30, 2008, and the six months ended June 30, 2008, respectively. The average balance of the
loan extended to Bear Stearns was $6.0 billion and $3.8 billion for the quarter ended June 30, 2008, and the six months ended June 30, 2008, respectively.

Page 9
JPMORGAN CHASE & CO.
INVESTMENT BANK
FINANCIAL HIGHLIGHTS, CONTINUED
(in millions, except ratio and rankings data)
QUARTERLY TRENDS

YEAR-TO-DATE
2Q09 Change

2Q09

1Q09

MARKET RISK - AVERAGE TRADING AND CREDIT PORTFOLIO
VAR - 99% CONFIDENCE LEVEL (a)
Trading activities:
Fixed income
$
Foreign exchange
Equities
Commodities and other
Diversification (b)
Total trading VaR (c)

249
26
77
34
(136)
250

Credit portfolio VaR (d)
Diversification (b)
Total trading and credit portfolio VaR

133
(116)
267

$

$

4Q08

218
40
162
28
(159)
289
182
(135)
336

$

June 30, 2009 YTD
MARKET SHARES AND RANKINGS (e)
Global debt, equity and equity-related
Global syndicated loans
Global long-term debt (f)
Global equity and equity-related (g)
Global announced M&A (h)
U.S. debt, equity and equity-related
U.S. syndicated loans
U.S. long-term debt (f)
U.S. equity and equity-related (g)
U.S. announced M&A (h)

Market Share
11%
10%
9%
16%
32%
15%
25%
15%
17%
48%

Rankings
#1
#1
#1
#1
#3
#1
#1
#1
#1
#3

$

$

3Q08

276
55
87
30
(146)
302
165
(140)
327

$

2Q08

183
20
80
41
(104)
220
47
(49)
218

$

$

$

1Q09

2Q08

155
26
30
31
(92)
150

14 %
(35)
(52)
21
14
(13)

35
(36)
149

(27)
14
(21)

2009

61 %
157
10
(48)
67
280
(222)
79

$

$

2009 Change
2008

2008

234
33
119
31
(148)
269
157
(125)
301

$

$

137
30
31
29
(91)
136
33
(34)
135

71 %
10
284
7
(63)
98
376
(268)
123

Full Year 2008
Market Share
10%
12%
9%
10%
27%
15%
25%
15%
11%
33%

Rankings
#1
#1
#3
#1
#2
#2
#1
#2
#1
#2

(a) Results for second quarter 2008 include one month of the combined Firm's results and two months of heritage JPMorgan Chase & Co. results.
(b) Average VaRs were less than the sum of the VaRs of their market risk components, which was due to risk offsets resulting from portfolio diversification. The diversification effect reflected the fact that the risks were not perfectly correlated.
The risk of a portfolio of positions is usually less than the sum of the risks of the positions themselves.
(c) Trading VaR includes predominantly all trading activities in IB; however, particular risk parameters of certain products are not fully captured, for example, correlation risk. Trading VaR does not include VaR related to held-for-sale funded loans
and unfunded commitments, nor the debit valuation adjustments ("DVA") taken on derivative and structured liabilities to reflect the credit quality of the Firm. Trading VaR also does not include the MSR portfolio or VaR related to other corporate
functions, such as Corporate/Private Equity. Beginning in the fourth quarter of 2008, trading VaR includes the estimated credit spread sensitivity of certain mortgage products.
(d) Included VaR on derivative credit valuation adjustments ("CVA"), hedges of the CVA and mark-to-market hedges of the retained loan portfolio, which are all reported in principal transactions revenue. This VaR does not include the retained
loan portfolio.
(e) Source: Thomson Reuters. Full year 2008 results are pro forma for the Bear Stearns merger.
(f) Includes asset-backed securities, mortgage-backed securities and municipal securities.
(g) Includes rights offerings; U.S. domiciled equity and equity-related transactions.
(h) Global announced M&A is based upon rank value; all other rankings are based upon proceeds, with full credit to each book manager/equal if joint. Because of joint assignments, market share of all participants will add up to more than 100%.
Global and U.S. announced M&A market share and ranking for 2008 include transactions withdrawn since December 31, 2008. U.S. announced M&A represents any U.S. involvement ranking.

Page 10
JPMORGAN CHASE & CO.
RETAIL FINANCIAL SERVICES
FINANCIAL HIGHLIGHTS
(in millions, except ratio and headcount data)
QUARTERLY TRENDS

YEAR-TO-DATE
2Q09 Change

2Q09
INCOME STATEMENT
REVENUE
Lending & deposit-related fees
Asset management, administration and commissions
Mortgage fees and related income
Credit card income
Other income
Noninterest revenue
Net interest income
TOTAL NET REVENUE

$

1Q09

1,003
425
807
411
294
2,940
5,030
7,970

$

4Q08

948
435
1,633
367
214
3,597
5,238
8,835

$

3Q08

1,050
412
1,962
367
183
3,974
4,710
8,684

$

2Q08

538
346
438
204
206
1,732
3,231
4,963

$

1Q09

497
375
696
194
198
1,960
3,150
5,110

2Q08

6 %
(2)
(51)
12
37
(18)
(4)
(10)

2009

102 %
13
16
112
48
50
60
56

$

2009 Change
2008

2008

1,951
860
2,440
778
508
6,537
10,268
16,805

$

958
752
1,221
368
350
3,649
6,224
9,873

104 %
14
100
111
45
79
65
70

Provision for credit losses

3,846

3,877

3,576

2,056

1,585

(1)

143

7,723

4,273

81

NONINTEREST EXPENSE
Compensation expense
Noncompensation expense
Amortization of intangibles
TOTAL NONINTEREST EXPENSE

1,631
2,365
83
4,079

1,631
2,457
83
4,171

1,604
2,345
97
4,046

1,120
1,559
100
2,779

1,184
1,396
100
2,680

(4)
(2)

38
69
(17)
52

3,262
4,822
166
8,250

2,344
2,708
200
5,252

39
78
(17)
57

845
342
503

(94)
(90)
(97)

(95)
(91)
(97)

Income (loss) before income tax expense
Income tax expense (benefit)
NET INCOME (LOSS)

$

FINANCIAL RATIOS
ROE
Overhead ratio
Overhead ratio excluding core deposit intangibles (a)
SELECTED BALANCE SHEET DATA (Period-end)
Assets
Loans:
Loans retained
Loans held-for-sale & loans at fair value (b)
Total loans
Deposits
Equity
SELECTED BALANCE SHEET DATA (Average)
Assets
Loans:
Loans retained
Loans held-for-sale & loans at fair value (b)
Total loans
Deposits
Equity
Headcount

45
30
15

$

%
51
50

$

399,916

410,228

$

8 %
47
46

$

353,934
13,192
367,126
371,241
25,000
$

787
313
474

412,505

423,472

$

10 %
47
45

$

364,220
12,529
376,749
380,140
25,000
$

1,062
438
624

419,831

423,699

$

1 %
56
54

$

368,786
9,996
378,782
360,451
25,000
$

128
64
64

426,435

12 %
52
51

$

265,367

$

832
343
489

348
156
192

$

4 %
49
48

265,845

(3)

50

223,047
16,282
239,329
223,121
17,000

371,153
10,223
381,376
353,660
25,000
$

$

(3)
5
(3)
(2)
-

59
(19)
53
66
47

267,808

(3)

53

$

399,916

2 %
53
51

$

416,813

$

265,845

50

223,047
16,282
239,329
223,121
17,000

353,934
13,192
367,126
371,241
25,000
$

139
120
155

59
(19)
53
66
47

263,911

58

359,372
19,043
378,415
377,259
25,000

366,925
16,526
383,451
370,278
25,000

369,172
13,848
383,020
358,523
25,000

222,640
16,037
238,677
222,180
17,000

221,132
20,492
241,624
226,487
17,000

(2)
15
(1)
2
-

63
(7)
57
67
47

363,127
17,792
380,919
373,788
25,000

217,859
19,167
237,026
226,021
17,000

67
(7)
61
65
47

103,733

100,677

102,007

101,826

69,550

3

49

103,733

69,550

49

(a) Retail Financial Services uses the overhead ratio (excluding the amortization of core deposit intangibles ("CDI")), a non-GAAP financial measure, to evaluate the underlying expense trends of the business. Including CDI amortization expense
in the overhead ratio calculation results in a higher overhead ratio in the earlier years and a lower overhead ratio in later years; this method would result in an improving overhead ratio over time, all things remaining equal. This non-GAAP ratio
excludes Retail Banking's core deposit intangibles amortization expense related to the 2006 Bank of New York transaction and the 2004 Bank One merger of $82 million, $83 million, $97 million, $99 million, and $99 million for the quarters
ending June 30, 2009, March 31, 2009, December 31, 2008, September 30, 2008, and June 30, 2008, respectively, and $165 million and $198 million for year-to-date 2009 and 2008, respectively.
(b) Loans at fair value consist of prime mortgages originated with the intent to sell that are accounted for at fair value and classified as trading assets on the Consolidated Balance Sheets. These loans totaled $11.3 billion, $8.9 billion, $8.0 billion,
$8.6 billion, and $14.1 billion at June 30, 2009, March 31, 2009, December 31, 2008, September 30, 2008, and June 30, 2008, respectively. Average balances of these loans totaled $16.2 billion, $13.4 billion, $12.0 billion, $14.5 billion, and
$16.9 billion for the quarters ended June 30, 2009, March 31, 2009, December 31, 2008, September 30, 2008, and June 30, 2008, respectively, and $14.9 billion and $15.2 billion for year-to-date 2009 and 2008, respectively.

Page 11
JPMORGAN CHASE & CO.
RETAIL FINANCIAL SERVICES
FINANCIAL HIGHLIGHTS, CONTINUED
(in millions, except ratio data)
QUARTERLY TRENDS

YEAR-TO-DATE
2Q09 Change

2Q09
CREDIT DATA AND QUALITY STATISTICS
Net charge-offs
Nonperforming loans (a) (b) (c)
Nonperforming assets (a) (b) (c)
Allowance for loan losses
Net charge-off rate (d)
Net charge-off rate excluding purchased credit-impaired loans (d) (e)
Allowance for loan losses to ending loans (d)
Allowance for loan losses to ending loans excluding purchased credit-impaired loans (d) (e)
Allowance for loan losses to nonperforming loans (a) (d)
Nonperforming loans to total loans
Nonperforming loans to total loans excluding purchased credit-impaired loans (a)

$

1Q09

2,649
8,995
10,554
11,832
2.96 %
3.89
3.34
4.41
135
2.45
3.19

$

4Q08

2,176
7,978
9,846
10,619
2.41 %
3.16
2.92
3.84
138
2.12
2.76

$

3Q08

1,701
6,784
9,077
8,918
1.83 %
2.41
2.42
3.19
136
1.79
2.34

$

2Q08

1,326
5,724
8,085
7,517
2.37 %
2.37
2.03
2.56
136
1.50
1.88

$

1Q09

1,025
4,574
5,333
5,062
1.86 %
1.86
2.27
2.27
115
1.91
1.91

2Q08

22 %
13
7
11

2009

158 %
97
98
134

$

2009 Change
2008

2008

4,825
8,995
10,554
11,832
2.68 %
3.53
3.34
4.41
135
2.45
3.19

$

1,850
4,574
5,333
5,062

161 %
97
98
134

1.71 %
1.71
2.27
2.27
115
1.91
1.91

(a) Excludes purchased credit-impaired loans accounted for under SOP 03-3 that were acquired as part of the Washington Mutual transaction. These loans are accounted for on a pool basis and the pools are considered to be performing under SOP 03-3.
(b) Nonperforming loans and assets included loans held-for-sale and loans accounted for at fair value of $203 million, $264 million, $236 million, $207 million, and $180 million at June 30, 2009, March 31, 2009, December 31, 2008, September 30, 2008, and
June 30, 2008, respectively. Certain of these loans are classified as trading assets on the Consolidated Balance Sheets.
(c) Nonperforming loans and assets excluded: (1) loans eligible for repurchase, as well as loans repurchased from Government National Mortgage Association ("GNMA") pools that are insured by U.S. government agencies, of $4.7 billion, $4.6 billion,
$3.3 billion, $1.8 billion, and $1.9 billion at June 30, 2009, March 31, 2009, December 31, 2008, September 30, 2008, and June 30, 2008, respectively; and (2) student loans that are 90 days past due and still accruing, which are insured by U.S.
government agencies under the Federal Family Education Loan Program, of $473 million, $433 million, $437 million, $405 million, and $394 million at June 30, 2009, March 31, 2009, December 31, 2008, September 30, 2008, and June 30, 2008,
respectively. These amounts for GNMA and student loans are excluded, as reimbursement is proceeding normally.
(d) Loans held-for-sale and loans accounted for at fair value were excluded when calculating the allowance coverage ratio and the net charge-off rate.
(e) Excludes the impact of purchased credit-impaired loans accounted for under SOP 03-3 that were acquired as part of the Washington Mutual transaction. These loans were accounted for at fair value on the acquisition date, which incorporated
management's estimate, as of that date, of credit losses over the remaining life of the portfolio. No allowance for loan losses has been recorded for these loans as of June 30, 2009, March 31, 2009, December 31, 2008, and September 30, 2008,
respectively.

Page 12
JPMORGAN CHASE & CO.
RETAIL FINANCIAL SERVICES
FINANCIAL HIGHLIGHTS, CONTINUED
(in millions, except ratio data and where otherwise noted)
QUARTERLY TRENDS

YEAR-TO-DATE
2Q09 Change

2Q09

1Q09

4Q08

3Q08

2Q08

1Q09

2Q08

2009

2009 Change
2008

2008

RETAIL BANKING
Noninterest revenue
Net interest income
Total net revenue
Provision for credit losses
Noninterest expense
Income before income tax expense
Net income

$

$

Overhead ratio
Overhead ratio excluding core deposit intangibles (a)
BUSINESS METRICS (in billions)
Business banking origination volume
End-of-period loans owned
End-of-period deposits:
Checking
Savings
Time and other
Total end-of-period deposits
Average loans owned
Average deposits:
Checking
Savings
Time and other
Total average deposits
Deposit margin
Average assets
CREDIT DATA AND QUALITY STATISTICS
Net charge-offs
Net charge-off rate
Nonperforming assets

1,803
2,719
4,522
361
2,557
1,604
970

$

$

57 %
55

1,718
2,614
4,332
325
2,580
1,427
863

$

$

60 %
58

1,834
2,687
4,521
268
2,533
1,720
1,040

$

$

56 %
54

1,089
1,756
2,845
70
1,580
1,195
723

$

$

56 %
52

1,062
1,671
2,733
62
1,557
1,114
674

5 %
4
4
11
(1)
12
12

70 %
63
65
482
64
44
44

$

$

57 %
53

3,521
5,333
8,854
686
5,137
3,031
1,833

$

$

58 %
56

2,028
3,216
5,244
111
3,119
2,014
1,219

74 %
66
69
NM
65
50
50

59 %
56

$

0.6
17.8

$

0.5
18.2

$

0.8
18.4

$

1.2
18.6

$

1.7
16.5

20
(2)

(65)
8

$

1.1
17.8

$

3.5
16.5

(69)
8

$

114.1
150.4
78.9
343.4
18.0

$

113.9
152.4
86.5
352.8
18.4

$

109.2
144.0
89.1
342.3
18.2

$

106.7
146.4
85.8
338.9
16.6

$

69.1
105.8
37.0
211.9
16.2

(1)
(9)
(3)
(2)

65
42
113
62
11

$

114.1
150.4
78.9
343.4
18.2

$

69.1
105.8
37.0
211.9
16.0

65
42
113
62
14

$
$

$

$
$

$

$

$

$

$

114.2
$
151.2
82.7
348.1
2.92 %
29.1
$

109.4
$
148.2
88.2
345.8
2.85 %
30.2
$

105.8
$
145.3
88.7
339.8
2.94 %
28.7
$

68.0
$
105.4
36.7
210.1
3.06 %
25.6
$

68.4
105.9
39.6
213.9
2.88 %
25.7

4
2
(6)
1

67
43
109
63

$

(4)

13

$

211
$
4.70 %
686
$

175
$
3.86 %
579
$

168
$
3.67 %
424
$

68
$
1.63 %
380
$

61
1.51 %
337

21

246

$

18

104

$

20

2

$

$

111.8
$
149.6
85.6
347.0
2.89 %
29.6
$

67.3
103.1
43.6
214.0
2.76 %
25.5

66
45
96
62

386
$
4.28 %
686
$

110
1.38 %
337

251

16

104

RETAIL BRANCH BUSINESS METRICS
Investment sales volume
Number of:
Branches
ATMs
Personal bankers
Sales specialists
Active online customers (in thousands)
Checking accounts (in thousands)

$

5,292

5,203
14,144
15,959
5,485
13,930
25,252

$

4,398

5,186
14,159
15,544
5,454
12,882
24,984

$

3,956

5,474
14,568
15,825
5,661
11,710
24,499

$

4,389

5,423
14,389
15,491
5,899
11,682
24,490

$

5,211

3,157
9,310
9,995
4,116
7,180
11,336

3
1
8
1

65
52
60
33
94
123

9,690

$

5,203
14,144
15,959
5,485
13,930
25,252

9,295

4

3,157
9,310
9,995
4,116
7,180
11,336

65
52
60
33
94
123

(a) Retail Banking uses the overhead ratio (excluding the amortization of core deposit intangibles ("CDI")), a non-GAAP financial measure, to evaluate the underlying expense trends of the business. Including CDI amortization expense in the
overhead ratio calculation results in a higher overhead ratio in the earlier years and a lower overhead ratio in later years; this method would result in an improving overhead ratio over time, all things remaining equal. This non-GAAP ratio
excludes Retail Banking's core deposit intangibles amortization expense related to the 2006 Bank of New York transaction and the 2004 Bank One merger of $82 million, $83 million, $97 million, $99 million, and $99 million for the quarters
ending June 30, 2009, March 31, 2009, December 31, 2008, September 30, 2008, and June 30, 2008, respectively, and $165 million and $198 million for year-to-date 2009 and 2008, respectively.

Page 13
JPMORGAN CHASE & CO.
RETAIL FINANCIAL SERVICES
FINANCIAL HIGHLIGHTS, CONTINUED
(in millions, except ratio data and where otherwise noted)
QUARTERLY TRENDS

YEAR-TO-DATE
2009 Change
2008

2Q09 Change
2Q09

1Q09

4Q08

3Q08

2Q08

1Q09

2Q08

2009

2008

CONSUMER LENDING
Noninterest revenue
Net interest income
Total net revenue
Provision for credit losses
Noninterest expense
Income (loss) before income tax expense
Net income (loss)

$

$

Overhead ratio
BUSINESS METRICS (in billions)
LOANS EXCLUDING PURCHASED CREDIT-IMPAIRED LOANS (a)
End-of-period loans owned:
Home equity
Prime mortgage
Subprime mortgage
Option ARMs
Student loans
Auto loans
Other
Total end-of-period loans
Average loans owned:
Home equity
Prime mortgage
Subprime mortgage
Option ARMs
Student loans
Auto loans
Other
Total average loans
PURCHASED CREDIT-IMPAIRED LOANS (a)
End-of-period loans owned:
Home equity
Prime mortgage
Subprime mortgage
Option ARMs
Total end-of-period loans
Average loans owned:
Home equity
Prime mortgage
Subprime mortgage
Option ARMs
Total average loans
TOTAL CONSUMER LENDING PORTFOLIO
End-of-period loans owned:
Home equity
Prime mortgage
Subprime mortgage
Option ARMs
Student loans
Auto loans
Other
Total end-of-period loans
Average loans owned:
Home equity
Prime mortgage
Subprime mortgage
Option ARMs
Student loans
Auto loans
Other
Total average loans owned (b)

1,137
2,311
3,448
3,485
1,522
(1,559)
(955)

$

$

44 %

1,879
2,624
4,503
3,552
1,591
(640)
(389)

$

$

35 %

2,140
2,023
4,163
3,308
1,513
(658)
(416)

$

$

36 %

643
1,475
2,118
1,986
1,199
(1,067)
(659)

$

$

57 %

898
1,479
2,377
1,523
1,123
(269)
(171)

(39) %
(12)
(23)
(2)
(4)
(144)
(146)

27 %
56
45
129
36
(480)
(458)

$

$

47 %

3,016
4,935
7,951
7,037
3,113
(2,199)
(1,344)

$

$

39 %

1,621
3,008
4,629
4,162
2,133
(1,666)
(1,027)

86 %
64
72
69
46
(32)
(31)

46 %

$

108.2
62.1
13.8
9.0
15.6
42.9
1.0
252.6

$

111.7
65.4
14.6
9.0
17.3
43.1
1.0
262.1

$

114.3
65.2
15.3
9.0
15.9
42.6
1.3
263.6

$

116.8
63.0
18.1
19.0
15.3
43.3
1.0
276.5

$

95.1
40.1
14.8
13.0
44.9
0.9
208.8

(3)
(5)
(5)
(10)
(4)

14
55
(7)
NM
20
(4)
11
21

$

108.2
62.1
13.8
9.0
15.6
42.9
1.0
252.6

$

95.1
40.1
14.8
13.0
44.9
0.9
208.8

14
55
(7)
NM
20
(4)
11
21

$

110.1
63.3
14.3
9.1
16.7
43.1
1.0
257.6

$

113.4
65.4
14.9
8.8
17.0
42.5
1.5
263.5

$

114.6
65.0
15.7
9.0
15.6
42.9
1.5
264.3

$

94.8
39.7
14.2
14.1
43.9
0.9
207.6

$

95.1
39.3
15.5
12.7
44.9
1.0
208.5

(3)
(3)
(4)
3
(2)
1
(33)
(2)

16
61
(8)
NM
31
(4)
24

$

111.7
64.4
14.6
9.0
16.8
42.8
1.3
260.6

$

95.0
37.7
15.6
12.4
44.1
1.1
205.9

18
71
(6)
NM
35
(3)
18
27

$

27.7
20.8
6.4
30.5
85.4

$

28.4
21.4
6.6
31.2
87.6

$

28.6
21.8
6.8
31.6
88.8

$

26.5
24.7
3.9
22.6
77.7

$

-

(2)
(3)
(3)
(2)
(3)

NM
NM
NM
NM
NM

$

27.7
20.8
6.4
30.5
85.4

$

-

NM
NM
NM
NM
NM

$

28.0
21.0
6.5
31.0
86.5

$

28.4
21.6
6.7
31.4
88.1

$

28.2
21.9
6.8
31.6
88.5

$

-

$

-

(1)
(3)
(3)
(1)
(2)

NM
NM
NM
NM
NM

$

28.2
21.3
6.6
31.2
87.3

$

-

NM
NM
NM
NM
NM

$

135.9
82.9
20.2
39.5
15.6
42.9
1.0
338.0

$

140.1
86.8
21.2
40.2
17.3
43.1
1.0
349.7

$

142.9
87.0
22.1
40.6
15.9
42.6
1.3
352.4

$

143.3
87.7
22.0
41.6
15.3
43.3
1.0
354.2

$

95.1
40.1
14.8
13.0
44.9
0.9
208.8

(3)
(4)
(5)
(2)
(10)
(3)

43
107
36
NM
20
(4)
11
62

$

135.9
82.9
20.2
39.5
15.6
42.9
1.0
338.0

$

95.1
40.1
14.8
13.0
44.9
0.9
208.8

43
107
36
NM
20
(4)
11
62

$

138.1
84.3
20.8
40.1
16.7
43.1
1.0
344.1

$

141.8
87.0
21.6
40.2
17.0
42.5
1.5
351.6

$

142.8
86.9
22.5
40.6
15.6
42.9
1.5
352.8

$

94.8
39.7
14.2
14.1
43.9
0.9
207.6

$

95.1
39.3
15.5
12.7
44.9
1.0
208.5

(3)
(3)
(4)
(2)
1
(33)
(2)

45
115
34
NM
31
(4)
65

$

139.9
85.7
21.2
40.2
16.8
42.8
1.3
347.9

$

95.0
37.7
15.6
12.4
44.1
1.1
205.9

47
127
36
NM
35
(3)
18
69

(a) Purchased credit-impaired loans accounted for under SOP 03-3 represent loans acquired in the Washington Mutual transaction for which a deterioration in credit quality occurred between the origination date and JPMorgan Chase's acquisition
date. Under SOP 03-3, these loans were initially recorded at fair value and accrete interest income over the estimated life of the loan when cash flows are reasonably estimable, even if the underlying loans are contractually past due.
(b) Total average loans include loans held-for-sale of $2.8 billion, $3.1 billion, $1.8 billion, $1.5 billion, and $3.6 billion for the quarters ended June 30, 2009, March 31, 2009, December 31, 2008, September 30, 2008, and June 30, 2008, respectively,
and $2.9 billion and $4.0 billion for year-to-date 2009 and 2008, respectively.
Page 14
JPMORGAN CHASE & CO.
RETAIL FINANCIAL SERVICES
FINANCIAL HIGHLIGHTS, CONTINUED
(in millions, except ratio data and where otherwise noted)
QUARTERLY TRENDS

YEAR-TO-DATE
2Q09 Change

2Q09

1Q09

4Q08

3Q08

2Q08

1Q09

2Q08

2009

2009 Change
2008

2008

CONSUMER LENDING (continued)
CREDIT DATA AND QUALITY STATISTICS
Net charge-offs excluding purchased credit-impaired loans: (a)
Home equity
Prime mortgage
Subprime mortgage
Option ARMs
Auto loans
Other
Total net charge-offs
Net charge-off rate excluding purchased credit-impaired loans: (a)
Home equity
Prime mortgage
Subprime mortgage
Option ARMs
Auto loans
Other
Total net charge-off rate excluding purchased credit-impaired loans (b)
Net charge-off rate - reported:
Home equity
Prime mortgage
Subprime mortgage
Option ARMs
Auto loans
Other
Total net charge-off rate - reported (b)
30+ day delinquency rate excluding purchased credit-impaired loans (c) (d) (e)
Nonperforming assets (f) (g)
Allowance for loan losses to ending loans
Allowance for loan losses to ending loans excluding purchased credit-impaired loans (a)

$

1,265
481
410
15
146
121
2,438

$

4.61 %
3.07
11.50
0.66
1.36
3.15
3.84
3.67
2.30
7.91
0.15
1.36
3.15
2.87
$

5.22
9,868
$
3.23 %
4.34

1,098
312
364
4
174
49
2,001

$

770
195
319
207
42
1,533

$

663
177
273
124
21
1,258

$

511
104
192
119
38
964

3.93 %
1.95
9.91
0.18
1.66
1.25
3.12

2.67 %
1.20
8.08
1.92
1.08
2.32

2.78 %
1.79
7.65
1.12
0.60
2.43

2.15
0.89
5.64
1.92
1.08
1.74

2.78
1.79
7.65
1.12
0.60
2.43

148 %
363
114
NM
23
218
153

$

2.16 %
1.08
4.98
1.07
1.44
1.89

3.14
1.46
6.83
0.04
1.66
1.25
2.33

15 %
54
13
275
(16)
147
22

2.16
1.08
4.98
1.07
1.44
1.89

4.73
9,267
$
2.83 %
3.79

4.21
8,653
$
2.36 %
3.16

3.16
7,705
$
1.95 %
2.50

3.88
4,996
2.33 %
2.33

2,363
793
774
19
320
170
4,439

$

4.27 %
2.50
10.69
0.43
1.51
2.18
3.47
3.41
1.88
7.36
0.10
1.51
2.18
2.59
6

98

$

5.22
9,868
$
3.23 %
4.34

958
154
341
237
50
1,740

147 %
415
127
NM
35
240
155

2.03 %
0.83
4.40
1.08
1.01
1.73
2.03
0.83
4.40
1.08
1.01
1.73
3.88
4,996
2.33 %
2.33

98

(a) Excludes the impact of purchased credit-impaired loans accounted for under SOP 03-3 that were acquired as part of the Washington Mutual transaction. These loans were accounted for at fair value on the acquisition date, which incorporated
management's estimate, as of that date, of credit losses over the remaining life of the portfolio. No allowance for loan losses and no charge-offs have been recorded for these loans as of June 30, 2009, March 31, 2009, December 31, 2008,
and September 30, 2008, respectively.
(b) Average loans held-for-sale of $2.8 billion, $3.1 billion, $1.8 billion, $1.5 billion, and $3.6 billion for the quarters ended June 30, 2009, March 31, 2009, December 31, 2008, September 30, 2008, and June 30, 2008, respectively, and $2.9 billion
and $4.0 billion for year-to-date 2009 and 2008, respectively, were excluded when calculating the net charge-off rate.
(c) Excluded loans eligible for repurchase, as well as loans repurchased from GNMA pools that are insured by U.S. government agencies, of $4.6 billion, $4.5 billion, $3.2 billion, $2.0 billion, and $1.5 billion at June 30, 2009, March 31, 2009,
December 31, 2008, September 30, 2008, and June 30, 2008, respectively. These amounts are excluded, as reimbursement is proceeding normally.
(d) Excluded loans that are 30 days past due and still accruing, which are insured by U.S. government agencies under the Federal Family Education Loan Program, of $854 million, $770 million, $824 million, $787 million, and $735 million at
June 30, 2009, March 31, 2009, December 31, 2008, September 30, 2008, and June 30, 2008, respectively. These amounts are excluded as reimbursement is proceeding normally.
(e) The delinquency rate for purchased credit-impaired loans accounted for under SOP 03-3 was 23.37%, 21.36%, 17.89%, and 13.21% at June 30, 2009, March 31, 2009, December 31, 2008, and September 30, 2008, respectively. There were
no purchased credit-impaired loans at June 30, 2008.
(f) Nonperforming assets excluded: (1) loans eligible for repurchase, as well as loans repurchased from Governmental National Mortgage Association ("GNMA") pools that are insured by U.S. government agencies, of $4.7 billion, $4.6 billion,
$3.3 billion, $1.8 billion, and $1.9 billion at June 30, 2009, March 31, 2009, December 31, 2008, September 30, 2008, and June 30, 2008, respectively; and (2) student loans that are 90 days past due and still accruing, which are insured by
U.S. government agencies under the Federal Family Education Loan Program, of $473 million, $433 million, $437 million, $405 million, and $394 million at June 30, 2009, March 31, 2009, December 31, 2008, September 30, 2008, and
June 30, 2008, respectively. These amounts for GNMA and student loans are excluded, as reimbursement is proceeding normally.
(g) Excludes purchased credit-impaired loans accounted for under SOP 03-3 that were acquired as part of the Washington Mutual transaction. These loans are accounted for on a pool basis and the pools are considered to be performing under
SOP 03-3.

Page 15
JPMORGAN CHASE & CO.
RETAIL FINANCIAL SERVICES
FINANCIAL HIGHLIGHTS, CONTINUED
(in billions, except where otherwise noted)
QUARTERLY TRENDS

YEAR-TO-DATE
2009 Change
2008

2Q09 Change
2Q09

1Q09

4Q08

3Q08

2Q08

1Q09

2Q08

2009

2008

CONSUMER LENDING (continued)
Origination volume:
Mortgage origination volume by channel
Retail
Wholesale
Correspondent
CNT (negotiated transactions)
Total mortgage origination volume
Home equity
Student loans
Auto loans

$

Average mortgage loans held-for-sale & loans at fair value (a)
Average assets
Third-party mortgage loans serviced (ending)
MSR net carrying value (ending)
SUPPLEMENTAL MORTGAGE FEES AND RELATED INCOME
DETAILS (in millions)
Production revenue
Net mortgage servicing revenue:
Loan servicing revenue
Changes in MSR asset fair value:
Due to inputs or assumptions in model
Other changes in fair value
Total changes in MSR asset fair value
Derivative valuation adjustments and other
Total net mortgage servicing revenue
Mortgage fees and related income

14.7
2.4
20.2
3.8
41.1
0.6
0.4
5.3

$

16.7
381.1
1,117.5
14.6

$

284

13.6
2.6
17.0
4.5
37.7
0.9
1.7
5.6

$

14.0
393.3
1,148.8
10.6

$

481

7.6
3.8
13.3
3.4
28.1
1.7
1.0
2.8

$

12.2
395.0
1,172.6
9.3

$

62

1,279

1,222

1,366

3,831
(837)
2,994

1,310
(1,073)
237

(6,950)
(843)
(7,793)

(3,750)
523
807

(307)
1,152
1,633

8,327
1,900
1,962

8.4
5.9
13.2
10.2
37.7
2.6
2.6
3.8

$

14.9
239.8
1,114.8
16.4

$

66
654
(786)
(390)
(1,176)
894
372
438

12.5
9.1
17.0
17.5
56.1
5.3
1.3
5.6

8 %
(8)
19
(16)
9
(33)
(76)
(5)

18 %
(74)
19
(78)
(27)
(89)
(69)
(5)

$

28.3
5.0
37.2
8.3
78.8
1.5
2.1
10.9

17.4
242.1
659.1
10.9

$

19
(3)
(3)
38

(4)
57
70
34

394

(41)

(28)

645

5

98

2,501

$

15.3
387.2
1,117.5
14.6

$

765

25.1
19.7
29.0
29.4
103.2
12.0
3.3
12.8

13 %
(75)
28
(72)
(24)
(88)
(36)
(15)

15.6
238.4
659.1
10.9

(2)
62
70
34

770

(1)

$

1,238

102

1,519
(394)
1,125

192
22
NM

152
(112)
166

5,141
(1,910)
3,231

887
(819)
68

480
(133)
NM

(1,468)
302
696

NM
(55)
(51)

(155)
73
16

(4,057)
1,675
2,440

(855)
451
1,221

(375)
271
100

(a) Loans at fair value consist of prime mortgages originated with the intent to sell that are accounted for at fair value and classified as trading assets on the Consolidated Balance Sheets. Average balances of these loans totaled $16.2 billion,
$13.4 billion, $12.0 billion, $14.5 billion, and $16.9 billion for the quarters ended June 30, 2009, March 31, 2009, December 31, 2008, September 30, 2008, and June 30, 2008, respectively, and $14.9 billion and $15.2 billion for year-to-date 2009
and 2008, respectively.

Page 16
JPMORGAN CHASE & CO.
CARD SERVICES - MANAGED BASIS
FINANCIAL HIGHLIGHTS
(in millions, except ratio data and where otherwise noted)
QUARTERLY TRENDS

YEAR-TO-DATE
2Q09 Change

2Q09
INCOME STATEMENT
REVENUE
Credit card income
All other income
Noninterest revenue
Net interest income
TOTAL NET REVENUE

$

1Q09

921
(364)
557
4,311
4,868

$

4Q08

844
(197)
647
4,482
5,129

$

3Q08

862
(272)
590
4,318
4,908

$

2Q08

633
13
646
3,241
3,887

$

1Q09

673
91
764
3,011
3,775

2Q08

9 %
(85)
(14)
(4)
(5)

2009

37 %
NM
(27)
43
29

$

2009 Change
2008

2008

1,765
(561)
1,204
8,793
9,997

$

1,273
210
1,483
6,196
7,679

39 %
NM
(19)
42
30

Provision for credit losses

4,603

4,653

3,966

2,229

2,194

(1)

110

9,256

3,864

140

NONINTEREST EXPENSE
Compensation expense
Noncompensation expense
Amortization of intangibles
TOTAL NONINTEREST EXPENSE

329
873
131
1,333

357
850
139
1,346

335
979
175
1,489

267
773
154
1,194

258
763
164
1,185

(8)
3
(6)
(1)

28
14
(20)
12

686
1,723
270
2,679

525
1,604
328
2,457

31
7
(18)
9

$

396
146
250

(23)
(23)
(23)

NM
NM
NM

$

(1,938)
(719)
(1,219)

$

1,358
499
859

NM
NM
NM

$

36

(49)

NM

$

(448)

$

106

NM

Income (loss) before income tax expense
Income tax expense (benefit)
NET INCOME (LOSS)
Memo: Net securitization income (loss)

$

(1,068)
(396)
(672)

$

(268)

FINANCIAL METRICS
ROE
Overhead ratio
% of average managed outstandings:
Net interest income
Provision for credit losses
Noninterest revenue
Risk adjusted margin (a)
Noninterest expense
Pretax income (loss) (ROO) (b)
Net income (loss)
BUSINESS METRICS
Charge volume (in billions)
Net accounts opened (in millions) (c)
Credit cards issued (in millions)
Number of registered internet customers (in millions)
Merchant acquiring business (d)
Bank card volume (in billions)
Total transactions (in billions)
(a)
(b)
(c)
(d)

$

(870)
(323)
(547)

$

(180)

(18) %
27

$

(547)
(176)
(371)

$

464
172
292

$

(261)

$

(28)

(15) %
26

9.93
10.60
1.28
0.61
3.07
(2.46)
(1.55)

(10) %
30

9.91
10.29
1.43
1.05
2.98
(1.92)
(1.21)

8 %
31

9.17
8.42
1.25
2.00
3.16
(1.16)
(0.79)

7 %
31

8.18
5.63
1.63
4.19
3.01
1.17
0.74

(16) %
27

7.92
5.77
2.01
4.16
3.12
1.04
0.66

12 %
32

9.92
10.44
1.36
0.84
3.02
(2.19)
(1.38)

8.13
5.07
1.95
5.01
3.23
1.78
1.13

$

82.8
2.4
151.9
30.5

$

76.0
2.2
159.0
33.8

$

96.0
4.3
168.7
35.6

$

93.9
16.6
171.9
34.3

$

93.6
3.6
157.6
28.0

9
9
(4)
(10)

(12)
(33)
(4)
9

$

158.8
4.6
151.9
30.5

$

179.0
7.0
157.6
28.0

(11)
(34)
(4)
9

$

101.4
4.5

$

94.4
4.1

$

135.1
4.9

$

197.1
5.7

$

199.3
5.6

7
10

(49)
(20)

$

195.8
8.6

$

381.7
10.8

(49)
(20)

Represents total net revenue less provision for credit losses.
Pretax return on average managed outstandings.
Third quarter of 2008 included approximately 13 million credit card accounts acquired by JPMorgan Chase in the Washington Mutual transaction.
The Chase Paymentech Solutions joint venture was dissolved effective November 1, 2008. JPMorgan Chase retained approximately 51% of the business and operates the business under the name Chase Paymentech Solutions. For
the period January 1, 2008, through October 31, 2008, the data presented represents activity for the Chase Paymentech Solutions joint venture and beyond that date, the data presented represents activity for Chase Paymentech Solutions.

Page 17
JPMORGAN CHASE & CO.
CARD SERVICES - MANAGED BASIS
FINANCIAL HIGHLIGHTS, CONTINUED
(in millions, except headcount and ratio data)
QUARTERLY TRENDS

YEAR-TO-DATE
2Q09 Change

2Q09

1Q09

4Q08

3Q08

2Q08

1Q09

2Q08

2009

SELECTED BALANCE SHEET DATA (Period-end)
Loans:
Loans on balance sheets
Securitized loans
Managed loans

$

85,736
85,790
171,526

$

$

92,881
93,664
186,545

$

$

104,746
85,571
190,317

$

$

90,911
85,220
176,131

$

$

$

76,278
79,120
155,398

(6) %
1
(3)

Equity

$

15,000

$

15,000

$

15,000

$

15,000

$

14,100

-

$

193,310

$

201,200

$

203,943

$

169,413

$

161,601

$

$

$

79,183
78,371
157,554

$

$

98,790
88,505
187,295

$

$

97,783
85,619
183,402

$

$

89,692
84,417
174,109

$

75,630
77,195
152,825

$

15,000

$

15,000

$

15,000

$

14,100

$

14,100
19,570

25

130

SELECTED BALANCE SHEET DATA (Average)
Managed assets
Loans:
Loans on balance sheets
Securitized loans
Managed average loans
Equity
Headcount
MANAGED CREDIT QUALITY STATISTICS
Net charge-offs
Net charge-off rate (a)

22,897

$

Managed delinquency rates
30+ day (a)
90+ day (a)
Allowance for loan losses (b)
Allowance for loan losses to period-end loans (b) (c)
KEY STATS - WASHINGTON MUTUAL ONLY (d)
Managed loans
Managed average loans
Net interest income (e)
Risk adjusted margin (e) (f)
Net charge-off rate (g)
30+ day delinquency rate (g)
90+ day delinquency rate (g)
KEY STATS - EXCLUDING WASHINGTON MUTUAL
Managed loans
Managed average loans
Net interest income (e)
Risk adjusted margin (e) (f)
Net charge-off rate
30+ day delinquency rate
90+ day delinquency rate

4,353
$
10.03 %

5.86 %
3.25

23,759

3,493
$
7.72 %

6.16 %
3.22

24,025

2,616
$
5.56 %

4.97 %
2.34

$

8,839
$
10.31 %

8,849
$
9.73 %

7,692
$
7.34 %

$

23,093
$
24,418
17.90 %
(3.89)
19.17
11.98
6.85

25,908
$
27,578
16.45 %
4.42
14.57
10.89
5.79

28,250
$
27,703
14.87 %
4.18
12.09
9.14
4.39

148,433
$
149,691
8.63 %
1.34
8.97
5.27
2.90

150,223
$
155,824
8.75 %
0.46
6.86
5.34
2.78

162,067
$
159,592
8.18 %
1.62
5.29
4.36
2.09

$

22,283

1,979
$
5.00 %

3.91 %
1.77
5,946
$
6.40 %

1,894
4.98 %

12 %
8
10

$

85,736
85,790
171,526

$

$

$

76,278
79,120
155,398

6

$

15,000

$

14,100

6

(4)

20

$

197,234

$

160,601

23

(8)
(1)
(5)

19
9
14

$

$

$

93,715
85,015
178,730

$

77,537
75,652
153,189

21
12
17

-

6

$

15,000

$

14,100

6

(4)

17

19,570

17

22,897

$

3.46 %
1.76
3,705
4.86 %

27,235

-

139

$

(11)
(11)

155,398
152,825
7.92 %
4.16
4.98
3.46
1.76

7,846
$
8.85 %

5.86 %
3.25

NM
NM

$

(1)
(4)

(4)
(2)

$

7.53 %
3.51

159,310
$
157,554
8.18 %
4.19
5.00
3.69
1.74

2009 Change
2008

2008

8,839
$
10.31 %

3,564
4.68 %

12 %
8
10

120

3.46 %
1.76
3,705
4.86 %

139

23,093
25,990
17.14 %
0.49
16.75
11.98
6.85

148,433
$
152,740
8.69 %
0.89
7.90
5.27
2.90

NM
NM

155,398
153,189
8.13 %
5.01
4.68
3.46
1.76

(4)
-

(a) Results for the quarters ended June 30, 2009, March 31, 2009, December 31, 2008, and September 30, 2008, reflect the impact of purchase accounting adjustments related to the
Washington Mutual transaction and the consolidation of the Washington Mutual Master Trust.
(b) Based on loans on balance sheets.
(c) Includes loans from the Washington Mutual Master Trust, which were consolidated onto the Card Services balance sheet at fair value during the second quarter of 2009. No allowance for loan losses was recorded for these
loans as of June 30, 2009. Excluding these loans, the allowance for loan losses to period-end loans was 10.95%.
(d) Statistics are only presented for periods after September 25, 2008, the date of the Washington Mutual transaction.
(e) As a percentage of average managed outstandings.
(f) Represents total net revenue less provision for credit losses.
(g) Excludes the impact of purchase accounting adjustments related to the Washington Mutual transaction and the consolidation of the Washington Mutual Master Trust.

Page 18
JPMORGAN CHASE & CO.
CARD RECONCILIATION OF REPORTED AND MANAGED DATA
(in millions)
QUARTERLY TRENDS

YEAR-TO-DATE
2Q09 Change

2Q09
INCOME STATEMENT DATA (a)
Credit card income
Reported
Securitization adjustments
Managed credit card income
Net interest income
Reported
Securitization adjustments
Managed net interest income
Total net revenue
Reported
Securitization adjustments
Managed total net revenue

$
$

$
$

$
$

Provision for credit losses
Reported
Securitization adjustments
Managed provision for credit losses

$

BALANCE SHEETS - AVERAGE BALANCES (a)
Total average assets
Reported
Securitization adjustments
Managed average assets

$

CREDIT QUALITY STATISTICS (a)
Net charge-offs
Reported
Securitization adjustments
Managed net charge-offs

$

$

$
$

1Q09

1,215
(294)
921

$

2,353
1,958
4,311

$

$

$

3,204
1,664
4,868

$

2,939
1,664
4,603

$
$

111,722
81,588
193,310

$

2,689
1,664
4,353

$

$

$
$

4Q08

1,384
(540)
844

$

2,478
2,004
4,482

$

$

$

3,665
1,464
5,129

$

3,189
1,464
4,653

$
$

118,418
82,782
201,200

$

2,029
1,464
3,493

$

$

$
$

3Q08

1,553
(691)
862

$

2,408
1,910
4,318

$

$

$

3,689
1,219
4,908

$

2,747
1,219
3,966

$
$

118,290
85,653
203,943

$

1,397
1,219
2,616

$

$

$
$

2Q08

1,476
(843)
633

$

1,525
1,716
3,241

$

$

$

3,014
873
3,887

$

1,356
873
2,229

$
$

93,701
75,712
169,413

$

1,106
873
1,979

$

$

$
$

1Q09

2Q08

2009

1,516
(843)
673

(12) %
46
9

1,338
1,673
3,011

(5)
(2)
(4)

76
17
43

2,945
830
3,775

(13)
14
(5)

9
100
29

1,364
830
2,194

(8)
14
(1)

115
100
110

$

87,021
74,580
161,601

(6)
(1)
(4)

28
9
20

$

33
14
25

153
100
130

1,064
830
1,894

(20) %
65
37

$
$

$
$

$
$

$

$

$
$

2008

2,599
(834)
1,765

$

4,831
3,962
8,793

$

6,869
3,128
9,997

3,053
(1,780)
1,273

$

66
20
42

6,168
1,511
7,679

11
107
30

2,353
1,511
3,864

160
107
140

87,517
73,084
160,601

31
12
23

2,053
1,511
3,564

130
107
120

$
$

$

115,052
82,182
197,234

$

4,718
3,128
7,846

$

$

(15) %
53
39

2,905
3,291
6,196

$

6,128
3,128
9,256

2009 Change
2008

$
$

(a) JPMorgan Chase uses the concept of “managed receivables” to evaluate the credit performance and overall performance of the underlying credit card loans, both sold and not sold; as the same borrower is continuing to use the credit
card for ongoing charges, a borrower’s credit performance will affect both the receivables sold under SFAS 140 and those not sold. Thus, in its disclosures regarding managed receivables, JPMorgan Chase treats the sold receivables as
if they were still on the balance sheet in order to disclose the credit performance (such as net charge-off rates) of the entire managed credit card portfolio. Managed results exclude the impact of credit card securitizations on total net revenue,
the provision for credit losses, net charge-offs and loan receivables. Securitization does not change reported net income versus managed earnings; however, it does affect the classification of items on the Consolidated Statements of Income
and Consolidated Balance Sheets.

Page 19
JPMORGAN CHASE & CO.
COMMERCIAL BANKING
FINANCIAL HIGHLIGHTS
(in millions, except ratio data)
QUARTERLY TRENDS

YEAR-TO-DATE
2Q09 Change

2Q09
INCOME STATEMENT
REVENUE
Lending & deposit-related fees
Asset management, administration and commissions
All other income (a)
Noninterest revenue
Net interest income
TOTAL NET REVENUE

$

1Q09

270
36
152
458
995
1,453

$

4Q08

263
34
125
422
980
1,402

$

3Q08

242
32
102
376
1,103
1,479

$

2Q08

212
29
147
388
737
1,125

$

1Q09

207
26
150
383
723
1,106

2Q08

3 %
6
22
9
2
4

2009

30 %
38
1
20
38
31

$

2009 Change
2008

2008

533
70
277
880
1,975
2,855

$

400
52
265
717
1,456
2,173

33 %
35
5
23
36
31

Provision for credit losses

312

293

190

126

47

6

NM

605

148

309

NONINTEREST EXPENSE
Compensation expense
Noncompensation expense
Amortization of intangibles
TOTAL NONINTEREST EXPENSE

197
327
11
535

200
342
11
553

164
324
11
499

177
298
11
486

173
290
13
476

(2)
(4)
(3)

14
13
(15)
12

397
669
22
1,088

351
584
26
961

13
15
(15)
13

Income before income tax expense
Income tax expense
NET INCOME

606
238
368

556
218
338

790
310
480

513
201
312

583
228
355

9
9
9

4
4
4

1,162
456
706

1,064
417
647

9
9
9

3
5
56
NM
4

82
8
25
NM
31

79
6
18
NM
31

59

3
(2)
26
(47)
4

MEMO:
Revenue by product:
Lending
Treasury services
Investment banking
Other
Total Commercial Banking revenue
IB revenue, gross (b)
Revenue by business:
Middle Market Banking
Commercial Term Lending (c)
Mid-Corporate Banking
Real Estate Banking (c)
Other (c)
Total Commercial Banking revenue
FINANCIAL RATIOS
ROE
Overhead ratio

$

$

$

684
679
114
(24)
1,453

$

$

$

$

$

665
646
73
18
1,402

328

$

772
224
305
120
32
1,453

$

18
37

$

$

$

%

$

611
759
88
21
1,479

206

$

752
228
242
120
60
1,402

$

17
39

$

$

$

%

$

377
643
87
18
1,125

$

376
630
91
9
1,106

241

$

252

$

270

796
243
243
131
66
1,479

$

729
236
91
69
1,125

$

708
235
94
69
1,106

24
34

$

$

$

%

18
43

$

$

%

20
43

%

$

$

$

$

1,349
1,325
187
(6)
2,855

$

755
1,246
159
13
2,173

21

$

534

$

473

9
NM
30
28
(54)
31

$

1,524
452
547
240
92
2,855

$

1,414
442
191
126
2,173

$

18
38

$

$

%

19
44

13

8
NM
24
26
(27)
31

%

(a) Revenue from investment banking products sold to Commercial Banking ("CB") clients and commercial card revenue is included in all other income.
(b) Represents the total revenue related to investment banking products sold to CB clients.
(c) Includes total net revenue on net assets acquired in the Washington Mutual transaction starting in the period ending December 31, 2008.

Page 20
JPMORGAN CHASE & CO.
COMMERCIAL BANKING
FINANCIAL HIGHLIGHTS, CONTINUED
(in millions, except ratio and headcount data)
QUARTERLY TRENDS

YEAR-TO-DATE
2009 Change
2008

2Q09 Change
2Q09
SELECTED BALANCE SHEET DATA (Period-end)
Loans:
Loans retained
Loans held-for-sale & loans at fair value
Total loans
Equity
SELECTED BALANCE SHEET DATA (Average)
Total assets
Loans:
Loans retained
Loans held-for-sale & loans at fair value
Total loans
Liability balances (a)
Equity
MEMO:
Loans by business:
Middle Market Banking
Commercial Term Lending (b)
Mid-Corporate Banking
Real Estate Banking (b)
Other (b)
Total Commercial Banking loans

Net charge-off rate (f)
Allowance for loan losses to period-end loans (d) (f)
Allowance for loan losses to average loans (d) (f)
Allowance for loan losses to nonperforming loans (c) (d)
Nonperforming loans to period-end loans (d)
Nonperforming loans to average loans (d)

4Q08

3Q08

2Q08

1Q09

105,556
296
105,852
8,000

$

71,105
306
71,411
7,000

103,469

(5)

33

$

140,771

$

102,724

37

70,682
379
71,061
99,404
7,000

(4)
(3)
(4)
(8)
-

54
(24)
53
6
14

69,096
450
69,546
99,441
7,000

61
(35)
60
11
14

42,879
15,357
7,500
5,325
71,061

(6)
(8)
(7)
(3)
(4)

(11)
NM
11
65
(15)
53

41,495
15,253
7,479
5,319
69,546

(5)
NM
16
71
(14)
60

4,028

(7)

5

4,028

5

130
486
510

142
334
342

1,843
170
2,013

65
60
64

110,923
272
111,195
8,000

$

115,130
295
115,425
8,000

$

117,316
313
117,629
8,000

$

71,105
306
71,411
7,000

$

137,283

$

144,298

$

149,815

$

101,681

$

$

$

38,193
36,963
17,012
12,347
4,523
109,038

$

$

4,228

$

40,728
36,814
18,416
13,264
4,643
113,865

$

$

4,545

181
2,111
2,255

$

3,034
272
3,306
0.67
2.87
2.79
145
1.99
1.94

117,351
329
117,680
114,113
8,000

134
1,531
1,651

0.48
2.65
2.59
192
1.38
1.34

$

$

5,206

$

2,945
240
3,185
%

71,901
397
72,298
99,410
7,000

42,613
37,039
18,169
13,529
6,330
117,680

118
1,026
1,142

0.40
2.45
2.41
275
0.89
0.87

$

$

5,298

$

2,826
206
3,032
%

43,155
16,491
7,513
5,139
72,298

40
844
923
2,698
191
2,889

%

0.22 %
2.30
2.32 (g)
320
0.72
0.72 (g)

2008

$

$

113,568
297
113,865
114,975
8,000

2009

48 %
(3)
48
14

105,556
296
105,852
8,000

108,750
288
109,038
105,829
8,000

2Q08

(5) %
9
(5)
-

$

Headcount
CREDIT DATA AND QUALITY STATISTICS
Net charge-offs
Nonperforming loans (c) (d)
Nonperforming assets
Allowance for credit losses:
Allowance for loan losses (e)
Allowance for lending-related commitments
Total allowance for credit losses

1Q09

$

49
486
510

35
38
37

269
334
342

1,843
170
2,013

3
13
4

65
60
64

0.28 %
2.59
2.61
401
0.68
0.68

111,146
292
111,438
110,377
8,000

$

$

39,453
36,889
17,710
12,803
4,583
111,438

$

$

4,228

$

315
2,111
2,255

$

3,034
272
3,306
0.57 %
2.87
2.73
145
1.99
1.89

48 %
(3)
48
14

0.38 %
2.59
2.67
401
0.68
0.70

(a) Liability balances include deposits and deposits swept to on-balance sheet liabilities such as commercial paper, federal funds purchased and securities loaned or sold under repurchase agreements.
(b) Includes loans acquired in the Washington Mutual transaction starting in the period ended December 31, 2008.
(c) Nonperforming loans included loans held-for-sale and loans at fair value of $21 million and $26 million at June 30, 2009 and 2008, respectively. These amounts were excluded when calculating the allowance for loan losses to nonperforming
loans ratio. There were no nonperforming loans held-for-sale or held at fair value at March 31, 2009, December 31, 2008, and September 30, 2008.
(d) Purchased credit-impaired wholesale loans accounted for under SOP 03-3 that were acquired in the Washington Mutual transaction are considered nonperforming loans because the timing and amount of expected cash flows are not reasonably
estimable. These nonperforming loans were included when calculating the allowance coverage ratios, the allowance for loan losses-to-nonperforming loans ratio, and the nonperforming loans-to-average and period-end loans ratios.
The carrying amount of these purchased credit-impaired loans at June 30, 2009, March 31, 2009, December 31, 2008, and September 30, 2008, was $209 million, $210 million, $224 million and $272 million, respectively.
(e) The allowance for loan losses at September 30, 2008, and June 30, 2008, included amounts related to loans acquired in the Washington Mutual transaction and the merger with Bear Stearns, respectively.
(f) Loans held-for-sale and loans accounted for at fair value were excluded when calculating the allowance coverage ratios and the net charge-off rate.
(g) Average loans in the calculation of this ratio were adjusted to include $44.5 billion of loans acquired from Washington Mutual as if the transaction occurred on July 1, 2008. Excluding this adjustment, the unadjusted allowance for loan
losses-to-average loans and nonperforming loans-to-average loans ratios would have been 3.75% and 1.17%, respectively.

Page 21
JPMORGAN CHASE & CO.
TREASURY & SECURITIES SERVICES
FINANCIAL HIGHLIGHTS
(in millions, except headcount and ratio data)
QUARTERLY TRENDS

YEAR-TO-DATE
2Q09 Change

2Q09
INCOME STATEMENT
REVENUE
Lending & deposit-related fees
Asset management, administration and commissions
All other income
Noninterest revenue
Net interest income
TOTAL NET REVENUE

$

Provision for credit losses
Credit reimbursement to IB (a)

1Q09

314
710
221
1,245
655
1,900

$

(5)
(30)

4Q08

325
626
197
1,148
673
1,821

$

(6)
(30)

3Q08

304
748
268
1,320
929
2,249

$

45
(30)

2Q08

290
719
221
1,230
723
1,953

$

18
(31)

1Q09

283
846
228
1,357
662
2,019
7
(30)

NONINTEREST EXPENSE
Compensation expense
Noncompensation expense
Amortization of intangibles
TOTAL NONINTEREST EXPENSE

618
650
20
1,288

629
671
19
1,319

628
692
19
1,339

664
661
14
1,339

669
632
16
1,317

Income before income tax expense
Income tax expense
NET INCOME

587
208
379

478
170
308

835
302
533

565
159
406

665
240
425

REVENUE BY BUSINESS
Treasury Services (b)
Worldwide Securities Services (b)
TOTAL NET REVENUE

$

$
$

FINANCIAL RATIOS
ROE
Overhead ratio
Pretax margin ratio (c)
SELECTED BALANCE SHEET DATA (Period-end)
Loans (d)
Equity
SELECTED BALANCE SHEET DATA (Average)
Total assets
Loans (d)
Liability balances (e)
Equity
Headcount

934
966
1,900

$

$
$

30 %
68
31

931
890
1,821

$

$
$

25 %
72
26

1,068
1,181
2,249

$

$
$

47 %
60
37

946
1,007
1,953

$

$
$

46 %
69
29

905
1,114
2,019

2Q08

2009

2009 Change
2008

2008

(3) %
13
12
8
(3)
4

11 %
(16)
(3)
(8)
(1)
(6)

17
-

NM
-

(2)
(3)
5
(2)

(8)
3
25
(2)

1,247
1,321
39
2,607

1,310
1,203
32
2,545

(5)
10
22
2

23
22
23

(12)
(13)
(11)

1,065
378
687

1,308
480
828

(19)
(21)
(17)

1,765
2,167
3,932

6
(14)
(5)

9
4

3
(13)
(6)

$

639
1,336
418
2,393
1,328
3,721

$

(11)
(60)

$

$
$

49 %
65
33

1,865
1,856
3,721

552
1,666
428
2,646
1,286
3,932

16 %
(20)
(2)
(10)
3
(5)

19
(60)

$

$
$

28 %
70
29

NM
-

48 %
65
33

$

17,929
5,000

$

18,529
5,000

$

24,508
4,500

$

40,675
4,500

$

26,348
3,500

(3)
-

(32)
43

$

17,929
5,000

$

26,348
3,500

(32)
43

$

35,520
17,524
234,163
5,000

$

38,682
20,140
276,486
5,000

$

55,515
31,283
336,277
4,500

$

49,386
26,650
259,992
3,500

$

56,192
23,822
268,293
3,500

(8)
(13)
(15)
-

(37)
(26)
(13)
43

$

37,092
18,825
255,208
5,000

$

56,698
23,454
261,331
3,500

(35)
(20)
(2)
43

27,232

1

27,232

-

27,252

26,998

27,070

27,592

-

27,252

(a) The Investment Bank credit portfolio group manages certain exposures on behalf of clients shared with TSS. TSS reimburses IB for a portion of the total cost of managing the credit portfolio. IB recognizes this credit
reimbursement as a component of noninterest revenue.
(b) Reflects an internal reorganization for escrow products, from Worldwide Securities Services to Treasury Services revenue of $46 million, $45 million, $75 million, $49 million, and $52 million, for the quarters ended June 30, 2009,
March 31, 2009, December 31, 2008, September 30, 2008, and June 30, 2008, respectively, and $91 million and $99 million for year-to-date 2009 and 2008, respectively.
(c) Pretax margin represents income before income tax expense divided by total net revenue, which is a measure of pretax performance and another basis by which management evaluates its performance and that of its competitors.
(d) Loan balances include wholesale overdrafts, commercial card and trade finance loans.
(e) Liability balances include deposits and deposits swept to on-balance sheet liabilities such as commercial paper, federal funds purchased and securities loaned or sold under repurchase agreements.

Page 22
JPMORGAN CHASE & CO.
TREASURY & SECURITIES SERVICES
FINANCIAL HIGHLIGHTS, CONTINUED
(in millions, except ratio data and where otherwise noted)
TSS firmwide metrics include revenue recorded in the CB, Retail Banking and Asset Management ("AM") lines of business and excludes FX revenue recorded in the IB for TSS-related FX activity. In order to capture the firmwide impact of Treasury
Services ("TS") and TSS products and revenue, management reviews firmwide metrics such as liability balances, revenue and overhead ratios in assessing financial performance for TSS. Firmwide metrics are necessary in order to understand
the aggregate TSS business.
QUARTERLY TRENDS

YEAR-TO-DATE
2Q09 Change

2Q09
TSS FIRMWIDE DISCLOSURES
Treasury Services revenue - reported (a)
Treasury Services revenue reported in Commercial Banking
Treasury Services revenue reported in other lines of business
Treasury Services firmwide revenue (a) (b)
Worldwide Securities Services revenue (a)
Treasury & Securities Services firmwide revenue (b)
Treasury Services firmwide liability balances (average) (c) (d)
Treasury & Securities Services firmwide liability balances (average) (c)

$

$
$

TSS FIRMWIDE FINANCIAL RATIOS
Treasury Services firmwide overhead ratio (e)
Treasury & Securities Services firmwide overhead ratio (e)
FIRMWIDE BUSINESS METRICS
Assets under custody (in billions)

Net charge-off (recovery) rate
Allowance for loan losses to period-end loans
Allowance for loan losses to average loans
Allowance for loan losses to nonperforming loans
Nonperforming loans to period-end loans
Nonperforming loans to average loans

934
679
63
1,676
966
2,642

$

258,312
339,992

$

51
59

$

Number of:
US$ ACH transactions originated (in millions)
Total US$ clearing volume (in thousands)
International electronic funds transfer volume (in thousands) (f)
Wholesale check volume (in millions)
Wholesale cards issued (in thousands) (g)
CREDIT DATA AND QUALITY STATISTICS
Net charge-offs (recoveries)
Nonperforming loans
Allowance for loan losses
Allowance for lending-related commitments

1Q09

$

%

13,748

$

$

289,645
391,461

$

$

%

13,532

$

%

$

1,068
759
82
1,909
1,181
3,090

$

312,559
450,390

$

$

%

13,205

$

%

$

946
643
76
1,665
1,007
2,672

$

248,075
359,401

$

$

%

14,417

$

%

$

905
630
72
1,607
1,114
2,721

2Q08
- %
5
2
2
9
4

252,625
367,670

(11)
(13)

2009
3 %
8
(13)
4
(13)
(3)
2
(8)

$

%

$

$
$

%

15,476

2

(11)

4
6
1
7

(2)
(3)
14
(7)
19

NM
(53)
(71)
19

NM
NM
(63)
179

(2)
40
33
(0.03) %
0.15
0.17
NM
-

$

1,865
1,325
125
3,315
1,856
5,171

$

273,892
365,584

$

$

%

13,748

$

6 %
6
(11)
5
(14)
(3)

247,897
360,758

10
1

%

$

%

15,476

(11)

1,997
57,119
81,471
1,241
19,917

19
14
15
92
0.20
0.08
0.08
107
0.08
0.07

1,765
1,246
141
3,152
2,167
5,319

53
58

1,956
55,379
91,461
1,140
23,744

$

2009 Change
2008

2008

52
61

993
29,063
41,432
618
19,917

47
45
0.12
0.18
NM
-

1Q09

53
58

997
29,277
41,831
595
21,858

30
74
63
0.30
0.24
247
0.12
0.10

2Q08

52
60

1,006
29,346
47,734
572
22,784

2
30
51
77
0.04
0.28
0.25
170
0.16
0.15

3Q08

44
52

978
27,186
44,365
568
22,233

17
14
15
92
0.39
0.08
0.09
107
0.08
0.08

931
646
62
1,639
890
2,529

53
63

978
28,193
47,096
572
23,744

$

4Q08

(2)
(3)
12
(8)
19

(2)
40
33

NM
NM
(63)
179

(0.02) %
0.15
0.17
NM
-

(a) Reflects an internal reorganization for escrow products, from Worldwide Securities Services to Treasury Services revenue, of $46 million, $45 million, $75 million, $49 million, and $52 million, for the quarters ended June 30, 2009, March 31, 2009,
December 31, 2008, September 30, 2008, and June 30, 2008, respectively, and $91 million and $99 million for year-to-date 2009 and 2008, respectively.
(b) TSS firmwide FX revenue includes FX revenue recorded in TSS and FX revenue associated with TSS customers who are FX customers of IB. FX revenue associated with TSS customers who are FX customers of IB was $191 million, $154 million,
$271 million, $196 million, and $222 million, for the quarters ended June 30, 2009, March 31, 2009, December 31, 2008, September 30, 2008, and June 30, 2008, respectively, and $345 million and $413 million for year-to-date 2009 and 2008, respectively.
These amounts are not included in TS and TSS firmwide revenue.
(c) Firmwide liability balances include liability balances recorded in Commercial Banking.
(d) Reflects an internal reorganization for escrow products, from Worldwide Securities Services to Treasury Services liability balances, of $14.9 billion, $18.2 billion, $22.3 billion, $20.3 billion, and $21.9 billion for the quarters ended
June 30, 2009, March 31, 2009, December 31, 2008, September 30, 2008, and June 30, 2008, respectively, and $16.5 billion and $21.7 billion for year-to-date 2009 and 2008, respectively.
(e) Overhead ratios have been calculated based upon firmwide revenue and TSS and TS expense, respectively, including those allocated to certain other lines of business. FX revenue and expense recorded in IB for TSS-related FX activity are
not included in this ratio.
(f) International electronic funds transfer includes non-US dollar ACH and clearing volume.
(g) Wholesale cards issued include domestic commercial card, stored value card, prepaid card and government electronic benefit card products.

Page 23
JPMORGAN CHASE & CO.
ASSET MANAGEMENT
FINANCIAL HIGHLIGHTS
(in millions, except ratio, ranking and headcount data)
QUARTERLY TRENDS

YEAR-TO-DATE
2Q09 Change

2Q09
INCOME STATEMENT
REVENUE
Asset management, administration and commissions
All other income
Noninterest revenue
Net interest income
TOTAL NET REVENUE

$

Provision for credit losses

REVENUE BY CLIENT SEGMENT
Private Bank (a)
Institutional
Retail
Private Wealth Management (a)
Bear Stearns Private Client Services
Total net revenue

1,315
253
1,568
414
1,982

$

4Q08

1,231
69
1,300
403
1,703

$

3Q08

1,362
(170)
1,192
466
1,658

$

2Q08

1,538
43
1,581
380
1,961

$

1Q09

1,573
130
1,703
361
2,064

59

$
$

$

FINANCIAL RATIOS
ROE
Overhead ratio
Pretax margin ratio (b)

33

32

20

17

810
525
19
1,354

NONINTEREST EXPENSE
Compensation expense
Noncompensation expense
Amortization of intangibles
TOTAL NONINTEREST EXPENSE
Income before income tax expense
Income tax expense
NET INCOME

1Q09

800
479
19
1,298

689
504
20
1,213

816
525
21
1,362

886
494
20
1,400

569
217
352
640
487
411
334
110
1,982

$
$

$

20 %
68
29

BUSINESS METRICS
Number of:
Client advisors (c)
Retirement planning services participants
Bear Stearns brokers

372
148
224
583
460
253
312
95
1,703

$
$

$

13 %
76
22

1,785
1,595,000
362

413
158
255
630
327
265
330
106
1,658

$
$

$

14 %
73
25

1,833
1,628,000
359

579
228
351
631
486
399
352
93
1,961

$
$

$

25 %
69
30

1,795
1,531,000
324

2Q08

7 %
267
21
3
16
79

2009

(16) %
95
(8)
15
(4)

$

247

1
10
4
53
47
57

(12)
(14)
(11)

708
472
490
356
38
2,064

10
6
62
7
16
16

(10)
3
(16)
(6)
189
(4)

1,801
1,505,000
326

$

(18) %
70
(13)
22
(7)

$
$

$

33
1,711
971
41
2,723

(6)
3
(7)
(3)

1,209
458
751

(22)
(20)
(23)

1,304
962
956
705
38
3,965

(6)
(2)
(31)
(8)
439
(7)

941
365
576
1,223
947
664
646
205
3,685

$
$

$

17 %
72
26

(3)
(2)
1

3,104
189
3,293
672
3,965

1,610
1,004
38
2,652

31 %
68
31

1,769
1,492,000
323

2,546
322
2,868
817
3,685
92

(9)
6
(5)
(3)

647
252
395

2009 Change
2008

2008

(1)
6
11

179

30 %
69
30

1,785
1,595,000
362

1,801
1,505,000
326

(1)
6
11

% of customer assets in 4 & 5 Star Funds (d)

45 %

42 %

42 %

39 %

40 %

7

13

45 %

40 %

13

% of AUM in 1st and 2nd quartiles: (e)
1 year
3 years
5 years

62 %
69 %
80 %

54 %
62 %
66 %

54 %
65 %
76 %

49 %
67 %
77 %

51 %
70 %
76 %

15
11
21

22
(1)
5

62 %
69 %
80 %

51 %
70 %
76 %

22
(1)
5

SELECTED BALANCE SHEET DATA (Period-end)
Loans
Equity
SELECTED BALANCE SHEET DATA (Average)
Total assets
Loans
Deposits
Equity

$

35,474
7,000

$

33,944
7,000

$

36,188
7,000

$

39,720
7,000

$

41,536
5,200

5
-

(15)
35

$

35,474
7,000

$

41,536
5,200

(15)
35

$

59,334
34,292
75,355
7,000

$

58,227
34,585
81,749
7,000

$

65,648
36,851
76,911
7,000

$

71,189
39,750
65,621
5,500

$

65,015
39,264
69,975
5,066

2
(1)
(8)
-

(9)
(13)
8
38

$

58,783
34,438
78,534
7,000

$

62,651
37,946
69,079
5,033

(6)
(9)
14
39

15,840

(2)

(6)

15,840

(6)

2
68
147
5

142
4
5
-

NM
360
54
(20)

68
147
5

NM
360
54
(20)

Headcount
CREDIT DATA AND QUALITY STATISTICS
Net charge-offs (recoveries)
Nonperforming loans
Allowance for loan losses
Allowance for lending-related commitments
Net charge-off (recovery) rate
Allowance for loan losses to period-end loans
Allowance for loan losses to average loans
Allowance for loan losses to nonperforming loans
Nonperforming loans to period-end loans
Nonperforming loans to average loans
(a)
(b)
(c)
(d)
(e)

14,840
$

46
313
226
4
0.54 %
0.64
0.66
72
0.88
0.91

15,109
$

19
301
215
4
0.22 %
0.63
0.62
71
0.89
0.87

15,339
$

12
147
191
5
0.13 %
0.53
0.52
130
0.41
0.40

15,493
$

(1)
121
170
5
(0.01) %
0.43
0.43
140
0.30
0.30

$

0.02 %
0.35
0.37
216
0.16
0.17

14,840
$

65
313
226
4
0.38 %
0.64
0.66
72
0.88
0.91

$

%
0.35
0.39
216
0.16
0.18

In the third quarter of 2008, certain clients were transferred from Private Bank to Private Wealth Management. Prior periods have been revised to conform with this change.
Pretax margin represents income before income tax expense divided by total net revenue, which is a measure of pretax performance and another basis by which management evaluates its performance and that of its competitors.
Prior periods revised to conform with current methodology.
Derived from the following rating services: Morningstar for the United States; Micropal for the United Kingdom, Luxembourg, Hong Kong and Taiwan; and Nomura for Japan.
Derived from the following rating services: Lipper for the United States and Taiwan; Micropal for the United Kingdom, Luxembourg and Hong Kong; and Nomura for Japan.

Page 24
JPMORGAN CHASE & CO.
ASSET MANAGEMENT
FINANCIAL HIGHLIGHTS, CONTINUED
(in billions)

Jun 30
2009
Assets by asset class
Liquidity
Fixed income
Equities & balanced
Alternatives
TOTAL ASSETS UNDER MANAGEMENT
Custody / brokerage / administration / deposits
TOTAL ASSETS UNDER SUPERVISION

Assets by client segment
Institutional
Private Bank (a)
Retail
Private Wealth Management (a)
Bear Stearns Private Client Services
TOTAL ASSETS UNDER MANAGEMENT
Institutional
Private Bank (a)
Retail
Private Wealth Management (a)
Bear Stearns Private Client Services
TOTAL ASSETS UNDER SUPERVISION

Assets by geographic region
U.S. / Canada
International
TOTAL ASSETS UNDER MANAGEMENT
U.S. / Canada
International
TOTAL ASSETS UNDER SUPERVISION

Mutual fund assets by asset class
Liquidity
Fixed income
Equities
Alternatives
TOTAL MUTUAL FUND ASSETS

$

$

$

$
$

$

$
$
$
$

$

$

617
194
264
96
1,171
372
1,543

Mar 31
2009
$

$

697
179
216
67
12
1,171

$

697
390
289
123
44
1,543

$

814
357
1,171

$

1,103
440
1,543

$

569
48
111
9
737

$

$

$

$

$

$

625
180
215
95
1,115
349
1,464

Dec 31
2008
$

$

668
181
184
68
14
1,115

$

669
375
250
120
50
1,464

$

789
326
1,115

$

1,066
398
1,464

$

570
42
85
8
705

$

$

$

$

$

$

613
180
240
100
1,133
363
1,496

681
181
194
71
6
1,133

Sep 30
2008
$

$

$

$

682
378
262
124
50
1,496

$

798
335
1,133

$

1,084
412
1,496

$

553
41
92
7
693

$

$

$

$

$

524
189
308
132
1,153
409
1,562

653
194
223
75
8
1,153

Jun 30
2008
$

$

$

$

653
417
303
134
55
1,562

$

785
368
1,153

$

1,100
462
1,562

$

470
44
127
7
648

$

$

$

$

$

478
199
378
130
1,185
426
1,611

Jun 30, 2009
Change
Mar 31
Jun 30
2009
2008
(1) %
8
23
1
5
7
5

29 %
(2)
(30)
(26)
(1)
(13)
(4)

645
181
276
75
8
1,185

4
(1)
17
(1)
(14)
5

8
(1)
(22)
(11)
50
(1)

646
415
357
133
60
1,611

4
4
16
2
(12)
5

8
(6)
(19)
(8)
(27)
(4)

771
414
1,185

3
10
5

6
(14)
(1)

1,093
518
1,611

3
11
5

1
(15)
(4)

14
31
13
5

37
2
(35)
13
15

416
47
171
8
642

(a) In the third quarter of 2008, certain clients were transferred from Private Bank to Private Wealth Management. Prior periods have been revised to conform with this change.

Page 25
JPMORGAN CHASE & CO.
ASSET MANAGEMENT
FINANCIAL HIGHLIGHTS, CONTINUED
(in billions)
QUARTERLY TRENDS
2Q09
ASSETS UNDER SUPERVISION (continued)
Assets under management rollforward
Beginning balance
Net asset flows:
Liquidity
Fixed income
Equities, balanced & alternative
Market / performance / other impacts (a)
TOTAL ASSETS UNDER MANAGEMENT
Assets under supervision rollforward
Beginning balance
Net asset flows
Market / performance / other impacts (a)
TOTAL ASSETS UNDER SUPERVISION

$

1,115

$

(7)
8
2
53
1,171

$

$

1,464
(9)
88
1,543

1Q09

$

1,133

$

19
1
(5)
(33)
1,115

$

$

1,496
25
(57)
1,464

YEAR-TO-DATE

4Q08

$

1,153

$

86
(7)
(18)
(81)
1,133

$

$

1,562
73
(139)
1,496

3Q08

$

1,185

$

55
(4)
(5)
(78)
1,153

$

$

1,611
61
(110)
1,562

2Q08

$

1,187

$

1
(1)
(3)
1
1,185

$

$

1,569
(5)
47
1,611

2009

$

1,133

$

12
9
(3)
20
1,171

$

$

1,496
16
31
1,543

2008

$

1,193

$

69
(1)
(24)
(52)
1,185

$

$

1,572
47
(8)
1,611

(a) Second quarter 2008 reflects $15 billion for assets under management and $68 billion for assets under supervision from the Bear Stearns merger on May 30, 2008.

Page 26
JPMORGAN CHASE & CO.
CORPORATE/PRIVATE EQUITY
FINANCIAL HIGHLIGHTS
(in millions, except headcount data)
QUARTERLY TRENDS

YEAR-TO-DATE
2Q09 Change

2Q09
INCOME STATEMENT
REVENUE
Principal transactions
Securities gains
All other income (a)
Noninterest revenue
Net interest income (expense)
TOTAL NET REVENUE

$

Provision for credit losses (b)

MEMO:
TOTAL NET REVENUE
Private equity
Corporate
TOTAL NET REVENUE
NET INCOME (LOSS)
Private equity
Corporate
Merger-related items (e)
TOTAL NET INCOME (LOSS)
Headcount

1,243
366
(209)
1,400
865
2,265

$

9

NONINTEREST EXPENSE
Compensation expense
Noncompensation expense (c)
Merger costs
Subtotal
Net expense allocated to other businesses
TOTAL NONINTEREST EXPENSE
Income (loss) before income tax expense and extraordinary gain
Income tax expense (benefit)
Income (loss) before extraordinary gain
Extraordinary gain (d)
NET INCOME (LOSS)

1Q09

$

$
$
$

$

$

$

$

(27)
993
(158)
808

$

$

$

(221)
41
(262)
(262)

(1,620)
499
685
(436)
868
432

$

(1,876)
440
(275)
(1,711)
(125)
(1,836)

2Q08

$

1,977

1Q09

(97)
656
(378)
181
(47)
134
37

2Q08

2009

NM %
71
NM
NM
(13)
NM

NM %
(44)
45
NM
NM
NM

NM

(76)

438
673
181
1,292
(1,364)
(72)

$

(449)
140
(309)

$

(280)
252
(234)
(262)

$

22,339

3Q08

(33)

641
345
205
1,191
(1,279)
(88)

(1)
2,266
2,265

21,522

(1,493)
214
(19)
(1,298)
989
(309)
-

655
1,319
143
2,117
(1,253)
864
1,392
584
808
808

4Q08

$

$

652
563
96
1,311
(1,150)
161

611
689
155
1,455
(1,070)
385

2
282
(30)
78
2
NM

537
317
220
1,325
1,545

(3,974)
(1,613)
(2,361)
581
(1,780)

(288)
31
(319)
(319)

NM
NM
NM
NM

7
91
(8)
45
(17)
124
NM
NM
NM
NM

197
(63)
134

100
NM
NM

NM
NM
NM

99
122
(540)
(319)

90
294
32
NM

NM
NM
71
NM

(4)

(4)

$

(1,107)
1,539
432

$

(682)
1,163
1,064
1,545

$

23,376

$

$

$

(216)
(1,620)
(1,836)

$

(164)
(881)
(735)
(1,780)

$

24,967

$

$

22,317

$

2009 Change
2008

2008

(250)
580
(228)
102
1,854
1,956

$

9

(92)
698
1,263
1,869
(396)
1,473

(172) %
(17)
NM
(95)
NM
33

37

(76)

1,296
1,664
348
3,308
(2,532)
776

$

$
$
$

$

1,250
605
155
2,010
(2,127)
(117)

4
175
125
65
(19)
NM

1,171
625
546
546

1,553
761
792
792

(25)
(18)
(31)
(31)

360
1,113
1,473

NM
116
33

156
1,176
(540)
792

NM
6
27
(31)

(450)
2,406
1,956
(307)
1,245
(392)
546
21,522

$

$
$
$

$

22,317

(4)

(a) Included the following significant items: a gain of $1.0 billion from the dissolution of the Chase Paymentech Solutions joint venture in the fourth quarter of 2008, a charge of $375 million for the repurchase of auction rate securities in the third
quarter of 2008, $423 million representing the Firm's share of Bear Stearns' losses from April 8 to May 30, 2008, in the second quarter of 2008, and proceeds of $1.5 billion from the sale of Visa shares in its initial public offering in the first
quarter of 2008.
(b) The fourth and third quarters of 2008 included accounting conformity loan loss reserve provisions related to the acquisition of Washington Mutual Bank's banking operations. An analysis of loans acquired in the transaction was substantially
completed during the fourth quarter. This resulted in an increase in the credit-impaired loan balances, a corresponding reduction in the non-credit-impaired portfolio and a reduction in the estimate of incurred losses related to the
non-credit-impaired portfolio requiring a reduction in the accounting conformity provision for these loans. Also, the fourth quarter of 2008 includes a provision for credit losses related to the transfer of higher quality credit card
loans from the legacy Chase portfolio to a securitization trust previously established by Washington Mutual.
(c) Second quarter 2009 includes a $675 million FDIC special assessment.
(d) JPMorgan Chase acquired the banking operations of Washington Mutual Bank for $1.9 billion. The fair value of the net assets acquired exceeded the purchase price, which resulted in negative goodwill. In accordance with SFAS 141,
nonfinancial assets that are not held-for-sale were written down against that negative goodwill. The negative goodwill that remained after writing down nonfinancial assets was recognized as an extraordinary gain.
(e) Included accounting conformity loan loss reserve provisions, extraordinary gains and merger costs related to the Washington Mutual transaction, as well as items related to the Bear Stearns merger, including Bear Stearns' losses,
merger costs, Bear Stearns asset management liquidation costs and Bear Stearns Private Client Services broker retention expense.

Page 27
JPMORGAN CHASE & CO.
CORPORATE/PRIVATE EQUITY
FINANCIAL HIGHLIGHTS, CONTINUED
(in millions, except ratio data)
QUARTERLY TRENDS

YEAR-TO-DATE
2Q09 Change

2Q09

1Q09

4Q08

3Q08

2Q08

1Q09

2Q08

2009

2008

2009 Change
2008

SUPPLEMENTAL
TREASURY
Securities gains (a) (b)
Investment securities portfolio (average) (b)
Investment securities portfolio (ending) (b)
Mortgage loans (average)
Mortgage loans (ending)
PRIVATE EQUITY
Private equity gains (losses)
Direct investments
Realized gains
Unrealized gains (losses) (c)
Total direct investments
Third-party fund investments
Total private equity gains (losses) (d)
Private equity portfolio information
Direct investments
Publicly-held securities
Carrying value
Cost
Quoted public value
Privately-held direct securities
Carrying value
Cost
Third-party fund investments (e)
Carrying value
Cost

$

$

$

$

374
336,263
326,414
7,228
7,368

25
16
41
(61)
(20)

431
778
477

$

$

$

$

214
265,785
316,498
7,210
7,162

15
(409)
(394)
(68)
(462)

305
778
346

$

$

$

$

512
159,209
192,564
7,277
7,292

24
(1,000)
(976)
(121)
(1,097)

483
792
543

$

$

$

$

442
108,728
119,085
7,221
7,297

40
(273)
(233)
27
(206)

600
705
657

$

$

$

$

656
100,481
106,604
7,004
7,150

75 %
27
3
3

(43) %
235
206
3
3

$

540
(326)
214
6
220

67
NM
NM
10
96

(95)
NM
(81)
NM
NM

$

615
665
732

41
38

(30)
17
(35)

4,709
5,627

4,708
5,519

5,564
6,296

6,038
6,058

6,270
6,113

2

1,537
2,082

805
1,169

889
1,121

838
1,094

(8)
(1)

40
(393)
(353)
(129)
(482)

$

$

$

698
91,821
106,604
6,867
7,150

1,653
(1,207)
446
(37)
409

(16) %
228
206
5
3

(98)
67
NM
(249)
NM

(25)
(8)

1,420
2,055

$

588
301,219
326,414
7,219
7,368

69
88

Total private equity portfolio - Carrying value

$

6,560

$

6,550

$

6,852

$

7,527

$

7,723

Total private equity portfolio - Cost

$

8,460

$

8,379

$

8,257

$

7,884

$

7,872

1

(15)
7

(a) Included a $668 million gain on the sale of MasterCard shares in the second quarter of 2008. All periods reflect repositioning of the Corporate investment securities portfolio, and exclude gains/losses on securities used to manage risk
associated with MSRs.
(b) Beginning in second quarter 2009, balances reflect Treasury and Chief Investment Office securities. Prior periods have been revised to conform with this change.
(c) Unrealized gains (losses) contain reversals of unrealized gains and losses that were recognized in prior periods and have now been realized.
(d) Included in principal transactions revenue in the Consolidated Statements of Income.
(e) Unfunded commitments to third-party private equity funds were $1.5 billion, $1.5 billion, $1.4 billion, $931 million, and $861 million at June 30, 2009, March 31, 2009, December 31, 2008, September 30, 2008, and June 30, 2008, respectively.

Page 28
JPMORGAN CHASE & CO.
CREDIT-RELATED INFORMATION
(in millions)
Jun 30, 2009
Change
Jun 30
2009
CREDIT EXPOSURE
WHOLESALE (a)
Loans - U.S.
Loans - Non-U.S.
TOTAL WHOLESALE LOANS - REPORTED (b)

$

CONSUMER (c)
Home loan portfolio - excluding purchased credit-impaired loans:
Home equity
Prime mortgage
Subprime mortgage
Option ARMs
Total home loan portfolio - excluding purchased credit-impaired loans
Home loan portfolio - purchased credit-impaired loans: (d)
Home equity
Prime mortgage
Subprime mortgage
Option ARMs
Total home loan portfolio - purchased credit-impaired loans
Other consumer:
Auto
Credit card - reported:
Credit card - reported excluding loans consolidated from the Washington Mutual Master Trust
Credit card - reported loans consolidated from the Washington Mutual Master Trust (e)
Total credit card - reported
Other loans
Loans held-for-sale (f)
TOTAL CONSUMER LOANS - REPORTED
TOTAL LOANS - REPORTED
Credit card - securitized
TOTAL LOANS - MANAGED
Derivative receivables
Receivables from customers (g)
Interests in purchased receivables
TOTAL CREDIT-RELATED ASSETS
Wholesale lending-related commitments
TOTAL
Memo: Total by category
Total wholesale exposure (h)
Total consumer managed loans (i)
Total

172,204
59,421
231,625

Mar 31
2009

$

176,282
66,002
242,284

Dec 31
2008

$

186,776
75,268
262,044

Sep 30
2008

$

202,170
86,275
288,445

Jun 30
2008

$

Mar 31
2009

137,236
92,123
229,359

108,229
68,878
13,825
9,034
199,966

116,804
70,243
18,162
18,989
224,198

28,366
21,398
6,565
31,243
87,572

28,555
21,855
6,760
31,643
88,813

26,507
24,672
3,863
22,653
77,695

-

42,887

43,065

42,603

43,306

80,722
5,014
85,736
33,041
1,940
448,976

$

114,335
72,266
15,330
9,018
210,949

27,729
20,807
6,341
30,529
85,406

$

111,781
71,731
14,594
8,940
207,046

90,911
90,911
33,700
3,665
465,959

104,746
104,746
33,715
2,028
482,854

92,881
92,881
33,252
1,604
472,936

680,601
85,790
766,391
97,491
12,977
2,972
879,831
343,991
1,223,822

708,243
85,220
793,463
131,247
14,504
939,214
363,013
1,302,227

744,898
85,571
830,469
162,626
16,141
1,009,236
379,871
1,389,107

761,381
93,664
855,045
118,648
25,422
999,115
407,823
1,406,938

$

$

$

95,129
46,221
14,792
156,142

Jun 30
2008

(2) %
(10)
(4)

25 %
(35)
1

14
49
(7)
NM
28

(2)
(3)
(3)
(2)
(2)

NM
NM
NM
NM
NM

44,867

-

(4)

76,278
76,278
29,187
2,196
308,670

$

(3)
(4)
(5)
1
(3)

(11)
NM
(6)
(2)
(47)
(4)

6
NM
12
13
(12)
45

538,029
79,120
617,149
122,389
26,572
766,110
430,028
1,196,138

(4)
1
(3)
(26)
(11)
NM
(6)
(5)
(6)

26
8
24
(20)
(51)
NM
15
(20)
2

689,056
534,766
1,223,822

$

$

840,338
566,600
1,406,938

$

$

820,682
568,425
1,389,107

$

$

751,048
551,179
1,302,227

$

$

$

808,348
387,790
1,196,138

(8)
(3)
(6)

(15)
38
2

$

491,168

$

546,968

$

605,210

$

620,524

$

595,043

(10)

(17)

Risk profile of wholesale credit exposure:
Investment-grade (j)
Noninvestment-grade: (j)
Noncriticized
Criticized performing
Criticized nonperforming
Total noninvestment-grade

141,408
26,453
6,533
174,394

147,891
25,320
4,615
177,826

159,379
22,568
3,429
185,376

161,503
14,491
1,418
177,412

154,218
11,611
899
166,728

(4)
4
42
(2)

(8)
128
NM
5

Loans held-for-sale & loans at fair value
Receivables from customers (g)
Interests in purchased receivables
Total wholesale exposure

7,545
12,977
2,972
689,056

11,750
14,504
751,048

13,955
16,141
820,682

16,980
25,422
840,338

20,005
26,572
808,348

(36)
(11)
NM
(8)

(62)
(51)
NM
(15)

$

$

$

$

$

(a)
(b)
(c)
(d)

Includes Investment Bank, Commercial Banking, Treasury & Securities Services and Asset Management.
Includes loans held-for-sale and loans at fair value.
Includes Retail Financial Services, Card Services and residential mortgage loans reported in the Corporate/Private Equity segment to be risk managed by the Chief Investment Office.
Purchased credit-impaired loans accounted for under SOP 03-3 represent loans acquired in the Washington Mutual transaction for which a deterioration in credit quality occurred between the origination date and JPMorgan
Chase's acquisition date. Under SOP 03-3, these loans were initially recorded at fair value and accrete interest income over the estimated life of the loan when cash flows are reasonably estimable even if the underlying loans
are contractually past due. As of September 30, 2008, an analysis of the acquired portfolio was conducted in order to preliminarily identify loans meeting the SOP 03-3 impairment criteria. This analysis was completed during
the fourth quarter of 2008, resulting in the reclassification of $12.4 billion of acquired loans from the non-credit-impaired loan balances into the credit-impaired loan balances.
(e) Represents loans from the Washington Mutual Master Trust, which were consolidated onto the Firm's balance sheet at fair value during the second quarter of 2009. No allowance for loan losses was recorded for these loans as of June 30, 2009.
(f) Included loans for prime mortgage of $589 million, $825 million, $206 million, $132 million, and $964 million at June 30, 2009, March 31, 2009, December 31, 2008, September 30, 2008, and June 30, 2008, respectively, and
other (largely student loans) of $1.4 billion, $2.8 billion, $1.8 billion, $1.5 billion, and $1.2 billion at June 30, 2009, March 31, 2009, December 31, 2008, September 30, 2008, and June 30, 2008, respectively.
(g) Represents margin loans to prime and retail brokerage customers, which are included in accrued interest and accounts receivable on the Consolidated Balance Sheets.
(h) Primarily represents total wholesale loans, derivative receivables, wholesale lending-related commitments and receivables from customers.
(i) Represents total consumer loans plus credit card securitizations, and excludes consumer lending-related commitments.
(j) Excludes loans held-for-sale and loans at fair value.
Note: The risk profile is based on JPMorgan Chase's internal risk ratings, which generally correspond to the following ratings as defined by Standard & Poor's / Moody's:
Investment-Grade: AAA / Aaa to BBB- / Baa3
Noninvestment-Grade: BB+ / Ba1 and below

Page 29
JPMORGAN CHASE & CO.
CREDIT-RELATED INFORMATION, CONTINUED
(in millions, except ratio data)

Jun 30
2009
NONPERFORMING ASSETS AND RATIOS
WHOLESALE LOANS (a)
Loans - U.S.
Loans - Non-U.S.
TOTAL WHOLESALE LOANS

$

CONSUMER LOANS (b)
Home loan portfolio (includes RFS and Corporate/Private Equity):
Home equity
Prime mortgage
Subprime mortgage
Option ARMs
Total home loan portfolio
Auto loans
Credit card - reported
Other loans
TOTAL CONSUMER LOANS (c) (d)

Mar 31
2009

5,156
806
5,962

$

Dec 31
2008

3,040
622
3,662

$

Sep 30
2008

2,123
259
2,382

$

Jun 30, 2009
Change
Mar 31
Jun 30
2009
2008

Jun 30
2008

1,185
220
1,405

$

806
64
870

70 %
30
63

NM %
NM
NM

1,487
3,501
2,773
182
7,943
154
4
722
8,823

1,591
2,712
2,545
97
6,945
165
4
625
7,739

1,394
1,895
2,690
10
5,989
148
4
430
6,571

1,142
1,496
2,384
5,022
119
5
382
5,528

1,008
1,232
1,715
3,955
102
6
340
4,403

(7)
29
9
88
14
(7)
16
14

48
184
62
NM
101
51
(33)
112
100

TOTAL NONPERFORMING LOANS REPORTED

14,785

11,401

8,953

6,933

5,273

30

180

Derivative receivables
Assets acquired in loan satisfactions
TOTAL NONPERFORMING ASSETS

704
2,028
17,517

1,010
2,243
14,654

1,079
2,682
12,714

45
2,542
9,520

80
880
6,233

(30)
(10)
20

NM
130
181

49
8
37
(53)
2
22
20

NM
101
(33)
342
NM
379
450
181

$

TOTAL NONPERFORMING LOANS TO TOTAL LOANS REPORTED
NONPERFORMING ASSETS BY LOB
Investment Bank
Retail Financial Services (d)
Card Services
Commercial Banking
Treasury & Securities Services
Asset Management
Corporate/Private Equity (e)
TOTAL

2.17

$

$

4,534
10,351
4
2,255
14
326
33
17,517

$
%

1.61

$

$

3,041
9,582
4
1,651
30
319
27
14,654

$
%

1.20

$

$

2,501
8,841
4
1,142
30
172
24
12,714

$
%

0.91

$

$

583
7,878
5
923
121
10
9,520

$
%

0.98

$

$

490
5,153
6
510
68
6
6,233

%

(a) Included nonperforming loans held-for-sale and loans at fair value of $133 million, $57 million, $32 million, $32 million, and $51 million at June 30, 2009, March 31, 2009, December 31, 2008, September 30, 2008,
and June 30, 2008, respectively. Excluded purchased held-for-sale wholesale loans.
(b) There were no nonperforming loans held-for-sale at June 30, 2009, March 31, 2009, December 31, 2008, September 30, 2008, or June 30, 2008.
(c) Excludes nonperforming loans and assets related to: (1) loans eligible for repurchase, as well as loans repurchased from GNMA pools that are insured by U.S. government agencies, of $4.7 billion, $4.6 billion, $3.3 billion,
$1.8 billion, and $1.9 billion at June 30, 2009, March 31, 2009, December 31, 2008, September 30, 2008, and June 30, 2008, respectively; and (2) student loans that are 90 days past due and still accruing, which are insured
by U.S. government agencies under the Federal Family Education Loan Program, of $473 million, $433 million, $437 million, $405 million, and $394 million at June 30, 2009, March 31, 2009,
December 31, 2008, September 30, 2008, and June 30, 2008, respectively. These amounts for GNMA and education loans are excluded, as reimbursement is proceeding normally.
(d) Excludes home lending purchased credit-impaired loans accounted for under SOP 03-3 that were acquired as part of the Washington Mutual transaction. These loans are accounted for on a pool basis, and the pools
are considered to be performing under SOP 03-3. Also excludes loans held-for-sale and loans at fair value.
(e) Predominantly relates to held-for-investment prime mortgage.

Page 30
JPMORGAN CHASE & CO.
CREDIT-RELATED INFORMATION, CONTINUED
(in millions, except ratio data)
QUARTERLY TRENDS

YEAR-TO-DATE
2Q09 Change

2Q09
GROSS CHARGE-OFFS
Wholesale loans
Consumer (includes RFS and
Corporate/Private Equity)
Credit card - reported
Total loans - reported
Credit card - securitized
Total loans - managed

$

NET CHARGE-OFF RATES
Wholesale loans (a)
Consumer excluding credit card (b)

697

$

4Q08
206

$

3Q08
238

$

2Q08
71

$

1Q09
82

2Q08
238 %

2009
NM %

2,718
2,883
6,298
1,776
8,074

1,752
1,559
3,549
1,351
4,900

1,375
1,245
2,691
985
3,676

1,079
1,209
2,370
949
3,319

21
32
36
12
30

15

21

19

41

20

68
160
243
115
358

51
162
234
123
357

49
139
207
112
319

54
145
240
119
359

(1)
21
15
(3)
9

679

191

217

52

41

255

2,651
2,689
6,019
1,664
7,683

2,176
2,029
4,396
1,464
5,860

1,701
1,397
3,315
1,228
4,543

1,326
1,106
2,484
873
3,357

1,025
1,064
2,130
830
2,960

22
33
37
14
31

$

152
138
166
87
143

67
194
279
112
391

$

2,244
2,189
4,639
1,579
6,218

18

RECOVERIES
Wholesale loans
Consumer (includes RFS and
Corporate/Private Equity)
Credit card - reported
Total loans - reported
Credit card - securitized
Total loans - managed
NET CHARGE-OFFS
Wholesale loans
Consumer (includes RFS and
Corporate/Private Equity)
Credit card - reported
Total loans - reported
Credit card - securitized
Total loans - managed

1Q09

1.19
2.90

$

%

0.32
2.36

$

%

0.33
1.80

$

%

0.10
2.29

$

%

0.08
1.81

%

2009 Change
2008

2008
903

$

212

326 %

4,962
5,072
10,937
3,355
14,292

1,959
2,353
4,524
1,740
6,264

(56)

33

79

(58)

24
34
16
(6)
9

135
354
522
227
749

109
300
488
229
717

24
18
7
(1)
4

NM

870

133

NM

4,827
4,718
10,415
3,128
13,543

1,850
2,053
4,036
1,511
5,547

159
153
183
100
160

$

0.75
2.63

$

%

0.13
1.66

Consumer excluding purchased credit-impaired loans (b)
Credit card - reported
Total loans - reported (a) (b)
Credit card - securitized
Total loans - managed (a) (b)

3.80
12.03
3.52
7.91
4.00

3.09
8.42
2.51
6.93
2.98

2.35
5.63
1.80
5.48
2.20

2.29
5.56
1.91
4.43
2.24

1.81
5.66
1.67
4.32
2.02

3.44
10.15
3.01
7.42
3.49

10.03

7.72

5.56

5.00

4.98

8.85

161
130
158
107
144

%

1.66
5.32
1.60
4.02
1.91

Memo: Credit card - managed

153
116
142
93
128

4.68

(a) Average wholesale loans held-for-sale and loans at fair value were $9.7 billion, $13.3 billion, $16.7 billion, $18.0 billion, and $20.8 billion for the quarters ended June 30, 2009, March 31, 2009, December 31, 2008, September 30, 2008, and
June 30, 2008, respectively, and $11.5 billion and $20.5 billion for year-to-date 2009 and 2008, respectively. These amounts were excluded when calculating the net charge-off rates. Excluding average wholesale purchased credit-impaired
loans of $210 million, $217 million, and $248 million for the quarters ended June 30, 2009, March 31, 2009, and December 31, 2008, respectively, and $213 million for year-to-date 2009 has no effect on the net charge-off rate.
(b) Average consumer (excluding card) loans held-for-sale and loans at fair value were $2.8 billion, $3.1 billion, $1.8 billion, $1.5 billion, and $3.6 billion for the quarters ended June 30, 2009, March 31, 2009, December 31, 2008,
September 30, 2008, and June 30, 2008, respectively, and $2.9 billion and $4.0 billion for year-to-date 2009 and 2008, respectively. These amounts were excluded when calculating the net charge-off rates.

Page 31
JPMORGAN CHASE & CO.
CREDIT-RELATED INFORMATION, CONTINUED
(in millions, except ratio data)
QUARTERLY TRENDS

YEAR-TO-DATE
2Q09 Change

2Q09
SUMMARY OF CHANGES IN THE ALLOWANCE FOR LOAN LOSSES
Beginning balance
Acquired allowance resulting from the Washington Mutual transaction
Net charge-offs
Provision for loan losses (a)
Other (b)
Ending balance
SUMMARY OF CHANGES IN THE ALLOWANCE FOR
LENDING-RELATED COMMITMENTS
Beginning balance
Provision for lending-related commitments
Other
Ending balance
ALLOWANCE COMPONENTS AND RATIOS
ALLOWANCE FOR LOAN LOSSES
Wholesale
Asset specific
Formula - based
Total wholesale

$

$

$

$

$

Consumer
Asset specific
Formula - based
Total consumer
Total allowance for loan losses
Allowance for lending-related commitments
Total allowance for credit losses

27,381
6,019
7,923
(213)
29,072

$

$

638
108
746

$

2,108
6,284
8,392

$

$

132
20,548
20,680

$

Wholesale allowance for loan losses to total wholesale loans (c)
Consumer allowance for loan losses to total consumer loans (d)
Consumer allowance for loan losses to total consumer loans excluding purchased credit-impaired loans and
loans from the Washington Mutual Trust (d) (e) (f)
Allowance for loan losses to ending loans (c) (d)
Allowance for loan losses to ending loans excluding purchased credit-impaired loans and loans from the
Washington Mutual Master Trust (c) (d) (e) (f)
Allowance for loan losses to total nonperforming loans (g) (h)
ALLOWANCE FOR LOAN LOSSES BY LOB
Investment Bank
Retail Financial Services
Card Services
Commercial Banking
Treasury & Securities Services
Asset Management
Corporate/Private Equity
Total

1Q09
23,164
4,396
8,617
(4)
27,381

$

659
(21)
638

$

$

$

1,213
6,691
7,904

$

106
19,371
19,477

29,072
746
29,818
3.75
4.63

4Q08

$
%

19,052
3,315
7,434
(7)
23,164

$

713
(121)
67
659

$

$

$

712
5,833
6,545

$

74
16,545
16,619

27,381
638
28,019
3.43
4.21

3Q08

$
%

13,246
2,535
2,484
5,760
(5)
19,052

$

$
%

686
27
713

$

253
5,326
5,579

$

$

19,052
713
19,765
2.06
2.86

1Q09

$
%

11,746
2,130
3,624
6
13,246

133 %
183
119
NM
119

(3)
NM
17

(25)
NM
9

174
4,295
4,469

74
(6)
6
25
6
6

116
136
136

13,246
686
13,932

6
17
6

119
9
114

9
11
3
(71)
5
25
6

$

2009 Change
2008

2008

NM
46
88

110
134
139
65
(63)
54
25
119

855
(169)
686

$

$

$

23,164
10,415
16,540
(217)
29,072

659
87
746

$

$

$

$

9,234
4,036
8,043
5
13,246

850
(164)
686

151 %
158
106
NM
119

(22)
NM
9

2.13 %
2.86

5.20
3.95

4.24
3.18

3.42
2.56

2.86
2.57

5.01
198

$

2009

18 %
37
(8)
NM
6

5.80
4.33

$

2Q08

61
8,716
8,777

$

70
13,403
13,473

23,164
659
23,823
2.64
3.46

2Q08

4.53
241

3.62
260

2.87
287

2.57
254

5,101
11,832
8,839
3,034
15
226
25
29,072

$

$

4,682
10,619
8,849
2,945
51
215
20
27,381

$

$

3,444
8,918
7,692
2,826
74
191
19
23,164

$

$

2,654
7,517
5,946
2,698
47
170
20
19,052

$

$

2,429
5,062
3,705
1,843
40
147
20
13,246

(a) Includes accounting conformity loan loss reserve provision related to the acquisition of Washington Mutual Bank's banking operations.
(b) Activity for the quarter and six months ended June 30, 2009, predominantly included a reclassification related to the issuance and retention of securities from the Chase Issuance Trust.
(c) Wholesale loans held-for-sale and loans at fair value were $7.6 billion, $11.7 billion, $14.0 billion, $17.0 billion, and $20.0 billion at June 30, 2009, March 31, 2009, December 31, 2008, September 30, 2008, and June 30, 2008, respectively. These
amounts were excluded when calculating the allowance coverage ratios. Excluding wholesale purchased credit-impaired loans of $209 million, $210 million, $224 million, and $272 million at June 30, 2009, March 31, 2009, December 31, 2008,
and September 30, 2008, respectively, has no effect on the wholesale allowance coverage ratios.
(d) Consumer loans held-for-sale were $1.9 billion, $3.7 billion, $2.0 billion, $1.6 billion, and $2.2 billion at June 30, 2009, March 31, 2009, December 31, 2008, September 30, 2008, and June 30, 2008, respectively. These amounts were excluded
when calculating the allowance coverage ratios.
(e) Excludes the impact of purchased credit-impaired loans accounted for under SOP 03-3 that were acquired as part of the Washington Mutual transaction. These loans were accounted for at fair value on the acquisition date, which
incorporated management's estimate, as of that date, of credit losses over the remaining life of the portfolio. No allowance for loan losses has been recorded for these loans as of June 30, 2009, March 31, 2009, December 31, 2008,
or September 30, 2008.
(f) Represents loans from the Washington Mutual Master Trust, which were consolidated onto the Firm's balance sheet at fair value during the second quarter of 2009. No allowance for loan losses was recorded for these loans as of June 30, 2009.
(g) Nonperforming loans held-for-sale and loans at fair value were $133 million, $57 million, $32 million, $32 million, and $51 million at June 30, 2009, March 31, 2009, December 31, 2008, September 30, 2008, and June 30, 2008, respectively.
These amounts were excluded when calculating the allowance coverage ratios.
(h) Excludes consumer purchased credit-impaired loans accounted for under SOP 03-3 that were acquired as part of the Washington Mutual transaction. These loans are accounted for on a pool basis and the pools are considered to be
performing under SOP 03-3.

Page 32
JPMORGAN CHASE & CO.
CREDIT-RELATED INFORMATION, CONTINUED
(in millions)
QUARTERLY TRENDS

YEAR-TO-DATE
2Q09 Change

2Q09
PROVISION FOR CREDIT LOSSES
LOANS
Investment Bank
Commercial Banking
Treasury & Securities Services
Asset Management
Corporate/Private Equity (a) (b)
Total wholesale
Retail Financial Services
Card Services - reported
Corporate/Private Equity (a)
Total consumer
Total provision for loan losses
LENDING-RELATED COMMITMENTS
Investment Bank
Commercial Banking
Treasury & Securities Services
Asset Management
Corporate/Private Equity (a)
Total wholesale
Retail Financial Services
Card Services - reported
Corporate/Private Equity (a)
Total consumer
Total provision for lending-related commitments
TOTAL PROVISION FOR CREDIT LOSSES
Investment Bank
Commercial Banking
Treasury & Securities Services
Asset Management
Corporate/Private Equity (a) (b)
Total wholesale
Retail Financial Services
Card Services - reported
Corporate/Private Equity (a)
Total consumer
Total provision for credit losses
Credit card - securitized
Managed provision for credit losses

$

$

$

$

$

$

1Q09

815
280
(20)
59
7
1,141
3,841
2,939
2
6,782
7,923

$

56
32
15
103
5
5
108

$

871
312
(5)
59
7
1,244
3,846
2,939
2
6,787
8,031

$

1,664
9,695

$

$

$

4Q08

1,274
263
(20)
34
1,551
3,877
3,189
7,066
8,617

$

(64)
30
14
(1)
(21)
(21)

$

1,210
293
(6)
33
1,530
3,877
3,189
7,066
8,596

$

1,464
10,060

$

$

$

3Q08

869
180
27
32
76
1,184
3,578
2,747
(75)
6,250
7,434

$

(104)
10
18
5
(71)
(2)
(48)
(50)
(121)

$

765
190
45
32
81
1,113
3,576
2,747
(123)
6,200
7,313

$

1,228
8,541

$

$

$

2Q08

238
105
7
21
564
935
2,056
1,356
1,413
4,825
5,760

(4)
21
11
(1)
27
27

234
126
18
20
564
962
2,056
1,356
1,413
4,825
5,787
873
6,660

$

$

$

$

$

$

1Q09

538
77
7
17
36
675
1,584
1,364
1
2,949
3,624

2Q08

2009

(36) %
6
74
NM
(26)
(1)
(8)
NM
(4)
(8)

51 %
264
NM
247
(81)
69
142
115
100
130
119

$

NM
7
7
NM
NM
NM
NM
NM

NM
NM
NM
NM
400
400
NM

$

398
47
7
17
36
505
1,585
1,364
1
2,950
3,455

(28)
6
17
79
NM
(19)
(1)
(8)
NM
(4)
(7)

119
NM
NM
247
(81)
146
143
115
100
130
132

$

830
4,285

14
(4)

100
126

(140)
(30)
(170)
1
1
(169)

$

$

$

2009 Change
2008

2008

2,089
543
(40)
93
7
2,692
7,718
6,128
2
13,848
16,540

$

(8)
62
29
(1)
82
5
5
87

$

2,081
605
(11)
92
7
2,774
7,723
6,128
2
13,853
16,627

$

3,128
19,755

$

$

$

1,109
220
18
34
36
1,417
4,272
2,353
1
6,626
8,043

(93)
(72)
1
(1)
(165)
1
1
(164)

88 %
147
NM
174
(81)
90
81
160
100
109
106

91
NM
NM
NM
400
400
NM

1,016
148
19
33
36
1,252
4,273
2,353
1
6,627
7,879

105
309
NM
179
(81)
122
81
160
100
109
111

1,511
9,390

107
110

(a) Includes accounting conformity provisions related to the Washington Mutual transaction in the third quarter of 2008.
(b) Includes provision expense related to loans acquired in the Bear Stearns transaction in the second quarter of 2008.

Page 33
JPMORGAN CHASE & CO.
MARKET RISK-RELATED INFORMATION
(in millions)
QUARTERLY TRENDS

YEAR-TO-DATE
2Q09 Change

2Q09
AVERAGE IB TRADING VAR AND CREDIT
PORTFOLIO VAR - 99% CONFIDENCE LEVEL
IB VaR by risk type:
Fixed income
Foreign exchange
Equities
Commodities and other
Diversification benefit to IB trading VaR (a)
99% IB Trading VaR (b)
Credit portfolio VaR (c)
Diversification benefit to IB trading and credit portfolio VaR (a)
99% Total IB trading and credit portfolio VaR

AVERAGE IB TRADING VAR , CREDIT PORTFOLIO
VAR AND OTHER VAR - 95% CONFIDENCE LEVEL (d)
IB VaR by risk type:
Fixed income
Foreign exchange
Equities
Commodities and other
Diversification benefit to IB trading VaR (a)
95% IB Trading VaR (b)

$

$

$

1Q09

249
26
77
34
(136)
250
133
(116)
267

179
16
50
22
(97)
170

$

$

$

4Q08

218
40
162
28
(159)
289
182
(135)
336

158
23
97
20
(108)
190

$

$

$

3Q08

276
55
87
30
(146)
302
165
(140)
327

194
32
47
21
(103)
191

$

$

$

2Q08

183
20
80
41
(104)
220
47
(49)
218

$

$

1Q09

2Q08

155
26
30
31
(92)
150

14 %
(35)
(52)
21
14
(13)

35
(36)
149

(27)
14
(21)

130
13
46
24
(69)
144

13
(30)
(48)
10
10
(11)

2009

61 %
157
10
(48)
67
280
(222)
79

$

$

$

2009 Change
2008

2008

234
33
119
31
(148)
269
157
(125)
301

$

$

137
30
31
29
(91)
136
33
(34)
135

71 %
10
284
7
(63)
98
376
(268)
123

168
19
73
21
(101)
180

Credit portfolio VaR (c)
Diversification benefit to IB trading and credit portfolio VaR (a)
95% Total IB trading and credit portfolio VaR

68
(60)
178

86
(63)
213

66
(50)
207

25
(22)
147

(21)
5
(16)

77
(62)
195

Consumer Lending VaR (e)
Corporate Risk Management VaR (f)
Diversification benefit to total other VaR (a)
Total other VaR

43
111
(29)
125

108
121
(61)
168

56
76
(31)
101

19
22
(10)
31

(60)
(8)
52
(26)

75
116
(45)
146

(24)
154

4
(26)

Diversification benefit to total IB and other VaR (a)
Total IB and other VaR

$

(89)
214

$

(93)
288

$

(56)
252

$

$

(91)
250

(a) Average VaRs were less than the sum of the VaRs of their market risk components, which was due to risk offsets resulting from portfolio diversification. The diversification effect reflected the fact that the risks were
not perfectly correlated. The risk of a portfolio of positions is therefore usually less than the sum of the risks of the positions themselves.
(b) IB Trading VaR includes predominantly all trading activities in IB; however, particular risk parameters of certain products are not fully captured, for example, correlation risk. The 95% IB Trading VaR includes syndicated
lending facilities that the Firm intends to distribute, and the credit spread sensitivities of certain mortgage products. The 99% IB Trading VaR includes the credit spread sensitivities of certain mortgage products but
does not include syndicated lending facilities that the Firm intends to distribute. Both the 95% and 99% IB Trading VaR do not include the debit valuation adjustments ("DVA") taken on derivative and structured liabilities
to reflect the credit quality of the Firm.
(c) Includes VaR on derivative credit valuation adjustments ("CVA"), hedges of the CVA and mark-to-market hedges of the retained loan portfolio, which are all reported in principal transactions revenue. This VaR does not
include the retained loan portfolio.
(d) In the third quarter of 2008, the Firm revised the VaR measurement to create a more comprehensive view of its market risks by adding syndicated lending facilities that the Firm intends to distribute, and the credit
spread sensitivities of certain mortgage products. In addition, certain actively managed positions utilized as part of the Firm's risk management function within Corporate and in RFS' mortgage banking businesses
have been added to IB VaR to provide a Total IB and other VaR measure. Finally, the Firm moved from using a 99% confidence level to a 95% confidence level since the 95% level provides a more stable measure
of the VaR for day-to-day risk management. This section presents the results of the Firm’s VaR measure under the revised measurement using a 95% confidence level. The Firm intends to only present the VaR at
this confidence level once information for five quarters and two comparative year-to-date periods is available.
(e) Consumer Lending VaR includes the Firm’s mortgage pipeline and warehouse, MSR and all related hedges.
(f) Corporate Risk Management VaR includes certain actively managed positions utilized as part of the Firm's risk management function within Corporate. It does not include certain nontrading activity such as Private
Equity, principal investing (e.g., mezzanine financing, tax-oriented investments, etc.) and Corporate Treasury balance sheet and capital management positions as well as longer-term corporate investments.

Page 34
JPMORGAN CHASE & CO.
CAPITAL, INTANGIBLE ASSETS AND DEPOSITS
(in millions, except ratio data)
Jun 30, 2009
Change
Jun 30
2009
CAPITAL RATIOS
Tier 1 capital
Total capital
Risk-weighted assets
Adjusted average assets
Tier 1 capital ratio
Total capital ratio
Tier 1 leverage ratio
INTANGIBLE ASSETS (PERIOD-END)
Goodwill
Mortgage servicing rights
Purchased credit card relationships
All other intangibles
Total intangibles
DEPOSITS (PERIOD-END)
U.S. offices:
Noninterest-bearing
Interest-bearing
Non-U.S. offices:
Noninterest-bearing
Interest-bearing
Total deposits

Mar 31
2009

$

122,187
167,821
1,263,576
1,969,352
9.7
13.3
6.2

(a) $
(a)
(a)
(a)
% (a)
(a)
(a)

$

48,288
14,600
1,431
3,651
67,970

$

192,247
433,862

$

$

$

$

8,291
232,077
866,477

$

$

Dec 31
2008

137,144
$
183,109
1,207,490
1,923,186
11.4 %
15.2
7.1

48,201
10,634
1,528
3,821
64,184

$

197,027
463,913

$

7,073
238,956
906,969

$

$

Sep 30
2008

136,104
$
184,720
1,244,659
1,966,895
10.9 %
14.8
6.9

48,027
9,403
1,649
3,932
63,011

$

210,899
511,077

$

7,697
279,604
1,009,277

$

$

Jun 30
2008

111,630
$
159,175
1,261,034
1,555,297
8.9 %
12.6
7.2

46,121
17,048
1,827
3,653
68,649

$

193,253
506,974

$

9,747
259,809
969,783

$

$

98,775
145,012
1,079,199
1,536,439
9.2 %
13.4
6.4

Mar 31
2009

Jun 30
2008

(11) %
(8)
5
2

24
16
17
28

45,993
11,617
1,984
3,675
63,269

37
(6)
(4)
6

5
26
(28)
(1)
7

125,606
362,150

(2)
(6)

53
20

7,827
227,322
722,905

17
(3)
(4)

%

6
2
20

(a) Estimated.

Page 35
JPMORGAN CHASE & CO.
PER SHARE-RELATED INFORMATION
(in millions, except per share and ratio data)
QUARTERLY TRENDS

YEAR-TO-DATE
2Q09 Change

2Q09
EARNINGS PER SHARE DATA (a)
Basic earnings per share:
Income (loss) before extraordinary gain
Extraordinary gain
Net income
Less: Preferred stock dividends
Less: Preferred stock accelerated amortization from TARP redemption
Net income applicable to common equity
Less: Dividends and undistributed earnings allocated to participating securities
Net income applicable to common stockholders (c)

$

$

Total weighted-average basic shares outstanding
Income (loss) before extraordinary gain per share (b)
Extraordinary gain per share
Net income per share (b)
Diluted earnings per share:
Net income applicable to common stockholders (c)

COMMON SHARES OUTSTANDING
Common shares outstanding - at period end (f)
Cash dividends declared per share
Book value per share
Dividend payout
SHARE PRICE
High
Low
Close
Market capitalization
STOCK REPURCHASE PROGRAM
Common shares repurchased

2,721
2,721
473
1,112
1,136
64
1,072

$

$

3,811.5
$
$

$

Total weighted-average basic shares outstanding
Add: Employee stock options and SARs (d)
Total weighted-average diluted shares outstanding (e)
Income (loss) before extraordinary gain per share (b)
Extraordinary gain per share
Net income per share (b)

1Q09

$

$

0.28
0.28

$

1,072

$

$

$

38.94
25.29
34.11
133,852

-

$

$

$
$

$

0.40
0.40

$

1,519

$

$

%

$

31.64
14.96
26.58
99,881

-

(623)
1,325
702
423
279
47
232

$

$

$
$

$

(0.29)
0.35
0.06

$

232

$

$

%

$

(0.29)
0.35
0.06

3,732.8
0.38
36.15
532

50.63
19.69
31.53
117,695

-

2Q08

(54)
581
527
161
366
48
318

$

$

3,444.6

3,737.5
(g)
3,737.5

0.40
0.40

3,757.7
0.05
36.78
15

3Q08

3,737.5

3,755.7
3.0
3,758.7

0.28
0.28

3,924.1
0.05
37.36
14

2,141
2,141
529
1,612
93
1,519
3,755.7

3,811.5
12.6
3,824.1
$

4Q08

$

$

(0.08)
0.17
0.09

$

318

$

$

%

$

(0.08)
0.17
0.09

3,726.9
0.38
36.95
399

49.00
29.24
46.70
174,048

-

2,003
2,003
90
1,913
70
1,843

$

$
%

$

2009

36 %
36
426
NM
(41)
(9)
(42)

$

$

1

11

0.54
0.54

(30)
(30)

(48)
(48)

$

1,843

(29)

(42)

$

1
320
2

11
(53)
11

(30)
(30)

(47)
(47)

4
2

14
(87)
1

23
69
28
34

(22)
(26)
(1)
14

3,426.2
26.9
3,453.1
$

2Q08

27 %
27
(11)
NM
(30)
(31)
(29)

3,426.2

3,444.6
(g)
3,444.6
$

1Q09

0.53
0.53

3,435.7
0.38
37.02
71

49.95
33.96
34.31
117,881

-

-

$

$

$
$

$

$

4,376
4,376
90
4,286
153
4,133

11 %
11
NM
(36)
3
(37)

3,411.1

0.68
0.68

$

2,591

$

$

11

1.21
1.21

(44)
(44)

4,133

(37)

3,411.1
27.1
3,438.2

11
(71)
10

1.20
1.20

(43)
(43)

3,924.1
0.10
$
37.36
15 %

3,435.7
0.76
37.02
63 %

14
(87)
1

38.94
14.96
34.11
133,852

49.95
33.96
34.31
117,881

(22)
(56)
(1)
14

3,783.6
7.8
3,791.4

%

-

4,862
4,862
1,002
1,112
2,748
157
2,591
3,783.6

$

2009 Change
2008

2008

0.68
0.68

-

$
$

$

-

-

(a) Effective January 1, 2009, the Firm implemented FSP EITF 03-6-1, which clarifies that unvested stock-based compensation awards containing nonforfeitable rights to dividends or dividend equivalents (collectively, “dividends”) are participating
securities and should be included in the EPS calculation using the two-class method. JPMorgan Chase grants restricted stock and RSUs to certain employees under its stock-based compensation programs, which entitle the recipients to receive
nonforfeitable dividends during the vesting period on a basis equivalent to the dividends paid to holders of common stock. These unvested awards meet the FSP’s definition of participating securities. Under the two-class method, all earnings
(distributed and undistributed) are allocated to each class of common stock and participating securities, based on their respective rights to receive dividends. EPS data for the prior periods were revised as required by the FSP.
(b) The calculation of second quarter 2009 earnings per share includes a one-time, non-cash reduction of $1.1 billion, or $0.27 per share, resulting from repayment of TARP preferred capital.
(c) Net income applicable to common stockholders for diluted and basic EPS may differ under the two-class method as a result of adding common stock equivalents for options, SARs and warrants to dilutive shares outstanding, which alters the
ratio used to allocate earnings to common stockholders and participating securities for purposes of calculating diluted EPS.
(d) Options issued under employee benefit plans and, subsequent to October 28, 2008, the warrant issued under the U.S. Treasury’s Capital Purchase Program, to purchase an aggregate 315 million, 363 million, 299 million, 194 million, and 169 million
shares of common stock were outstanding for the quarters ended June 30, 2009, March 31, 2009, December 31, 2008, September 30, 2008, and June 30, 2008, respectively, but were not included in the computation of diluted EPS because the
options were antidilutive.
(e) Participating securities were included in the calculation of diluted EPS using the two-class method, as this computation was more dilutive than the calculation using the treasury-stock method.
(f) On June 5, 2009, the Firm issued $5.8 billion, or 163 million shares, of its common stock at $35.25 per share; and on September 30, 2008, the Firm issued $11.5 billion, or 284 million shares, of its common stock at $40.50 per share.
(g) Common equivalent shares have been excluded from the computation of diluted loss per share for the fourth and third quarters of 2008, as the effect would have been antidilutive.

Page 36
JPMORGAN CHASE & CO.
Glossary of Terms
ACH: Automated Clearing House.
Average managed assets: Refers to total assets on the Firm's Consolidated Balance Sheets plus
credit card receivables that have been securitized.
Beneficial interest issued by consolidated VIEs: Represents the interest of third-party holders
of debt/equity securities, or other obligations, issued by VIEs that JPMorgan Chase consolidates
under FIN 46R. The underlying obligations of the VIEs consist of short-term borrowings,
commercial paper and long-term debt. The related assets consist of trading assets, availablefor-sale securities, loans and other assets.
Contractual credit card charge-off: In accordance with the Federal Financial Institutions
Examination Council policy, credit card loans are charged off by the end of the month in which
the account becomes 180 days past due or within 60 days from receiving notification of the filing
of bankruptcy, whichever is earlier.
Corporate/Private Equity: Includes Private Equity, Treasury and Corporate Other, which includes other
centrally managed expense and discontinued operations.
Credit card securitizations: Card Services' managed results excludes the impact of credit card
securitizations on total net revenue, the provision for credit losses, net charge-offs and loan
receivables. Through securitization, the Firm transforms a portion of its credit card receivables
into securities, which are sold to investors. The credit card receivables are removed from the
Consolidated Balance Sheets through the transfer of the receivables to a trust and the sale of
undivided interests to investors that entitle the investors to specific cash flows generated from
the credit card receivables. The Firm retains the remaining undivided interests as seller’s
interests, which are recorded in loans on the Consolidated Balance Sheets. A gain or loss on
the sale of credit card receivables to investors is recorded in other income. Securitization also
affects the Firm’s Consolidated Statements of Income as the aggregate amount of interest
income, certain fee revenue and recoveries that is in excess of the aggregate amount of interest
paid to the investors, gross credit losses and other trust expense related to the securitized
receivables are reclassified into credit card income in the Consolidated Statements of Income.
FASB: Financial Accounting Standards Board.
FIN 46(R): FASB Interpretation No. 46 (revised December 2003), “Consolidation of Variable
Interest Entities, an interpretation of Accounting Research Bulletin No. 51.”
FSP EITF 03-6-1: FASB Staff Position No. EITF 03-6-1 "Determining Whether Instruments Granted in Share-Based
Payment Transactions Are Participating Securities."
Interests in purchased receivables: Represent an ownership interest in cash flows of an underlying pool of
receivables transferred by a third-party seller into a bankruptcy-remote entity, generally a trust.
Investment-grade: An indication of credit quality based upon JPMorgan Chase's internal risk
assessment system. “Investment-grade” generally represents a risk profile similar to a rating of
a "BBB-"/"Baa3" or better, as defined by independent rating agencies.
Managed basis: A non-GAAP presentation of financial results that includes reclassifications
related to credit card securitizations and to present revenue on a fully taxable-equivalent basis.
Management uses this non-GAAP financial measure at the segment level because it believes this
provides information to enable investors to understand the underlying operational performance and
trends of the particular business segment and facilitates a comparison of the business segment
with the performance of competitors.

Managed credit card receivables: Refers to credit card receivables on the Firm's Consolidated
Balance Sheets plus credit card receivables that have been securitized.
Mark-to-market exposure: A measure, at a point in time, of the value of a derivative or foreign
exchange contract in the open market. When the mark-to-market value is positive, it indicates the
counterparty owes JPMorgan Chase and, therefore, creates a repayment risk for the Firm. When
the mark-to-market value is negative, JPMorgan Chase owes the counterparty. In this situation,
the Firm does not have repayment risk.
Merger costs: Reflects costs associated with the Washington Mutual and Bear Stearns mergers in 2008.
MSR risk management revenue: Includes changes in MSR asset fair value due to inputs or
assumptions in model and derivative valuation adjustments and other.
Net yield on interest-earning assets: The average rate for interest-earning assets less the
average rate paid for all sources of funds.
NM: Not meaningful.
Overhead ratio: Noninterest expense as a percentage of total net revenue.
Principal transactions (revenue): Realized and unrealized gains and losses from trading activities
(including physical commodities inventories that are accounted for at the lower of cost or fair
value) and changes in fair value associated with financial instruments held by the Investment Bank for
which the SFAS 159 fair value option was elected. Principal transactions revenue also include private
equity gains and losses.
Reported basis: Financial statements prepared under accounting principles generally
accepted in the United States of America ("U.S. GAAP"). The reported basis includes the
impact of credit card securitizations, but excludes the impact of taxable equivalent adjustments.
SFAS: Statement of Financial Accounting Standards.
SFAS 140: "Accounting for Transfers and Servicing of Financial Assets and Extinguishments of
Liabilities - a replacement of FASB Statement No. 125."
SFAS 141: "Business Combinations."
SOP 03-3: “Accounting for Certain Loans of Debt Securities Acquired in a Transfer.”
Taxable-equivalent basis: Total net revenue for each of the business segments and the Firm is
presented on a tax-equivalent basis. Accordingly, revenue from tax-exempt securities and
investments that receive tax credits is presented in the managed results on a basis comparable
to fully taxable securities and investments. This non-GAAP financial measure allows management to
assess the comparability of revenue arising from both taxable and tax-exempt sources. The
corresponding income tax impact related to these items is recorded within income tax expense.
Unaudited: Financial statements and information that have not been subjected to auditing procedures
sufficient to permit an independent certified public accountant to express an opinion.
U.S. GAAP: Accounting principles generally accepted in the United States of America.
Value-at-risk: A measure of the dollar amount of potential loss from adverse market
moves in an ordinary market environment.

Page 37
JPMORGAN CHASE & CO.
Line of Business Metrics
Investment Banking

Retail Financial Services (continued)

IB'S REVENUE COMPRISES THE FOLLOWING:

MORTGAGE ORIGINATION CHANNELS COMPRISE THE FOLLOWING:

1. Investment banking fees include advisory, equity underwriting, bond underwriting and loan syndication fees.

1. Retail - Borrowers who are buying or refinancing a home through direct contact with a mortgage banker
employed by the Firm using a branch office, the Internet or by phone. Borrowers are frequently referred to a
mortgage banker by real estate brokers, home builders or other third parties.

2. Fixed income markets include client and portfolio management revenue related to both market-making and
proprietary risk-taking across global fixed income markets, including foreign exchange, interest rate, credit and
commodities markets.
3. Equities markets include client and portfolio management revenue related to market-making and proprietary
risk-taking across global equity products, including cash instruments, derivatives and convertibles.
4. Credit portfolio revenue includes net interest income, fees and loan sale activity, as well as gains or losses
on securities received as part of a loan restructuring, for the IB’s credit portfolio. Credit portfolio revenue also
includes the results of risk management related to the Firm's lending and derivative activities, and changes in the
credit valuation adjustment, which is the component of the fair value of a derivative that reflects the credit quality
of the counterparty.

2. Wholesale - A third-party mortgage broker refers loan applications to a mortgage banker at the Firm.
Brokers are independent loan originators that specialize in finding and counseling borrowers but do not provide
funding for and do not underwrite the loans.
3. Correspondent - Correspondents are banks, thrifts, other mortgage banks and other financial institutions that
sell closed loans to the Firm.
4. Correspondent negotiated transactions ("CNT") - These transactions occur when mid- to large-sized
mortgage lenders, banks and bank-owned mortgage companies sell servicing to the Firm on an as-originated
basis, and exclude purchased bulk servicing transactions. These transactions supplement traditional production
channels and provide growth opportunities in the servicing portfolio in stable and rising-rate periods.

Retail Financial Services

Card Services

DESCRIPTION OF SELECTED BUSINESS METRICS WITHIN RETAIL BANKING:

DESCRIPTION OF SELECTED BUSINESS METRICS WITHIN CARD SERVICES:

1. Personal bankers - Retail branch office personnel who acquire, retain and expand new and existing customer
relationships by assessing customer needs and recommending and selling appropriate banking products and
services.

1. Charge volume - Represents the dollar amount of cardmember purchases, balance transfers and cash
advance activity.
2. Net accounts opened - Includes originations, purchases and sales.

2. Sales specialists - Retail branch office personnel who specialize in the marketing of a single product,
including mortgages, investments, and business banking, by partnering with the personal bankers.

3. Merchant acquiring business - Represents a business that processes bank card transactions for merchants.

MORTGAGE FEES AND RELATED INCOME COMPRISE THE FOLLOWING:

4. Bank card volume - Represents the dollar amount of transactions processed for merchants.

1. Production revenue includes net gains or losses on originations and sales of prime and subprime mortgage
loans and other production-related fees.

5. Total transactions - Represents the number of transactions and authorizations processed for merchants.

2. Net mortgage servicing revenue
a) Servicing revenue represents all gross income earned from servicing third-party mortgage loans
including stated service fees, excess service fees, late fees and other ancillary fees.
b) Changes in MSR asset fair value due to:
-- market-based inputs such as interest rates and volatility, as well as updates to assumptions
used in the MSR valuation model.
-- modeled servicing portfolio runoff (or time decay)
c) Derivative valuation adjustments and other, which represents changes in the fair value of
derivative instruments used to offset the impact of changes in the market-based inputs to the MSR
valuation model.
3. MSR risk management results include changes in the MSR asset fair value due to inputs or assumptions
and derivative valuation adjustments and other.

Page 38
JPMORGAN CHASE & CO.
Line of Business Metrics (continued)
Commercial Banking

Asset Management

COMMERCIAL BANKING REVENUE COMPRISES THE FOLLOWING:

Assets under management: Represent assets actively managed by Asset Management on behalf of
Institutional, Retail, Private Banking, Private Wealth Management and Bear Stearns Private Client Services
clients. Excludes assets managed by American Century Companies, Inc., in which the Firm has a 42% ownership
interest as of June 30, 2009.

1. Lending includes a variety of financing alternatives, which are primarily provided on a basis secured by
receivables, inventory, equipment, real estate or other assets. Products include term loans, revolving lines of
credit, bridge financing, asset-based structures and leases.
2. Treasury services includes a broad range of products and services enabling clients to transfer, invest and
manage the receipt and disbursement of funds, while providing the related information reporting. These
products and services include U.S. dollar and multi-currency clearing, ACH, lockbox, disbursement and
reconciliation services, check deposits, other check and currency-related services, trade finance and logistics
solutions, commercial card, and deposit products, sweeps and money market mutual funds.

Assets under supervision: Represents assets under management as well as custody, brokerage, administration
and deposit accounts.
Alternative assets: The following types of assets constitute alternative investments - hedge funds, currency, real
estate and private equity.
AM's CLIENT SEGMENTS COMPRISE THE FOLLOWING:

3. Investment banking products provide clients with sophisticated capital-raising alternatives, as well as
balance sheet and risk management tools through loan syndications, investment-grade debt, asset-backed
securities, private placements, high-yield bonds, equity underwriting, advisory, interest rate derivatives, foreign
exchange hedges and securities sales.
DESCRIPTION OF SELECTED BUSINESS METRICS WITHIN COMMERCIAL BANKING:
1. Liability balances include deposits and deposits that are swept to on-balance sheet liabilities such as
commercial paper, federal funds purchased and securities sold under repurchase agreements.
2. IB revenue, gross - Represents total revenue related to investment banking products sold to CB clients.

1. Institutional brings comprehensive global investment services - including asset management, pension
analytics, asset/liability management and active risk budgeting strategies - to corporate and public institutions,
endowments, foundations, not-for-profit organizations and governments worldwide.
2. Retail provides worldwide investment management services and retirement planning and administration
through third-party and direct distribution of a full range of investment vehicles.
3. The Private Bank addresses every facet of wealth management for ultra-high-net-worth individuals and
families worldwide, including investment management, capital markets and risk management, tax and estate
planning, banking, capital raising and specialty-wealth advisory services.
4. Private Wealth Management offers high-net-worth individuals, families and business owners in the United
States comprehensive wealth management solutions, including investment management, capital markets and risk
management, tax and estate planning, banking, and specialty-wealth advisory services.

Treasury & Securities Services
Treasury & Securities Services firmwide metrics include certain TSS product revenue and liability balances
reported in other lines of business related to customers who are also customers of those other lines of business.
In order to capture the firmwide impact of TS and TSS products and revenue, management reviews firmwide
metrics such as liability balances, revenue and overhead ratios in assessing financial performance for TSS.
Firmwide metrics are necessary, in management's view, in order to understand the aggregate TSS business.

5. Bear Stearns Private Client Services provides investment advice and wealth management services to highnet-worth individuals, money managers, and small corporations.

DESCRIPTION OF SELECTED BUSINESS METRICS WITHIN TREASURY & SECURITIES SERVICES:
Liability balances include deposits and deposits that are swept to on-balance sheet liabilities such as
commercial paper, federal funds purchased and securities loaned or sold under repurchase agreements.

Page 39

2 q09 erf_supplement_final

  • 1.
    EARNINGS RELEASE FINANCIALSUPPLEMENT SECOND QUARTER 2009
  • 2.
    JPMORGAN CHASE &CO. TABLE OF CONTENTS Page Consolidated Results Consolidated Financial Highlights Statements of Income Consolidated Balance Sheets Condensed Average Balance Sheets and Annualized Yields Reconciliation from Reported to Managed Summary 2 3 4 5 6 Business Detail Line of Business Financial Highlights - Managed Basis Investment Bank Retail Financial Services Card Services - Managed Basis Commercial Banking Treasury & Securities Services Asset Management Corporate/Private Equity 7 8 11 17 20 22 24 27 Credit-Related Information 29 Market Risk-Related Information 34 Supplemental Detail Capital, Intangible Assets and Deposits Per Share-Related Information 35 36 Glossary of Terms 37 Page 1
  • 3.
    JPMORGAN CHASE &CO. CONSOLIDATED FINANCIAL HIGHLIGHTS (in millions, except per share, ratio and headcount data) QUARTERLY TRENDS YEAR-TO-DATE 2Q09 Change 2Q09 SELECTED INCOME STATEMENT DATA: Reported Basis Total net revenue Total noninterest expense Pre-provision profit Provision for credit losses Income (loss) before extraordinary gain Extraordinary gain NET INCOME Managed Basis (a) Total net revenue Total noninterest expense Pre-provision profit Provision for credit losses Income (loss) before extraordinary gain Extraordinary gain NET INCOME 1Q09 4Q08 3Q08 2Q08 1Q09 2Q08 2009 2009 Change 2008 2008 $ 25,623 13,520 12,103 8,031 2,721 2,721 $ 25,025 13,373 11,652 8,596 2,141 2,141 $ 17,226 11,255 5,971 7,313 (623) 1,325 702 $ 14,737 11,137 3,600 5,787 (54) 581 527 $ 18,399 12,177 6,222 3,455 2,003 2,003 2 % 1 4 (7) 27 27 39 % 11 95 132 36 36 $ 50,648 26,893 23,755 16,627 4,862 4,862 $ 35,289 21,108 14,181 7,879 4,376 4,376 44 % 27 68 111 11 11 $ 27,709 13,520 14,189 9,695 2,721 2,721 $ 26,922 13,373 13,549 10,060 2,141 2,141 $ 19,108 11,255 7,853 8,541 (623) 1,325 702 $ 16,088 11,137 4,951 6,660 (54) 581 527 $ 19,678 12,177 7,501 4,285 2,003 2,003 3 1 5 (4) 27 27 41 11 89 126 36 36 $ 54,631 26,893 27,738 19,755 4,862 4,862 $ 37,576 21,108 16,468 9,390 4,376 4,376 45 27 68 110 11 11 PER COMMON SHARE: Basic Earnings (b) Income (loss) before extraordinary gain Net income 0.28 0.28 0.40 0.40 (0.29) 0.06 (0.08) 0.09 0.54 0.54 (30) (30) (48) (48) 0.68 0.68 1.21 1.21 (44) (44) Diluted Earnings (b) (c) Income (loss) before extraordinary gain Net income 0.28 0.28 0.40 0.40 (0.29) 0.06 (0.08) 0.09 0.53 0.53 (30) (30) (47) (47) 0.68 0.68 1.20 1.20 (43) (43) Cash dividends declared Book value Closing share price Market capitalization 0.05 37.36 34.11 133,852 0.05 36.78 26.58 99,881 0.38 36.15 31.53 117,695 0.38 36.95 46.70 174,048 0.38 37.02 34.31 117,881 2 28 34 (87) 1 (1) 14 0.10 37.36 34.11 133,852 0.76 37.02 34.31 117,881 (87) 1 (1) 14 COMMON SHARES OUTSTANDING: Weighted-average diluted shares outstanding (b) Common shares outstanding at period-end 3,824.1 3,924.1 3,758.7 3,757.7 3,737.5 3,732.8 3,444.6 3,726.9 3,453.1 3,435.7 2 4 11 14 3,791.4 3,924.1 3,438.2 3,435.7 10 14 FINANCIAL RATIOS: (d) Income (loss) before extraordinary gain: Return on common equity ("ROE") (e) Return on equity-goodwill ("ROE-GW") (e) (f) Return on assets ("ROA") Net income: ROE (e) ROE-GW (e) (f) ROA 3 % 5 0.54 5 % 7 0.42 3 5 0.54 5 7 0.42 1 1 0.13 1 2 0.12 6 10 0.48 CAPITAL RATIOS: Tier 1 capital ratio Total capital ratio 9.7 (g) 13.3 (g) 11.4 15.2 10.9 14.8 8.9 12.6 9.2 13.4 SELECTED BALANCE SHEET DATA (Period-end) Total assets Wholesale loans Consumer loans Deposits Common stockholders' equity Total stockholders' equity $ Headcount LINE OF BUSINESS NET INCOME (LOSS) Investment Bank Retail Financial Services Card Services Commercial Banking Treasury & Securities Services Asset Management Corporate/Private Equity Net income 2,026,642 231,625 448,976 866,477 146,614 154,766 $ 220,255 $ $ 1,471 15 (672) 368 379 352 808 2,721 2,079,188 242,284 465,959 906,969 138,201 170,194 (3) % (5) (0.11) $ 219,569 $ $ 1,606 474 (547) 338 308 224 (262) 2,141 2,175,052 262,044 482,854 1,009,277 134,945 166,884 (1) % (1) (0.01) $ 224,961 $ $ (2,364) 624 (371) 480 533 255 1,545 702 2,251,469 288,445 472,936 969,783 137,691 145,843 6 10 0.48 $ 228,452 $ $ 882 64 292 312 406 351 (1,780) 527 1,775,670 229,359 308,670 722,905 127,176 133,176 195,594 $ $ 394 503 250 355 425 395 (319) 2,003 % 4 6 0.48 % 7 11 0.54 4 6 0.48 (3) (4) (4) (4) 6 (9) 14 1 45 20 15 16 - 13 (8) (97) (23) 9 23 57 NM 27 273 (97) NM 4 (11) (11) NM 36 $ 2,026,642 231,625 448,976 866,477 146,614 154,766 7 11 0.54 $ $ 3,077 489 (1,219) 706 687 576 546 4,862 $ $ 1,775,670 229,359 308,670 722,905 127,176 133,176 14 1 45 20 15 16 195,594 220,255 $ % 13 307 192 859 647 828 751 792 4,376 NM 155 NM 9 (17) (23) (31) 11 (a) For further discussion of managed basis, see Reconciliation from reported to managed summary on page 6. (b) Effective January 1, 2009, the Firm adopted FSP EITF 03-6-1. Accordingly, prior period numbers have been revised as required. For further discussion of this FSP, see Per share-related information on page 36. (c) The calculation of second quarter 2009 earnings per share includes a one-time, non-cash reduction of $1.1 billion, or $0.27 per share, resulting from repayment of TARP preferred capital. (d) Ratios are based upon annualized amounts. (e) The calculation of second quarter and year-to-date 2009 net income applicable to common equity includes a one-time, non-cash reduction of $1.1 billion resulting from repayment of TARP preferred capital. Excluding this reduction the adjusted ROE and ROE-GW were 6% and 10% for the second quarter 2009 , respectively, and 6% and 9% for the year-to-date, respectively. The Firm views the adjusted ROE and ROE-GW, non-GAAP financial measures, as meaningful because it increases the comparability to prior periods. (f) Net income applicable to common equity divided by total average common equity (net of goodwill). The Firm uses return on equity less goodwill, a non-GAAP financial measure, to evaluate the operating performance of the Firm. The Firm utilizes this measure to facilitate comparisons to competitors. (g) Estimated. Page 2
  • 4.
    JPMORGAN CHASE &CO. STATEMENTS OF INCOME (in millions, except per share and ratio data) QUARTERLY TRENDS YEAR-TO-DATE 2009 Change 2008 2Q09 Change 2Q09 REVENUE Investment banking fees Principal transactions Lending & deposit-related fees Asset management, administration and commissions Securities gains Mortgage fees and related income Credit card income Other income Noninterest revenue $ Interest income Interest expense Net interest income 1Q09 2,106 3,097 1,766 3,124 347 784 1,719 10 12,953 $ 4Q08 1,386 2,001 1,688 2,897 198 1,601 1,837 50 11,658 $ 3Q08 1,382 (7,885) 1,776 3,234 456 1,789 2,049 593 3,394 $ 2Q08 1,316 (2,763) 1,168 3,485 424 457 1,771 (115) 5,743 $ 1Q09 2Q08 2009 1,612 752 1,105 3,628 647 696 1,803 (138) 10,105 52 % 55 5 8 75 (51) (6) (80) 11 31 % 312 60 (14) (46) 13 (5) NM 28 (8) (15) (5) $ (53) 53 2008 3,492 5,098 3,454 6,021 545 2,385 3,556 60 24,611 $ 2,828 (51) 2,144 7,224 680 1,221 3,599 1,691 19,336 23 % NM 61 (17) (20) 95 (1) (96) 27 34,475 8,438 26,037 34,061 18,108 15,953 1 (53) 63 16,549 3,879 12,670 17,926 4,559 13,367 21,631 7,799 13,832 17,326 8,332 8,994 16,529 8,235 8,294 TOTAL NET REVENUE 25,623 25,025 17,226 14,737 18,399 2 39 50,648 35,289 44 Provision for credit losses 8,031 8,596 7,313 5,787 3,455 (7) 132 16,627 7,879 111 6,917 914 1,156 1,518 417 2,190 265 143 13,520 7,588 885 1,146 1,515 384 1,375 275 205 13,373 5,024 955 1,207 1,819 501 1,242 326 181 11,255 5,858 766 1,112 1,451 453 1,096 305 96 11,137 6,913 669 1,028 1,450 413 1,233 316 155 12,177 (9) 3 1 9 59 (4) (30) 1 37 12 5 1 78 (16) (8) 11 14,505 1,799 2,302 3,033 801 3,565 540 348 26,893 11,864 1,317 1,996 2,783 959 1,402 632 155 21,108 22 37 15 9 (16) 154 (15) 125 27 4,072 1,351 2,721 2,721 3,056 915 2,141 2,141 (1,342) (719) (623) 1,325 702 (2,187) (2,133) (54) 581 527 2,767 764 2,003 2,003 33 48 27 27 47 77 36 36 7,128 2,266 4,862 4,862 6,302 1,926 4,376 4,376 13 18 11 11 0.53 0.53 (30) (30) (47) (47) 1.20 1.20 (43) (43) NONINTEREST EXPENSE Compensation expense Occupancy expense Technology, communications and equipment expense Professional & outside services Marketing Other expense (a) Amortization of intangibles Merger costs TOTAL NONINTEREST EXPENSE Income (loss) before income tax expense and extraordinary gain Income tax expense (benefit) (b) Income (loss) before extraordinary gain Extraordinary gain (c) NET INCOME DILUTED EARNINGS PER SHARE Income (loss) before extraordinary gain (d)(e) Extraordinary gain NET INCOME (d)(e) $ $ $ FINANCIAL RATIOS Income (loss) before extraordinary gain: ROE (f) ROE-GW (f) ROA Net income: ROE (f) ROE-GW (f) ROA Effective income tax rate (b) Overhead ratio $ 0.28 0.28 3 5 0.54 $ $ % EXCLUDING IMPACT OF MERGER COSTS (g) Income (loss) before extraordinary gain Merger costs (after-tax) Income (loss) before extraordinary gain excluding merger costs $ Diluted Per Share: Income (loss) before extraordinary gain (d)(e) Merger costs (after-tax) Income (loss) before extraordinary gain excluding merger costs (d)(e) $ $ $ 0.40 0.40 5 7 0.42 3 5 0.54 33 53 $ $ $ % $ $ 0.28 0.02 0.30 $ $ $ $ (3) % (5) (0.11) 5 7 0.42 30 53 2,721 89 2,810 (0.29) 0.35 0.06 $ $ $ 0.40 0.03 0.43 $ $ $ $ (1) % (1) (0.01) 1 1 0.13 54 65 2,141 127 2,268 (0.08) 0.17 0.09 $ 6 10 0.48 1 2 0.12 98 76 (623) 112 (511) $ $ (0.29) 0.03 (0.26) $ $ $ $ 0.68 0.68 $ % 4 6 0.48 6 10 0.48 28 66 (54) 60 6 $ $ (0.08) 0.02 (0.06) $ $ $ $ $ % 7 11 0.54 4 6 0.48 32 53 2,003 96 2,099 27 (30) 24 36 (7) 34 $ $ 0.53 0.03 0.56 (30) (33) (30) (47) (33) (46) $ 7 11 0.54 31 60 4,862 216 5,078 $ 0.68 0.05 0.73 $ $ % $ $ 4,376 96 4,472 11 125 14 1.20 0.03 1.23 (43) 67 (41) (a) Second quarter 2009 includes a $675 million FDIC special assessment. (b) The income tax benefit in the third quarter of 2008 includes the realization of a benefit from the release of deferred tax liabilities associated with the undistributed earnings of certain non-U.S. subsidiaries that were deemed to be reinvested indefinitely. (c) JPMorgan Chase acquired the banking operations of Washington Mutual Bank for $1.9 billion. The fair value of the net assets acquired exceeded the purchase price, which resulted in negative goodwill. In accordance with SFAS 141, nonfinancial assets that are not held-for-sale were written down against that negative goodwill. The negative goodwill that remained after writing down nonfinancial assets was recognized as an extraordinary gain. (d) Effective January 1, 2009, the Firm adopted FSP EITF 03-6-1. Accordingly, prior period numbers have been revised as required. For further discussion of this FSP, see Per share-related information on page 36. (e) The calculation of second quarter 2009 earnings per share includes a one-time, non-cash reduction of $1.1 billion, or $0.27 per share, resulting from repayment of TARP preferred capital. (f) The calculation of second quarter and year-to-date 2009 net income applicable to common equity includes a one-time, non-cash reduction of $1.1 billion resulting from repayment of TARP preferred capital. Excluding this reduction the adjusted ROE and ROE-GW were 6% and 10% for the second quarter 2009 , respectively, and 6% and 9% for the year-to-date, respectively. The Firm views the adjusted ROE and ROE-GW, non-GAAP financial measures, as meaningful because it increases the comparability to prior periods. (g) Net income excluding merger costs, a non-GAAP financial measure, is used by the Firm to facilitate comparison of results against the Firm's ongoing operations and with other companies' U.S. GAAP financial statements. Page 3
  • 5.
    JPMORGAN CHASE &CO. CONSOLIDATED BALANCE SHEETS (in millions) Jun 30 2009 ASSETS Cash and due from banks Deposits with banks Federal funds sold and securities purchased under resale agreements Securities borrowed Trading assets: Debt and equity instruments Derivative receivables Securities Loans Less: allowance for loan losses Loans, net of allowance for loan losses Accrued interest and accounts receivable Premises and equipment Goodwill Other intangible assets: Mortgage servicing rights Purchased credit card relationships All other intangibles Other assets (a) TOTAL ASSETS LIABILITIES Deposits Federal funds purchased and securities loaned or sold under repurchase agreements Commercial paper Other borrowed funds (a) Trading liabilities: Debt and equity instruments Derivative payables Accounts payable and other liabilities (including the allowance for lending-related commitments) Beneficial interests issued by consolidated VIEs Long-term debt Junior subordinated deferrable interest debentures held by trusts that issued guaranteed capital debt securities TOTAL LIABILITIES STOCKHOLDERS' EQUITY Preferred stock Common stock Capital surplus Retained earnings Accumulated other comprehensive income (loss) Shares held in RSU trust Treasury stock, at cost TOTAL STOCKHOLDERS' EQUITY TOTAL LIABILITIES AND STOCKHOLDERS' EQUITY $ 25,133 61,882 159,170 129,263 Mar 31 2009 $ 26,681 89,865 157,237 127,928 Dec 31 2008 $ 26,895 138,139 203,115 124,000 Sep 30 2008 $ 54,350 34,372 233,668 152,050 Jun 30 2008 $ Jun 30, 2009 Change Mar 31 Jun 30 2009 2008 32,255 17,150 176,287 142,854 (6) % (31) 1 1 (22) % 261 (10) (10) 298,135 97,491 345,563 680,601 29,072 651,529 61,302 10,668 48,288 298,453 131,247 333,861 708,243 27,381 680,862 52,168 10,336 48,201 347,357 162,626 205,943 744,898 23,164 721,734 60,987 10,045 48,027 401,609 118,648 150,779 761,381 19,052 742,329 104,232 9,962 46,121 409,608 122,389 119,173 538,029 13,246 524,783 64,294 10,333 45,993 (26) 4 (4) 6 (4) 18 3 - (27) (20) 190 26 119 24 (5) 3 5 $ 14,600 1,431 3,651 118,536 2,026,642 $ 10,634 1,528 3,821 106,366 2,079,188 $ 9,403 1,649 3,932 111,200 2,175,052 $ 17,048 1,827 3,653 180,821 2,251,469 $ 11,617 1,984 3,675 93,275 1,775,670 37 (6) (4) 11 (3) 26 (28) (1) 27 14 $ 866,477 $ 906,969 $ 1,009,277 $ 969,783 $ 722,905 (4) 20 300,931 42,713 73,968 192,546 37,845 132,400 224,075 54,480 167,827 194,724 50,151 22,594 8 29 (34) 55 (15) 227 56,021 67,197 53,786 86,020 45,274 121,604 76,213 85,816 87,841 95,749 4 (22) (36) (30) 171,685 20,945 254,226 165,521 9,674 243,569 187,978 10,561 252,094 260,563 11,437 238,034 171,004 20,071 260,192 4 117 4 4 (2) 17,713 1,871,876 $ 279,837 33,085 112,257 18,276 1,908,994 18,589 2,008,168 17,398 2,105,626 17,263 1,642,494 (3) (2) 3 14 8,152 4,105 97,662 56,355 (3,438) (86) (7,984) 154,766 2,026,642 31,993 3,942 91,469 55,487 (4,490) (86) (8,121) 170,194 2,079,188 31,939 3,942 92,143 54,013 (5,687) (217) (9,249) 166,884 2,175,052 8,152 3,942 90,535 55,217 (2,227) (267) (9,509) 145,843 2,251,469 6,000 3,658 78,870 56,313 (1,566) (269) (9,830) 133,176 1,775,670 (75) 4 7 2 23 2 (9) (3) 36 12 24 $ $ $ $ (120) 68 19 16 14 (a) On September 19, 2008, the Federal Reserve established a special lending facility, the AML Facility, to provide liquidity to eligible money market mutual funds. The Firm participated in the AML Facility and had ABCP investments totaling $14.5 billion, $6.0 billion, $11.2 billion, and $61.3 billion at June 30, 2009, March 31, 2009, December 31, 2008, and September 30, 2008, respectively. These ABCP investments were recorded in other assets with the corresponding nonrecourse liability to the Federal Reserve Bank of Boston for the same amounts recorded in other borrowed funds. Page 4
  • 6.
    JPMORGAN CHASE &CO. CONDENSED AVERAGE BALANCE SHEETS AND ANNUALIZED YIELDS (in millions, except rates) QUARTERLY TRENDS YEAR-TO-DATE 2Q09 Change 2Q09 AVERAGE BALANCES ASSETS Deposits with banks Federal funds sold and securities purchased under resale agreements Securities borrowed Trading assets - debt instruments Securities Loans Other assets (a) Total interest-earning assets Trading assets - equity instruments Goodwill Other intangible assets: Mortgage servicing rights All other intangible assets All other noninterest-earning assets TOTAL ASSETS LIABILITIES Interest-bearing deposits Federal funds purchased and securities loaned or sold under repurchase agreements Commercial paper Other borrowings and liabilities (b) Beneficial interests issued by consolidated VIEs Long-term debt Total interest-bearing liabilities Noninterest-bearing liabilities TOTAL LIABILITIES Preferred stock Common stockholders' equity TOTAL STOCKHOLDERS' EQUITY TOTAL LIABILITIES AND STOCKHOLDERS' EQUITY $ 1Q09 68,001 $ 4Q08 88,587 $ 3Q08 106,156 $ 2Q08 41,303 $ 1Q09 38,813 2Q08 (23) % 2009 75 % $ 2009 Change 2008 2008 78,237 $ 35,394 121 % 142,226 122,235 245,444 354,216 697,908 36,638 1,666,668 63,507 48,273 160,986 120,752 252,098 281,420 726,959 27,411 1,658,213 62,748 48,071 205,182 123,523 269,576 174,652 752,524 56,322 1,687,935 72,782 46,838 164,980 134,651 298,760 119,443 536,890 37,237 1,333,264 92,300 45,947 155,664 100,322 302,053 109,834 537,964 15,629 1,260,279 99,525 45,781 (12) 1 (3) 26 (4) 34 1 1 - (9) 22 (19) 223 30 134 32 (36) 5 151,554 121,498 248,753 318,019 712,353 32,050 1,662,464 63,130 48,173 154,764 91,906 312,519 99,796 532,281 7,815 1,234,475 89,168 45,740 (2) 32 (20) 219 34 310 35 (29) 5 $ 12,256 5,218 242,450 2,038,372 $ 11,141 5,443 281,503 2,067,119 $ 14,837 5,586 339,887 2,167,865 $ 11,811 5,512 267,525 1,756,359 $ 9,947 5,823 247,344 1,668,699 10 (4) (14) (1) 23 (10) (2) 22 $ 11,702 5,329 261,868 2,052,666 $ 9,110 6,012 234,743 1,619,248 28 (11) 12 27 $ 672,350 $ 736,460 $ 777,604 $ 589,348 $ 612,305 (9) 10 $ 704,228 $ 606,218 203,348 47,323 111,477 17,990 229,336 1,221,779 315,965 1,537,744 4,549 126,406 130,955 28 11 (12) 49 6 (6) (2) (11) 3 - 43 (21) 86 (19) 20 22 18 22 NM 11 29 1,668,699 (1) 22 289,971 37,371 207,489 14,493 274,323 1,495,997 373,172 1,869,169 28,338 140,865 169,203 $ 226,110 33,694 236,673 9,757 258,732 1,501,426 397,243 1,898,669 31,957 136,493 168,450 2,038,372 $ 203,568 40,486 264,236 9,440 248,125 1,543,459 460,894 2,004,353 24,755 138,757 163,512 2,067,119 $ 200,032 47,579 161,821 11,431 261,385 1,271,596 351,023 1,622,619 7,100 126,640 133,740 2,167,865 $ 1,756,359 $ 258,217 35,543 221,999 12,138 266,571 1,498,696 385,141 1,883,837 30,138 138,691 168,829 $ 16 191,622 47,453 109,515 16,036 214,846 1,185,690 305,790 1,491,480 2,275 125,493 127,768 2,052,666 $ 35 (25) 103 (24) 24 26 26 26 NM 11 32 1,619,248 27 AVERAGE RATES INTEREST-EARNING ASSETS Deposits with banks Federal funds sold and securities purchased under resale agreements (c) Trading assets - debt instruments Securities Loans Other assets (a) Total interest-earning assets INTEREST-BEARING LIABILITIES Interest-bearing deposits Federal funds purchased and securities sold under repurchase agreements Commercial paper Other borrowings and liabilities (b) Beneficial interests issued by consolidated VIEs Long-term debt Total interest-bearing liabilities INTEREST RATE SPREAD NET YIELD ON INTEREST-EARNING ASSETS NET YIELD ON INTEREST-EARNING ASSETS ADJUSTED FOR SECURITIZATIONS 1.45 % 2.03 % 3.34 % 3.04 % 3.87 % 1.78 % 4.03 0.41 4.91 3.64 5.65 0.80 4.00 1.06 5.27 4.16 5.87 2.44 4.41 2.14 6.18 5.14 6.44 3.06 5.12 3.00 6.06 5.09 6.31 3.29 5.22 3.23 5.59 5.27 6.36 3.97 5.34 0.74 5.09 3.87 5.76 1.50 4.20 3.46 5.67 5.36 6.72 3.97 5.60 0.70 0.93 1.53 2.26 2.36 0.82 2.72 0.23 0.24 1.32 1.59 2.60 1.04 0.36 0.47 1.46 1.57 2.73 1.23 0.95 1.17 2.56 3.79 3.87 2.01 2.63 2.05 2.84 2.87 3.31 2.61 2.73 2.17 3.77 2.24 3.27 2.71 0.29 0.35 1.39 1.58 2.67 1.14 3.00 2.79 4.39 2.92 3.52 3.07 2.96% 3.07% 3.18% 3.29% 3.11% 3.28% 2.61% 2.73% 2.63% 2.71% 3.06% 3.18% 2.53% 2.65% 3.37% 3.60% 3.55% 3.06% 3.06% 3.48% % 3.00% (a) Includes margin loans and the Firm's investment in asset-backed commercial paper under the Federal Reserve Bank of Boston's AML facility. (b) Includes securities sold but not yet purchased, brokerage customer payables and advances from Federal Home Loan Banks. (c) Includes securities borrowed. Page 5
  • 7.
    JPMORGAN CHASE &CO. RECONCILIATION FROM REPORTED TO MANAGED SUMMARY (in millions) The Firm prepares its consolidated financial statements using accounting principles generally accepted in the United States of America ("U.S. GAAP"). That presentation, which is referred to as "reported basis," provides the reader with an understanding of the Firm's results that can be tracked consistently from year to year and enables a comparison of the Firm's performance with other companies' U.S. GAAP financial statements. In addition to analyzing the Firm's results on a reported basis, management reviews the Firm's results and the results of lines of business on a "managed" basis, which is a non-GAAP financial measure. The Firm's definition of managed basis starts with the reported U.S. GAAP results and includes certain reclassifications that assume credit card loans securitized by Card Services remain on the balance sheet and presents revenue on a fully taxable-equivalent ("FTE") basis. These adjustments do not have any impact on net income as reported by the lines of business or by the Firm as a whole. The impact of these adjustments are summarized below. For additional information about managed basis, please refer to the Glossary of Terms on page 37. QUARTERLY TRENDS YEAR-TO-DATE 2Q09 Change 2Q09 CREDIT CARD INCOME Credit card income - reported Impact of: Credit card securitizations Credit card income - managed OTHER INCOME Other income - reported Impact of: Tax-equivalent adjustments Other income - managed TOTAL NONINTEREST REVENUE Total noninterest revenue - reported Impact of: Credit card securitizations Tax-equivalent adjustments Total noninterest revenue - managed NET INTEREST INCOME Net interest income - reported Impact of: Credit card securitizations Tax-equivalent adjustments Net interest income - managed TOTAL NET REVENUE Total net revenue - reported Impact of: Credit card securitizations Tax-equivalent adjustments Total net revenue - managed PRE-PROVISION PROFIT Total pre-provision profit - reported Impact of: Credit card securitizations Tax-equivalent adjustments Total pre-provision profit - managed PROVISION FOR CREDIT LOSSES Provision for credit losses - reported Impact of: Credit card securitizations Provision for credit losses - managed INCOME TAX EXPENSE Income tax expense (benefit) - reported Impact of: Tax-equivalent adjustments Income tax expense (benefit) - managed 1Q09 4Q08 3Q08 2Q08 $ 1,719 $ 1,837 $ 2,049 $ 1,771 $ $ (294) 1,425 $ (540) 1,297 $ (710) 1,339 $ (843) 928 $ 1Q09 1,803 2Q08 2009 2008 2009 Change 2008 (6) % (5) % $ 3,556 $ 3,599 (1) % (843) 960 46 10 65 48 $ (834) 2,722 $ (1,780) 1,819 53 50 NM $ 10 $ 50 $ 593 $ (115) $ (138) (80) $ 60 $ 1,691 (96) $ 335 345 $ 337 387 $ 556 1,149 $ 323 208 $ 247 109 (1) (11) 36 217 $ 672 732 $ 450 2,141 49 (66) $ 12,953 $ 11,658 $ 3,394 $ 5,743 $ 10,105 11 28 $ 24,611 $ 19,336 27 $ (294) 335 12,994 $ (540) 337 11,455 $ (710) 556 3,240 $ (843) 323 5,223 $ (843) 247 9,509 46 (1) 13 65 36 37 $ (834) 672 24,449 $ (1,780) 450 18,006 53 49 36 $ 12,670 $ 13,367 $ 13,832 $ 8,994 $ 8,294 (5) 53 $ 26,037 $ 15,953 63 $ 1,958 87 14,715 $ 2,004 96 15,467 $ 1,938 98 15,868 $ 1,716 155 10,865 $ 1,673 202 10,169 (2) (9) (5) 17 (57) 45 $ 3,962 183 30,182 $ 3,291 326 19,570 20 (44) 54 $ 25,623 $ 25,025 $ 17,226 $ 14,737 $ 18,399 2 39 $ 50,648 $ 35,289 44 $ 1,664 422 27,709 $ 1,464 433 26,922 $ 1,228 654 19,108 $ 873 478 16,088 $ 830 449 19,678 14 (3) 3 100 (6) 41 $ 3,128 855 54,631 $ 1,511 776 37,576 107 10 45 $ 12,103 $ 11,652 $ 5,971 $ 3,600 $ 6,222 4 95 $ 23,755 $ 14,181 68 $ 1,664 422 14,189 $ 1,464 433 13,549 $ 1,228 654 7,853 $ 873 478 4,951 $ 830 449 7,501 14 (3) 5 100 (6) 89 $ 3,128 855 27,738 $ 1,511 776 16,468 107 10 68 $ 8,031 $ 8,596 $ 7,313 $ 5,787 $ 3,455 (7) 132 $ 16,627 $ 7,879 111 $ 1,664 9,695 $ 1,464 10,060 $ 1,228 8,541 $ 873 6,660 $ 830 4,285 14 (4) 100 126 $ 3,128 19,755 $ 1,511 9,390 107 110 $ 1,351 $ 915 $ (719) $ (2,133) $ 764 48 77 $ 2,266 $ 1,926 18 $ 422 1,773 $ 433 1,348 $ 654 (65) $ 478 (1,655) $ 449 1,213 (3) 32 (6) 46 $ 855 3,121 $ 776 2,702 10 16 Page 6
  • 8.
    JPMORGAN CHASE &CO. LINE OF BUSINESS FINANCIAL HIGHLIGHTS - MANAGED BASIS (in millions, except ratio data) QUARTERLY TRENDS YEAR-TO-DATE 2Q09 Change 2Q09 TOTAL NET REVENUE (FTE) Investment Bank (a) Retail Financial Services Card Services Commercial Banking Treasury & Securities Services Asset Management Corporate/Private Equity (a) TOTAL NET REVENUE TOTAL PRE-PROVISION PROFIT Investment Bank (a) Retail Financial Services Card Services Commercial Banking Treasury & Securities Services Asset Management Corporate/Private Equity (a) TOTAL PRE-PROVISION PROFIT NET INCOME (LOSS) Investment Bank Retail Financial Services Card Services Commercial Banking Treasury & Securities Services Asset Management Corporate/Private Equity TOTAL NET INCOME AVERAGE EQUITY (b) Investment Bank Retail Financial Services Card Services Commercial Banking Treasury & Securities Services Asset Management Corporate/Private Equity TOTAL AVERAGE EQUITY RETURN ON EQUITY (b) Investment Bank Retail Financial Services Card Services Commercial Banking Treasury & Securities Services Asset Management $ $ $ $ $ $ $ $ 1Q09 7,301 7,970 4,868 1,453 1,900 1,982 2,235 27,709 3,234 3,891 3,535 918 612 628 1,371 14,189 1,471 15 (672) 368 379 352 808 2,721 33,000 25,000 15,000 8,000 5,000 7,000 47,865 140,865 18 % (18) 18 30 20 $ $ $ $ $ $ $ $ 4Q08 8,371 8,835 5,129 1,402 1,821 1,703 (339) 26,922 3,597 4,664 3,783 849 502 405 (251) 13,549 1,606 474 (547) 338 308 224 (262) 2,141 33,000 25,000 15,000 8,000 5,000 7,000 43,493 136,493 20 % 8 (15) 17 25 13 $ $ $ $ $ $ $ $ 3Q08 (272) 8,684 4,908 1,479 2,249 1,658 402 19,108 (3,013) 4,638 3,419 980 910 445 474 7,853 (2,364) 624 (371) 480 533 255 1,545 702 33,000 25,000 15,000 8,000 4,500 7,000 46,257 138,757 (28) % 10 (10) 24 47 14 $ $ $ $ $ $ $ $ 2Q08 4,066 4,963 3,887 1,125 1,953 1,961 (1,867) 16,088 $ $ 250 2,184 2,693 639 614 599 (2,028) 4,951 $ $ 882 64 292 312 406 351 (1,780) 527 $ $ 26,000 17,000 14,100 7,000 3,500 5,500 53,540 126,640 13 1 8 18 46 25 $ $ % 1Q09 5,500 5,110 3,775 1,106 2,019 2,064 104 19,678 2Q08 2009 (13) % (10) (5) 4 4 16 NM 3 33 % 56 29 31 (6) (4) NM 41 $ 766 2,430 2,590 630 702 664 (281) 7,501 (10) (17) (7) 8 22 55 NM 5 322 60 36 46 (13) (5) NM 89 $ 394 503 250 355 425 395 (319) 2,003 (8) (97) (23) 9 23 57 NM 27 273 (97) NM 4 (11) (11) NM 36 10 3 42 47 6 14 43 38 (15) 11 23,319 17,000 14,100 7,000 3,500 5,066 56,421 126,406 7 12 7 20 49 31 % $ $ $ $ $ $ 2009 Change 2008 2008 15,672 16,805 9,997 2,855 3,721 3,685 1,896 54,631 6,831 8,555 7,318 1,767 1,114 1,033 1,120 27,738 3,077 489 (1,219) 706 687 576 546 4,862 33,000 25,000 15,000 8,000 5,000 7,000 45,691 138,691 19 % 4 (16) 18 28 17 $ $ $ $ $ $ $ $ 8,541 9,873 7,679 2,173 3,932 3,965 1,413 37,576 83 % 70 30 31 (5) (7) 34 45 1,254 4,621 5,222 1,212 1,387 1,242 1,530 16,468 445 85 40 46 (20) (17) (27) 68 307 192 859 647 828 751 792 4,376 NM 155 NM 9 (17) (23) (31) 11 22,659 17,000 14,100 7,000 3,500 5,033 56,201 125,493 46 47 6 14 43 39 (19) 11 3 2 12 19 48 30 % (a) In the second quarter of 2009, Investment Bank ("IB") began reporting credit reimbursement from TSS as a component of total net revenue, whereas TSS continues to report its credit reimbursement to IB as a separate line item on its income statement (not part of net revenue). Corporate/Private Equity includes an adjustment to offset IB's inclusion of the credit reimbursement in total net revenue. Prior periods have been revised for IB and Corporate/Private Equity to reflect this presentation. (b) Each business segment is allocated capital by taking into consideration stand-alone peer comparisons, economic risk measures and regulatory capital requirements. The amount of capital assigned to each business is referred to as equity. Page 7
  • 9.
    JPMORGAN CHASE &CO. INVESTMENT BANK FINANCIAL HIGHLIGHTS (in millions, except ratio data) QUARTERLY TRENDS YEAR-TO-DATE 2009 Change 2008 2Q09 Change 2Q09 INCOME STATEMENT REVENUE Investment banking fees Principal transactions Lending & deposit-related fees Asset management, administration and commissions All other income (a) Noninterest revenue Net interest income TOTAL NET REVENUE (b) $ Provision for credit losses REVENUE BY REGION (a) Americas Europe/Middle East/Africa Asia/Pacific Total net revenue $ 1,380 3,515 138 692 (56) 5,669 2,702 8,371 $ 3Q08 1,373 (6,160) 138 764 139 (3,746) 3,474 (272) $ 2Q08 1,593 (922) 118 847 (248) 1,388 2,678 4,066 $ 1Q09 1,735 838 105 709 (196) 3,191 2,309 5,500 2Q08 2009 62 % (48) 21 4 (93) (14) (10) (13) 29 % 120 59 1 45 52 6 33 $ 2008 3,619 5,356 305 1,409 (164) 10,525 5,147 15,672 $ 2,941 40 207 1,453 (232) 4,409 4,132 8,541 23 % NM 47 (3) 29 139 25 83 105 $ 1,210 765 234 398 (28) 119 2,081 1,016 2,677 1,390 4,067 FINANCIAL RATIOS ROE ROA Overhead ratio Compensation expense as a % of total net revenue REVENUE BY BUSINESS Investment banking fees: Advisory Equity underwriting Debt underwriting Total investment banking fees Fixed income markets Equity markets Credit portfolio (a) Total net revenue 2,239 1,841 167 717 (108) 4,856 2,445 7,301 4Q08 871 NONINTEREST EXPENSE Compensation expense Noncompensation expense TOTAL NONINTEREST EXPENSE Income (loss) before income tax expense Income tax expense (benefit) (c) NET INCOME (LOSS) 1Q09 3,330 1,444 4,774 1,166 1,575 2,741 2,162 1,654 3,816 3,132 1,602 4,734 (20) (4) (15) (15) (13) (14) 6,007 2,834 8,841 4,373 2,914 7,287 (1) 14 (8) NM NM 273 2,363 892 1,471 $ 18 % 0.83 56 37 $ $ $ $ 393 1,103 743 2,239 4,929 708 (575) 7,301 4,177 2,235 889 7,301 2,387 781 1,606 $ 20 % 0.89 57 40 $ $ $ $ 479 308 593 1,380 4,889 1,773 329 8,371 4,800 2,595 976 8,371 (3,778) (1,414) (2,364) $ (28) % (1.08) NM NM $ $ $ $ 579 330 464 1,373 (1,671) (94) 120 (272) (2,203) 2,026 (95) (272) 16 (866) 882 $ 13 % 0.39 94 53 $ $ $ $ 576 518 499 1,593 815 1,650 8 4,066 1,072 2,517 477 4,066 368 (26) 394 $ 7 % 0.19 86 57 $ $ $ $ 4,750 1,673 3,077 $ 19 % 0.86 56 38 370 542 823 1,735 2,347 1,079 339 5,500 (18) 258 25 62 1 (60) NM (13) 6 104 (10) 29 110 (34) NM 33 3,185 1,519 796 5,500 (13) (14) (9) (13) 31 47 12 33 $ $ $ $ 872 1,411 1,336 3,619 9,818 2,481 (246) 15,672 8,977 4,830 1,865 15,672 238 (69) 307 37 (3) 21 NM NM NM 3 % 0.08 85 51 $ $ $ $ 853 901 1,187 2,941 2,813 2,055 732 8,541 2 57 13 23 249 21 NM 83 3,741 3,167 1,633 8,541 140 53 14 83 (a) Treasury & Securities Services ("TSS") was charged a credit reimbursement related to certain exposures managed within the Investment Bank credit portfolio on behalf of clients shared with TSS. IB recognizes this credit reimbursement in its credit portfolio business in all other income. Prior periods have been revised to conform with the current presentation. (b) Total net revenue included tax-equivalent adjustments, predominantly due to income tax credits related to affordable housing and alternative energy investments, as well as, tax-exempt income from municipal bond investments, of $334 million, $365 million, $583 million, $427 million, and $404 million, for the quarters ended June 30, 2009, March 31, 2009, December 31, 2008, September 30, 2008, and June 30, 2008, respectively, and $699 million and $693 million for year-to-date 2009 and 2008, respectively. (c) The income tax benefit in the third quarter of 2008 is predominantly the result of reduced deferred tax liabilities on overseas earnings. Page 8
  • 10.
    JPMORGAN CHASE &CO. INVESTMENT BANK FINANCIAL HIGHLIGHTS, CONTINUED (in millions, except headcount and ratio data) QUARTERLY TRENDS YEAR-TO-DATE 2009 Change 2008 2Q09 Change 2Q09 SELECTED BALANCE SHEET DATA (Period-end) Loans: Loans retained (a) Loans held-for-sale & loans at fair value Total loans Equity SELECTED BALANCE SHEET DATA (Average) Total assets Trading assets - debt and equity instruments Trading assets - derivative receivables Loans: Loans retained (a) Loans held-for-sale & loans at fair value Total loans Adjusted assets (b) Equity Net charge-off (recovery) rate (a) (d) Allowance for loan losses to period-end loans (a) (d) Allowance for loan losses to average loans (a) (d) (e) Allowance for loan losses to nonperforming loans (c) Nonperforming loans to period-end loans Nonperforming loans to average loans 4Q08 3Q08 2Q08 1Q09 $ 64,500 6,814 71,314 33,000 $ 66,506 10,993 77,499 33,000 $ 71,357 13,660 85,017 33,000 $ 73,347 16,667 90,014 33,000 $ 70,690 19,699 90,389 26,000 $ 710,825 265,336 100,536 $ 733,166 272,998 125,021 $ 869,159 306,168 153,875 $ 890,040 360,821 105,462 $ 2Q08 2009 2008 (3) % (38) (8) - (9) % (65) (21) 27 $ 64,500 6,814 71,314 33,000 $ 70,690 19,699 90,389 26,000 (9) % (65) (21) 27 814,860 367,184 99,395 (3) (3) (20) (13) (28) 1 $ 721,934 269,146 112,711 $ 785,344 368,320 94,814 (8) (27) 19 68,224 8,934 77,158 531,632 33,000 $ 70,041 12,402 82,443 589,163 33,000 73,110 16,378 89,488 685,242 33,000 69,022 17,612 86,634 694,459 26,000 76,239 20,440 96,679 676,777 23,319 (3) (28) (6) (10) - (11) (56) (20) (21) 42 69,128 10,658 79,786 560,239 33,000 75,173 20,026 95,199 669,598 22,659 (8) (47) (16) (16) 46 25,783 Headcount CREDIT DATA AND QUALITY STATISTICS Net charge-offs (recoveries) Nonperforming assets: Loans (c) Derivative receivables Assets acquired in loan satisfactions Total nonperforming assets Allowance for credit losses: Allowance for loan losses Allowance for lending-related commitments Total allowance for credit losses 1Q09 26,142 27,938 30,993 37,057 (1) (30) 25,783 37,057 (30) NM NM 5 NM 96 (30) 32 49 NM NM 208 NM 3,519 704 311 4,534 313 76 101 490 NM NM 208 NM 9 19 10 110 (25) 88 5,101 351 5,452 2,429 469 2,898 110 (25) 88 433 $ 36 $ 87 $ 13 $ (8) 3,519 704 311 4,534 1,795 1,010 236 3,041 1,175 1,079 247 2,501 436 34 113 583 313 76 101 490 5,101 351 5,452 4,682 295 4,977 3,444 360 3,804 2,654 463 3,117 2,429 469 2,898 2.55 % 7.91 7.48 150 4.93 4.56 0.21 % 7.04 6.68 269 2.32 2.18 0.47 % 4.83 4.71 301 1.38 1.31 0.07 % 3.62 3.85 657 0.48 0.50 (0.04) % 3.44 3.19 843 0.35 0.32 $ 469 $ 1.37 % 7.91 7.38 150 4.93 4.41 0.01 % 3.44 3.23 843 0.35 0.33 (a) Loans retained included credit portfolio loans, leveraged leases and other accrual loans, and excluded loans held-for-sale and loans accounted for at fair value. (b) Adjusted assets, a non-GAAP financial measure, equals total assets minus (1) securities purchased under resale agreements and securities borrowed less securities sold, not yet purchased; (2) assets of variable interest entities ("VIEs") consolidated under FIN 46R; (3) cash and securities segregated and on deposit for regulatory and other purposes; (4) goodwill and intangibles; (5) securities received as collateral; and (6) investments purchased under the Asset-Backed Commercial Paper Money Market Mutual Fund Liquidity Facility. The amount of adjusted assets is presented to assist the reader in comparing the Investment Bank's ("IB") asset and capital levels to other investment banks in the securities industry. Asset-to-equity leverage ratios are commonly used as one measure to assess a company’s capital adequacy. IB believes an adjusted asset amount that excludes the assets discussed above, which were considered to have a low risk profile, provides a more meaningful measure of balance sheet leverage in the securities industry. (c) Nonperforming loans included loans held-for-sale and loans at fair value of $112 million, $57 million, $32 million, $32 million, and $25 million, at June 30, 2009, March 31, 2009, December 31, 2008, September 30, 2008, and June 30, 2008, respectively, which were excluded from the allowance coverage ratios. Nonperforming loans excluded distressed loans held-for-sale that were purchased as part of IB's proprietary activities. (d) Loans held-for-sale and loans at fair value were excluded when calculating the allowance coverage ratio and net charge-off (recovery) rate. (e) Excluding the impact of a loan originated in March 2008 to Bear Stearns, the adjusted ratio would be 3.46% and 3.40% for the quarter ended June 30, 2008, and the six months ended June 30, 2008, respectively. The average balance of the loan extended to Bear Stearns was $6.0 billion and $3.8 billion for the quarter ended June 30, 2008, and the six months ended June 30, 2008, respectively. Page 9
  • 11.
    JPMORGAN CHASE &CO. INVESTMENT BANK FINANCIAL HIGHLIGHTS, CONTINUED (in millions, except ratio and rankings data) QUARTERLY TRENDS YEAR-TO-DATE 2Q09 Change 2Q09 1Q09 MARKET RISK - AVERAGE TRADING AND CREDIT PORTFOLIO VAR - 99% CONFIDENCE LEVEL (a) Trading activities: Fixed income $ Foreign exchange Equities Commodities and other Diversification (b) Total trading VaR (c) 249 26 77 34 (136) 250 Credit portfolio VaR (d) Diversification (b) Total trading and credit portfolio VaR 133 (116) 267 $ $ 4Q08 218 40 162 28 (159) 289 182 (135) 336 $ June 30, 2009 YTD MARKET SHARES AND RANKINGS (e) Global debt, equity and equity-related Global syndicated loans Global long-term debt (f) Global equity and equity-related (g) Global announced M&A (h) U.S. debt, equity and equity-related U.S. syndicated loans U.S. long-term debt (f) U.S. equity and equity-related (g) U.S. announced M&A (h) Market Share 11% 10% 9% 16% 32% 15% 25% 15% 17% 48% Rankings #1 #1 #1 #1 #3 #1 #1 #1 #1 #3 $ $ 3Q08 276 55 87 30 (146) 302 165 (140) 327 $ 2Q08 183 20 80 41 (104) 220 47 (49) 218 $ $ $ 1Q09 2Q08 155 26 30 31 (92) 150 14 % (35) (52) 21 14 (13) 35 (36) 149 (27) 14 (21) 2009 61 % 157 10 (48) 67 280 (222) 79 $ $ 2009 Change 2008 2008 234 33 119 31 (148) 269 157 (125) 301 $ $ 137 30 31 29 (91) 136 33 (34) 135 71 % 10 284 7 (63) 98 376 (268) 123 Full Year 2008 Market Share 10% 12% 9% 10% 27% 15% 25% 15% 11% 33% Rankings #1 #1 #3 #1 #2 #2 #1 #2 #1 #2 (a) Results for second quarter 2008 include one month of the combined Firm's results and two months of heritage JPMorgan Chase & Co. results. (b) Average VaRs were less than the sum of the VaRs of their market risk components, which was due to risk offsets resulting from portfolio diversification. The diversification effect reflected the fact that the risks were not perfectly correlated. The risk of a portfolio of positions is usually less than the sum of the risks of the positions themselves. (c) Trading VaR includes predominantly all trading activities in IB; however, particular risk parameters of certain products are not fully captured, for example, correlation risk. Trading VaR does not include VaR related to held-for-sale funded loans and unfunded commitments, nor the debit valuation adjustments ("DVA") taken on derivative and structured liabilities to reflect the credit quality of the Firm. Trading VaR also does not include the MSR portfolio or VaR related to other corporate functions, such as Corporate/Private Equity. Beginning in the fourth quarter of 2008, trading VaR includes the estimated credit spread sensitivity of certain mortgage products. (d) Included VaR on derivative credit valuation adjustments ("CVA"), hedges of the CVA and mark-to-market hedges of the retained loan portfolio, which are all reported in principal transactions revenue. This VaR does not include the retained loan portfolio. (e) Source: Thomson Reuters. Full year 2008 results are pro forma for the Bear Stearns merger. (f) Includes asset-backed securities, mortgage-backed securities and municipal securities. (g) Includes rights offerings; U.S. domiciled equity and equity-related transactions. (h) Global announced M&A is based upon rank value; all other rankings are based upon proceeds, with full credit to each book manager/equal if joint. Because of joint assignments, market share of all participants will add up to more than 100%. Global and U.S. announced M&A market share and ranking for 2008 include transactions withdrawn since December 31, 2008. U.S. announced M&A represents any U.S. involvement ranking. Page 10
  • 12.
    JPMORGAN CHASE &CO. RETAIL FINANCIAL SERVICES FINANCIAL HIGHLIGHTS (in millions, except ratio and headcount data) QUARTERLY TRENDS YEAR-TO-DATE 2Q09 Change 2Q09 INCOME STATEMENT REVENUE Lending & deposit-related fees Asset management, administration and commissions Mortgage fees and related income Credit card income Other income Noninterest revenue Net interest income TOTAL NET REVENUE $ 1Q09 1,003 425 807 411 294 2,940 5,030 7,970 $ 4Q08 948 435 1,633 367 214 3,597 5,238 8,835 $ 3Q08 1,050 412 1,962 367 183 3,974 4,710 8,684 $ 2Q08 538 346 438 204 206 1,732 3,231 4,963 $ 1Q09 497 375 696 194 198 1,960 3,150 5,110 2Q08 6 % (2) (51) 12 37 (18) (4) (10) 2009 102 % 13 16 112 48 50 60 56 $ 2009 Change 2008 2008 1,951 860 2,440 778 508 6,537 10,268 16,805 $ 958 752 1,221 368 350 3,649 6,224 9,873 104 % 14 100 111 45 79 65 70 Provision for credit losses 3,846 3,877 3,576 2,056 1,585 (1) 143 7,723 4,273 81 NONINTEREST EXPENSE Compensation expense Noncompensation expense Amortization of intangibles TOTAL NONINTEREST EXPENSE 1,631 2,365 83 4,079 1,631 2,457 83 4,171 1,604 2,345 97 4,046 1,120 1,559 100 2,779 1,184 1,396 100 2,680 (4) (2) 38 69 (17) 52 3,262 4,822 166 8,250 2,344 2,708 200 5,252 39 78 (17) 57 845 342 503 (94) (90) (97) (95) (91) (97) Income (loss) before income tax expense Income tax expense (benefit) NET INCOME (LOSS) $ FINANCIAL RATIOS ROE Overhead ratio Overhead ratio excluding core deposit intangibles (a) SELECTED BALANCE SHEET DATA (Period-end) Assets Loans: Loans retained Loans held-for-sale & loans at fair value (b) Total loans Deposits Equity SELECTED BALANCE SHEET DATA (Average) Assets Loans: Loans retained Loans held-for-sale & loans at fair value (b) Total loans Deposits Equity Headcount 45 30 15 $ % 51 50 $ 399,916 410,228 $ 8 % 47 46 $ 353,934 13,192 367,126 371,241 25,000 $ 787 313 474 412,505 423,472 $ 10 % 47 45 $ 364,220 12,529 376,749 380,140 25,000 $ 1,062 438 624 419,831 423,699 $ 1 % 56 54 $ 368,786 9,996 378,782 360,451 25,000 $ 128 64 64 426,435 12 % 52 51 $ 265,367 $ 832 343 489 348 156 192 $ 4 % 49 48 265,845 (3) 50 223,047 16,282 239,329 223,121 17,000 371,153 10,223 381,376 353,660 25,000 $ $ (3) 5 (3) (2) - 59 (19) 53 66 47 267,808 (3) 53 $ 399,916 2 % 53 51 $ 416,813 $ 265,845 50 223,047 16,282 239,329 223,121 17,000 353,934 13,192 367,126 371,241 25,000 $ 139 120 155 59 (19) 53 66 47 263,911 58 359,372 19,043 378,415 377,259 25,000 366,925 16,526 383,451 370,278 25,000 369,172 13,848 383,020 358,523 25,000 222,640 16,037 238,677 222,180 17,000 221,132 20,492 241,624 226,487 17,000 (2) 15 (1) 2 - 63 (7) 57 67 47 363,127 17,792 380,919 373,788 25,000 217,859 19,167 237,026 226,021 17,000 67 (7) 61 65 47 103,733 100,677 102,007 101,826 69,550 3 49 103,733 69,550 49 (a) Retail Financial Services uses the overhead ratio (excluding the amortization of core deposit intangibles ("CDI")), a non-GAAP financial measure, to evaluate the underlying expense trends of the business. Including CDI amortization expense in the overhead ratio calculation results in a higher overhead ratio in the earlier years and a lower overhead ratio in later years; this method would result in an improving overhead ratio over time, all things remaining equal. This non-GAAP ratio excludes Retail Banking's core deposit intangibles amortization expense related to the 2006 Bank of New York transaction and the 2004 Bank One merger of $82 million, $83 million, $97 million, $99 million, and $99 million for the quarters ending June 30, 2009, March 31, 2009, December 31, 2008, September 30, 2008, and June 30, 2008, respectively, and $165 million and $198 million for year-to-date 2009 and 2008, respectively. (b) Loans at fair value consist of prime mortgages originated with the intent to sell that are accounted for at fair value and classified as trading assets on the Consolidated Balance Sheets. These loans totaled $11.3 billion, $8.9 billion, $8.0 billion, $8.6 billion, and $14.1 billion at June 30, 2009, March 31, 2009, December 31, 2008, September 30, 2008, and June 30, 2008, respectively. Average balances of these loans totaled $16.2 billion, $13.4 billion, $12.0 billion, $14.5 billion, and $16.9 billion for the quarters ended June 30, 2009, March 31, 2009, December 31, 2008, September 30, 2008, and June 30, 2008, respectively, and $14.9 billion and $15.2 billion for year-to-date 2009 and 2008, respectively. Page 11
  • 13.
    JPMORGAN CHASE &CO. RETAIL FINANCIAL SERVICES FINANCIAL HIGHLIGHTS, CONTINUED (in millions, except ratio data) QUARTERLY TRENDS YEAR-TO-DATE 2Q09 Change 2Q09 CREDIT DATA AND QUALITY STATISTICS Net charge-offs Nonperforming loans (a) (b) (c) Nonperforming assets (a) (b) (c) Allowance for loan losses Net charge-off rate (d) Net charge-off rate excluding purchased credit-impaired loans (d) (e) Allowance for loan losses to ending loans (d) Allowance for loan losses to ending loans excluding purchased credit-impaired loans (d) (e) Allowance for loan losses to nonperforming loans (a) (d) Nonperforming loans to total loans Nonperforming loans to total loans excluding purchased credit-impaired loans (a) $ 1Q09 2,649 8,995 10,554 11,832 2.96 % 3.89 3.34 4.41 135 2.45 3.19 $ 4Q08 2,176 7,978 9,846 10,619 2.41 % 3.16 2.92 3.84 138 2.12 2.76 $ 3Q08 1,701 6,784 9,077 8,918 1.83 % 2.41 2.42 3.19 136 1.79 2.34 $ 2Q08 1,326 5,724 8,085 7,517 2.37 % 2.37 2.03 2.56 136 1.50 1.88 $ 1Q09 1,025 4,574 5,333 5,062 1.86 % 1.86 2.27 2.27 115 1.91 1.91 2Q08 22 % 13 7 11 2009 158 % 97 98 134 $ 2009 Change 2008 2008 4,825 8,995 10,554 11,832 2.68 % 3.53 3.34 4.41 135 2.45 3.19 $ 1,850 4,574 5,333 5,062 161 % 97 98 134 1.71 % 1.71 2.27 2.27 115 1.91 1.91 (a) Excludes purchased credit-impaired loans accounted for under SOP 03-3 that were acquired as part of the Washington Mutual transaction. These loans are accounted for on a pool basis and the pools are considered to be performing under SOP 03-3. (b) Nonperforming loans and assets included loans held-for-sale and loans accounted for at fair value of $203 million, $264 million, $236 million, $207 million, and $180 million at June 30, 2009, March 31, 2009, December 31, 2008, September 30, 2008, and June 30, 2008, respectively. Certain of these loans are classified as trading assets on the Consolidated Balance Sheets. (c) Nonperforming loans and assets excluded: (1) loans eligible for repurchase, as well as loans repurchased from Government National Mortgage Association ("GNMA") pools that are insured by U.S. government agencies, of $4.7 billion, $4.6 billion, $3.3 billion, $1.8 billion, and $1.9 billion at June 30, 2009, March 31, 2009, December 31, 2008, September 30, 2008, and June 30, 2008, respectively; and (2) student loans that are 90 days past due and still accruing, which are insured by U.S. government agencies under the Federal Family Education Loan Program, of $473 million, $433 million, $437 million, $405 million, and $394 million at June 30, 2009, March 31, 2009, December 31, 2008, September 30, 2008, and June 30, 2008, respectively. These amounts for GNMA and student loans are excluded, as reimbursement is proceeding normally. (d) Loans held-for-sale and loans accounted for at fair value were excluded when calculating the allowance coverage ratio and the net charge-off rate. (e) Excludes the impact of purchased credit-impaired loans accounted for under SOP 03-3 that were acquired as part of the Washington Mutual transaction. These loans were accounted for at fair value on the acquisition date, which incorporated management's estimate, as of that date, of credit losses over the remaining life of the portfolio. No allowance for loan losses has been recorded for these loans as of June 30, 2009, March 31, 2009, December 31, 2008, and September 30, 2008, respectively. Page 12
  • 14.
    JPMORGAN CHASE &CO. RETAIL FINANCIAL SERVICES FINANCIAL HIGHLIGHTS, CONTINUED (in millions, except ratio data and where otherwise noted) QUARTERLY TRENDS YEAR-TO-DATE 2Q09 Change 2Q09 1Q09 4Q08 3Q08 2Q08 1Q09 2Q08 2009 2009 Change 2008 2008 RETAIL BANKING Noninterest revenue Net interest income Total net revenue Provision for credit losses Noninterest expense Income before income tax expense Net income $ $ Overhead ratio Overhead ratio excluding core deposit intangibles (a) BUSINESS METRICS (in billions) Business banking origination volume End-of-period loans owned End-of-period deposits: Checking Savings Time and other Total end-of-period deposits Average loans owned Average deposits: Checking Savings Time and other Total average deposits Deposit margin Average assets CREDIT DATA AND QUALITY STATISTICS Net charge-offs Net charge-off rate Nonperforming assets 1,803 2,719 4,522 361 2,557 1,604 970 $ $ 57 % 55 1,718 2,614 4,332 325 2,580 1,427 863 $ $ 60 % 58 1,834 2,687 4,521 268 2,533 1,720 1,040 $ $ 56 % 54 1,089 1,756 2,845 70 1,580 1,195 723 $ $ 56 % 52 1,062 1,671 2,733 62 1,557 1,114 674 5 % 4 4 11 (1) 12 12 70 % 63 65 482 64 44 44 $ $ 57 % 53 3,521 5,333 8,854 686 5,137 3,031 1,833 $ $ 58 % 56 2,028 3,216 5,244 111 3,119 2,014 1,219 74 % 66 69 NM 65 50 50 59 % 56 $ 0.6 17.8 $ 0.5 18.2 $ 0.8 18.4 $ 1.2 18.6 $ 1.7 16.5 20 (2) (65) 8 $ 1.1 17.8 $ 3.5 16.5 (69) 8 $ 114.1 150.4 78.9 343.4 18.0 $ 113.9 152.4 86.5 352.8 18.4 $ 109.2 144.0 89.1 342.3 18.2 $ 106.7 146.4 85.8 338.9 16.6 $ 69.1 105.8 37.0 211.9 16.2 (1) (9) (3) (2) 65 42 113 62 11 $ 114.1 150.4 78.9 343.4 18.2 $ 69.1 105.8 37.0 211.9 16.0 65 42 113 62 14 $ $ $ $ $ $ $ $ $ $ 114.2 $ 151.2 82.7 348.1 2.92 % 29.1 $ 109.4 $ 148.2 88.2 345.8 2.85 % 30.2 $ 105.8 $ 145.3 88.7 339.8 2.94 % 28.7 $ 68.0 $ 105.4 36.7 210.1 3.06 % 25.6 $ 68.4 105.9 39.6 213.9 2.88 % 25.7 4 2 (6) 1 67 43 109 63 $ (4) 13 $ 211 $ 4.70 % 686 $ 175 $ 3.86 % 579 $ 168 $ 3.67 % 424 $ 68 $ 1.63 % 380 $ 61 1.51 % 337 21 246 $ 18 104 $ 20 2 $ $ 111.8 $ 149.6 85.6 347.0 2.89 % 29.6 $ 67.3 103.1 43.6 214.0 2.76 % 25.5 66 45 96 62 386 $ 4.28 % 686 $ 110 1.38 % 337 251 16 104 RETAIL BRANCH BUSINESS METRICS Investment sales volume Number of: Branches ATMs Personal bankers Sales specialists Active online customers (in thousands) Checking accounts (in thousands) $ 5,292 5,203 14,144 15,959 5,485 13,930 25,252 $ 4,398 5,186 14,159 15,544 5,454 12,882 24,984 $ 3,956 5,474 14,568 15,825 5,661 11,710 24,499 $ 4,389 5,423 14,389 15,491 5,899 11,682 24,490 $ 5,211 3,157 9,310 9,995 4,116 7,180 11,336 3 1 8 1 65 52 60 33 94 123 9,690 $ 5,203 14,144 15,959 5,485 13,930 25,252 9,295 4 3,157 9,310 9,995 4,116 7,180 11,336 65 52 60 33 94 123 (a) Retail Banking uses the overhead ratio (excluding the amortization of core deposit intangibles ("CDI")), a non-GAAP financial measure, to evaluate the underlying expense trends of the business. Including CDI amortization expense in the overhead ratio calculation results in a higher overhead ratio in the earlier years and a lower overhead ratio in later years; this method would result in an improving overhead ratio over time, all things remaining equal. This non-GAAP ratio excludes Retail Banking's core deposit intangibles amortization expense related to the 2006 Bank of New York transaction and the 2004 Bank One merger of $82 million, $83 million, $97 million, $99 million, and $99 million for the quarters ending June 30, 2009, March 31, 2009, December 31, 2008, September 30, 2008, and June 30, 2008, respectively, and $165 million and $198 million for year-to-date 2009 and 2008, respectively. Page 13
  • 15.
    JPMORGAN CHASE &CO. RETAIL FINANCIAL SERVICES FINANCIAL HIGHLIGHTS, CONTINUED (in millions, except ratio data and where otherwise noted) QUARTERLY TRENDS YEAR-TO-DATE 2009 Change 2008 2Q09 Change 2Q09 1Q09 4Q08 3Q08 2Q08 1Q09 2Q08 2009 2008 CONSUMER LENDING Noninterest revenue Net interest income Total net revenue Provision for credit losses Noninterest expense Income (loss) before income tax expense Net income (loss) $ $ Overhead ratio BUSINESS METRICS (in billions) LOANS EXCLUDING PURCHASED CREDIT-IMPAIRED LOANS (a) End-of-period loans owned: Home equity Prime mortgage Subprime mortgage Option ARMs Student loans Auto loans Other Total end-of-period loans Average loans owned: Home equity Prime mortgage Subprime mortgage Option ARMs Student loans Auto loans Other Total average loans PURCHASED CREDIT-IMPAIRED LOANS (a) End-of-period loans owned: Home equity Prime mortgage Subprime mortgage Option ARMs Total end-of-period loans Average loans owned: Home equity Prime mortgage Subprime mortgage Option ARMs Total average loans TOTAL CONSUMER LENDING PORTFOLIO End-of-period loans owned: Home equity Prime mortgage Subprime mortgage Option ARMs Student loans Auto loans Other Total end-of-period loans Average loans owned: Home equity Prime mortgage Subprime mortgage Option ARMs Student loans Auto loans Other Total average loans owned (b) 1,137 2,311 3,448 3,485 1,522 (1,559) (955) $ $ 44 % 1,879 2,624 4,503 3,552 1,591 (640) (389) $ $ 35 % 2,140 2,023 4,163 3,308 1,513 (658) (416) $ $ 36 % 643 1,475 2,118 1,986 1,199 (1,067) (659) $ $ 57 % 898 1,479 2,377 1,523 1,123 (269) (171) (39) % (12) (23) (2) (4) (144) (146) 27 % 56 45 129 36 (480) (458) $ $ 47 % 3,016 4,935 7,951 7,037 3,113 (2,199) (1,344) $ $ 39 % 1,621 3,008 4,629 4,162 2,133 (1,666) (1,027) 86 % 64 72 69 46 (32) (31) 46 % $ 108.2 62.1 13.8 9.0 15.6 42.9 1.0 252.6 $ 111.7 65.4 14.6 9.0 17.3 43.1 1.0 262.1 $ 114.3 65.2 15.3 9.0 15.9 42.6 1.3 263.6 $ 116.8 63.0 18.1 19.0 15.3 43.3 1.0 276.5 $ 95.1 40.1 14.8 13.0 44.9 0.9 208.8 (3) (5) (5) (10) (4) 14 55 (7) NM 20 (4) 11 21 $ 108.2 62.1 13.8 9.0 15.6 42.9 1.0 252.6 $ 95.1 40.1 14.8 13.0 44.9 0.9 208.8 14 55 (7) NM 20 (4) 11 21 $ 110.1 63.3 14.3 9.1 16.7 43.1 1.0 257.6 $ 113.4 65.4 14.9 8.8 17.0 42.5 1.5 263.5 $ 114.6 65.0 15.7 9.0 15.6 42.9 1.5 264.3 $ 94.8 39.7 14.2 14.1 43.9 0.9 207.6 $ 95.1 39.3 15.5 12.7 44.9 1.0 208.5 (3) (3) (4) 3 (2) 1 (33) (2) 16 61 (8) NM 31 (4) 24 $ 111.7 64.4 14.6 9.0 16.8 42.8 1.3 260.6 $ 95.0 37.7 15.6 12.4 44.1 1.1 205.9 18 71 (6) NM 35 (3) 18 27 $ 27.7 20.8 6.4 30.5 85.4 $ 28.4 21.4 6.6 31.2 87.6 $ 28.6 21.8 6.8 31.6 88.8 $ 26.5 24.7 3.9 22.6 77.7 $ - (2) (3) (3) (2) (3) NM NM NM NM NM $ 27.7 20.8 6.4 30.5 85.4 $ - NM NM NM NM NM $ 28.0 21.0 6.5 31.0 86.5 $ 28.4 21.6 6.7 31.4 88.1 $ 28.2 21.9 6.8 31.6 88.5 $ - $ - (1) (3) (3) (1) (2) NM NM NM NM NM $ 28.2 21.3 6.6 31.2 87.3 $ - NM NM NM NM NM $ 135.9 82.9 20.2 39.5 15.6 42.9 1.0 338.0 $ 140.1 86.8 21.2 40.2 17.3 43.1 1.0 349.7 $ 142.9 87.0 22.1 40.6 15.9 42.6 1.3 352.4 $ 143.3 87.7 22.0 41.6 15.3 43.3 1.0 354.2 $ 95.1 40.1 14.8 13.0 44.9 0.9 208.8 (3) (4) (5) (2) (10) (3) 43 107 36 NM 20 (4) 11 62 $ 135.9 82.9 20.2 39.5 15.6 42.9 1.0 338.0 $ 95.1 40.1 14.8 13.0 44.9 0.9 208.8 43 107 36 NM 20 (4) 11 62 $ 138.1 84.3 20.8 40.1 16.7 43.1 1.0 344.1 $ 141.8 87.0 21.6 40.2 17.0 42.5 1.5 351.6 $ 142.8 86.9 22.5 40.6 15.6 42.9 1.5 352.8 $ 94.8 39.7 14.2 14.1 43.9 0.9 207.6 $ 95.1 39.3 15.5 12.7 44.9 1.0 208.5 (3) (3) (4) (2) 1 (33) (2) 45 115 34 NM 31 (4) 65 $ 139.9 85.7 21.2 40.2 16.8 42.8 1.3 347.9 $ 95.0 37.7 15.6 12.4 44.1 1.1 205.9 47 127 36 NM 35 (3) 18 69 (a) Purchased credit-impaired loans accounted for under SOP 03-3 represent loans acquired in the Washington Mutual transaction for which a deterioration in credit quality occurred between the origination date and JPMorgan Chase's acquisition date. Under SOP 03-3, these loans were initially recorded at fair value and accrete interest income over the estimated life of the loan when cash flows are reasonably estimable, even if the underlying loans are contractually past due. (b) Total average loans include loans held-for-sale of $2.8 billion, $3.1 billion, $1.8 billion, $1.5 billion, and $3.6 billion for the quarters ended June 30, 2009, March 31, 2009, December 31, 2008, September 30, 2008, and June 30, 2008, respectively, and $2.9 billion and $4.0 billion for year-to-date 2009 and 2008, respectively. Page 14
  • 16.
    JPMORGAN CHASE &CO. RETAIL FINANCIAL SERVICES FINANCIAL HIGHLIGHTS, CONTINUED (in millions, except ratio data and where otherwise noted) QUARTERLY TRENDS YEAR-TO-DATE 2Q09 Change 2Q09 1Q09 4Q08 3Q08 2Q08 1Q09 2Q08 2009 2009 Change 2008 2008 CONSUMER LENDING (continued) CREDIT DATA AND QUALITY STATISTICS Net charge-offs excluding purchased credit-impaired loans: (a) Home equity Prime mortgage Subprime mortgage Option ARMs Auto loans Other Total net charge-offs Net charge-off rate excluding purchased credit-impaired loans: (a) Home equity Prime mortgage Subprime mortgage Option ARMs Auto loans Other Total net charge-off rate excluding purchased credit-impaired loans (b) Net charge-off rate - reported: Home equity Prime mortgage Subprime mortgage Option ARMs Auto loans Other Total net charge-off rate - reported (b) 30+ day delinquency rate excluding purchased credit-impaired loans (c) (d) (e) Nonperforming assets (f) (g) Allowance for loan losses to ending loans Allowance for loan losses to ending loans excluding purchased credit-impaired loans (a) $ 1,265 481 410 15 146 121 2,438 $ 4.61 % 3.07 11.50 0.66 1.36 3.15 3.84 3.67 2.30 7.91 0.15 1.36 3.15 2.87 $ 5.22 9,868 $ 3.23 % 4.34 1,098 312 364 4 174 49 2,001 $ 770 195 319 207 42 1,533 $ 663 177 273 124 21 1,258 $ 511 104 192 119 38 964 3.93 % 1.95 9.91 0.18 1.66 1.25 3.12 2.67 % 1.20 8.08 1.92 1.08 2.32 2.78 % 1.79 7.65 1.12 0.60 2.43 2.15 0.89 5.64 1.92 1.08 1.74 2.78 1.79 7.65 1.12 0.60 2.43 148 % 363 114 NM 23 218 153 $ 2.16 % 1.08 4.98 1.07 1.44 1.89 3.14 1.46 6.83 0.04 1.66 1.25 2.33 15 % 54 13 275 (16) 147 22 2.16 1.08 4.98 1.07 1.44 1.89 4.73 9,267 $ 2.83 % 3.79 4.21 8,653 $ 2.36 % 3.16 3.16 7,705 $ 1.95 % 2.50 3.88 4,996 2.33 % 2.33 2,363 793 774 19 320 170 4,439 $ 4.27 % 2.50 10.69 0.43 1.51 2.18 3.47 3.41 1.88 7.36 0.10 1.51 2.18 2.59 6 98 $ 5.22 9,868 $ 3.23 % 4.34 958 154 341 237 50 1,740 147 % 415 127 NM 35 240 155 2.03 % 0.83 4.40 1.08 1.01 1.73 2.03 0.83 4.40 1.08 1.01 1.73 3.88 4,996 2.33 % 2.33 98 (a) Excludes the impact of purchased credit-impaired loans accounted for under SOP 03-3 that were acquired as part of the Washington Mutual transaction. These loans were accounted for at fair value on the acquisition date, which incorporated management's estimate, as of that date, of credit losses over the remaining life of the portfolio. No allowance for loan losses and no charge-offs have been recorded for these loans as of June 30, 2009, March 31, 2009, December 31, 2008, and September 30, 2008, respectively. (b) Average loans held-for-sale of $2.8 billion, $3.1 billion, $1.8 billion, $1.5 billion, and $3.6 billion for the quarters ended June 30, 2009, March 31, 2009, December 31, 2008, September 30, 2008, and June 30, 2008, respectively, and $2.9 billion and $4.0 billion for year-to-date 2009 and 2008, respectively, were excluded when calculating the net charge-off rate. (c) Excluded loans eligible for repurchase, as well as loans repurchased from GNMA pools that are insured by U.S. government agencies, of $4.6 billion, $4.5 billion, $3.2 billion, $2.0 billion, and $1.5 billion at June 30, 2009, March 31, 2009, December 31, 2008, September 30, 2008, and June 30, 2008, respectively. These amounts are excluded, as reimbursement is proceeding normally. (d) Excluded loans that are 30 days past due and still accruing, which are insured by U.S. government agencies under the Federal Family Education Loan Program, of $854 million, $770 million, $824 million, $787 million, and $735 million at June 30, 2009, March 31, 2009, December 31, 2008, September 30, 2008, and June 30, 2008, respectively. These amounts are excluded as reimbursement is proceeding normally. (e) The delinquency rate for purchased credit-impaired loans accounted for under SOP 03-3 was 23.37%, 21.36%, 17.89%, and 13.21% at June 30, 2009, March 31, 2009, December 31, 2008, and September 30, 2008, respectively. There were no purchased credit-impaired loans at June 30, 2008. (f) Nonperforming assets excluded: (1) loans eligible for repurchase, as well as loans repurchased from Governmental National Mortgage Association ("GNMA") pools that are insured by U.S. government agencies, of $4.7 billion, $4.6 billion, $3.3 billion, $1.8 billion, and $1.9 billion at June 30, 2009, March 31, 2009, December 31, 2008, September 30, 2008, and June 30, 2008, respectively; and (2) student loans that are 90 days past due and still accruing, which are insured by U.S. government agencies under the Federal Family Education Loan Program, of $473 million, $433 million, $437 million, $405 million, and $394 million at June 30, 2009, March 31, 2009, December 31, 2008, September 30, 2008, and June 30, 2008, respectively. These amounts for GNMA and student loans are excluded, as reimbursement is proceeding normally. (g) Excludes purchased credit-impaired loans accounted for under SOP 03-3 that were acquired as part of the Washington Mutual transaction. These loans are accounted for on a pool basis and the pools are considered to be performing under SOP 03-3. Page 15
  • 17.
    JPMORGAN CHASE &CO. RETAIL FINANCIAL SERVICES FINANCIAL HIGHLIGHTS, CONTINUED (in billions, except where otherwise noted) QUARTERLY TRENDS YEAR-TO-DATE 2009 Change 2008 2Q09 Change 2Q09 1Q09 4Q08 3Q08 2Q08 1Q09 2Q08 2009 2008 CONSUMER LENDING (continued) Origination volume: Mortgage origination volume by channel Retail Wholesale Correspondent CNT (negotiated transactions) Total mortgage origination volume Home equity Student loans Auto loans $ Average mortgage loans held-for-sale & loans at fair value (a) Average assets Third-party mortgage loans serviced (ending) MSR net carrying value (ending) SUPPLEMENTAL MORTGAGE FEES AND RELATED INCOME DETAILS (in millions) Production revenue Net mortgage servicing revenue: Loan servicing revenue Changes in MSR asset fair value: Due to inputs or assumptions in model Other changes in fair value Total changes in MSR asset fair value Derivative valuation adjustments and other Total net mortgage servicing revenue Mortgage fees and related income 14.7 2.4 20.2 3.8 41.1 0.6 0.4 5.3 $ 16.7 381.1 1,117.5 14.6 $ 284 13.6 2.6 17.0 4.5 37.7 0.9 1.7 5.6 $ 14.0 393.3 1,148.8 10.6 $ 481 7.6 3.8 13.3 3.4 28.1 1.7 1.0 2.8 $ 12.2 395.0 1,172.6 9.3 $ 62 1,279 1,222 1,366 3,831 (837) 2,994 1,310 (1,073) 237 (6,950) (843) (7,793) (3,750) 523 807 (307) 1,152 1,633 8,327 1,900 1,962 8.4 5.9 13.2 10.2 37.7 2.6 2.6 3.8 $ 14.9 239.8 1,114.8 16.4 $ 66 654 (786) (390) (1,176) 894 372 438 12.5 9.1 17.0 17.5 56.1 5.3 1.3 5.6 8 % (8) 19 (16) 9 (33) (76) (5) 18 % (74) 19 (78) (27) (89) (69) (5) $ 28.3 5.0 37.2 8.3 78.8 1.5 2.1 10.9 17.4 242.1 659.1 10.9 $ 19 (3) (3) 38 (4) 57 70 34 394 (41) (28) 645 5 98 2,501 $ 15.3 387.2 1,117.5 14.6 $ 765 25.1 19.7 29.0 29.4 103.2 12.0 3.3 12.8 13 % (75) 28 (72) (24) (88) (36) (15) 15.6 238.4 659.1 10.9 (2) 62 70 34 770 (1) $ 1,238 102 1,519 (394) 1,125 192 22 NM 152 (112) 166 5,141 (1,910) 3,231 887 (819) 68 480 (133) NM (1,468) 302 696 NM (55) (51) (155) 73 16 (4,057) 1,675 2,440 (855) 451 1,221 (375) 271 100 (a) Loans at fair value consist of prime mortgages originated with the intent to sell that are accounted for at fair value and classified as trading assets on the Consolidated Balance Sheets. Average balances of these loans totaled $16.2 billion, $13.4 billion, $12.0 billion, $14.5 billion, and $16.9 billion for the quarters ended June 30, 2009, March 31, 2009, December 31, 2008, September 30, 2008, and June 30, 2008, respectively, and $14.9 billion and $15.2 billion for year-to-date 2009 and 2008, respectively. Page 16
  • 18.
    JPMORGAN CHASE &CO. CARD SERVICES - MANAGED BASIS FINANCIAL HIGHLIGHTS (in millions, except ratio data and where otherwise noted) QUARTERLY TRENDS YEAR-TO-DATE 2Q09 Change 2Q09 INCOME STATEMENT REVENUE Credit card income All other income Noninterest revenue Net interest income TOTAL NET REVENUE $ 1Q09 921 (364) 557 4,311 4,868 $ 4Q08 844 (197) 647 4,482 5,129 $ 3Q08 862 (272) 590 4,318 4,908 $ 2Q08 633 13 646 3,241 3,887 $ 1Q09 673 91 764 3,011 3,775 2Q08 9 % (85) (14) (4) (5) 2009 37 % NM (27) 43 29 $ 2009 Change 2008 2008 1,765 (561) 1,204 8,793 9,997 $ 1,273 210 1,483 6,196 7,679 39 % NM (19) 42 30 Provision for credit losses 4,603 4,653 3,966 2,229 2,194 (1) 110 9,256 3,864 140 NONINTEREST EXPENSE Compensation expense Noncompensation expense Amortization of intangibles TOTAL NONINTEREST EXPENSE 329 873 131 1,333 357 850 139 1,346 335 979 175 1,489 267 773 154 1,194 258 763 164 1,185 (8) 3 (6) (1) 28 14 (20) 12 686 1,723 270 2,679 525 1,604 328 2,457 31 7 (18) 9 $ 396 146 250 (23) (23) (23) NM NM NM $ (1,938) (719) (1,219) $ 1,358 499 859 NM NM NM $ 36 (49) NM $ (448) $ 106 NM Income (loss) before income tax expense Income tax expense (benefit) NET INCOME (LOSS) Memo: Net securitization income (loss) $ (1,068) (396) (672) $ (268) FINANCIAL METRICS ROE Overhead ratio % of average managed outstandings: Net interest income Provision for credit losses Noninterest revenue Risk adjusted margin (a) Noninterest expense Pretax income (loss) (ROO) (b) Net income (loss) BUSINESS METRICS Charge volume (in billions) Net accounts opened (in millions) (c) Credit cards issued (in millions) Number of registered internet customers (in millions) Merchant acquiring business (d) Bank card volume (in billions) Total transactions (in billions) (a) (b) (c) (d) $ (870) (323) (547) $ (180) (18) % 27 $ (547) (176) (371) $ 464 172 292 $ (261) $ (28) (15) % 26 9.93 10.60 1.28 0.61 3.07 (2.46) (1.55) (10) % 30 9.91 10.29 1.43 1.05 2.98 (1.92) (1.21) 8 % 31 9.17 8.42 1.25 2.00 3.16 (1.16) (0.79) 7 % 31 8.18 5.63 1.63 4.19 3.01 1.17 0.74 (16) % 27 7.92 5.77 2.01 4.16 3.12 1.04 0.66 12 % 32 9.92 10.44 1.36 0.84 3.02 (2.19) (1.38) 8.13 5.07 1.95 5.01 3.23 1.78 1.13 $ 82.8 2.4 151.9 30.5 $ 76.0 2.2 159.0 33.8 $ 96.0 4.3 168.7 35.6 $ 93.9 16.6 171.9 34.3 $ 93.6 3.6 157.6 28.0 9 9 (4) (10) (12) (33) (4) 9 $ 158.8 4.6 151.9 30.5 $ 179.0 7.0 157.6 28.0 (11) (34) (4) 9 $ 101.4 4.5 $ 94.4 4.1 $ 135.1 4.9 $ 197.1 5.7 $ 199.3 5.6 7 10 (49) (20) $ 195.8 8.6 $ 381.7 10.8 (49) (20) Represents total net revenue less provision for credit losses. Pretax return on average managed outstandings. Third quarter of 2008 included approximately 13 million credit card accounts acquired by JPMorgan Chase in the Washington Mutual transaction. The Chase Paymentech Solutions joint venture was dissolved effective November 1, 2008. JPMorgan Chase retained approximately 51% of the business and operates the business under the name Chase Paymentech Solutions. For the period January 1, 2008, through October 31, 2008, the data presented represents activity for the Chase Paymentech Solutions joint venture and beyond that date, the data presented represents activity for Chase Paymentech Solutions. Page 17
  • 19.
    JPMORGAN CHASE &CO. CARD SERVICES - MANAGED BASIS FINANCIAL HIGHLIGHTS, CONTINUED (in millions, except headcount and ratio data) QUARTERLY TRENDS YEAR-TO-DATE 2Q09 Change 2Q09 1Q09 4Q08 3Q08 2Q08 1Q09 2Q08 2009 SELECTED BALANCE SHEET DATA (Period-end) Loans: Loans on balance sheets Securitized loans Managed loans $ 85,736 85,790 171,526 $ $ 92,881 93,664 186,545 $ $ 104,746 85,571 190,317 $ $ 90,911 85,220 176,131 $ $ $ 76,278 79,120 155,398 (6) % 1 (3) Equity $ 15,000 $ 15,000 $ 15,000 $ 15,000 $ 14,100 - $ 193,310 $ 201,200 $ 203,943 $ 169,413 $ 161,601 $ $ $ 79,183 78,371 157,554 $ $ 98,790 88,505 187,295 $ $ 97,783 85,619 183,402 $ $ 89,692 84,417 174,109 $ 75,630 77,195 152,825 $ 15,000 $ 15,000 $ 15,000 $ 14,100 $ 14,100 19,570 25 130 SELECTED BALANCE SHEET DATA (Average) Managed assets Loans: Loans on balance sheets Securitized loans Managed average loans Equity Headcount MANAGED CREDIT QUALITY STATISTICS Net charge-offs Net charge-off rate (a) 22,897 $ Managed delinquency rates 30+ day (a) 90+ day (a) Allowance for loan losses (b) Allowance for loan losses to period-end loans (b) (c) KEY STATS - WASHINGTON MUTUAL ONLY (d) Managed loans Managed average loans Net interest income (e) Risk adjusted margin (e) (f) Net charge-off rate (g) 30+ day delinquency rate (g) 90+ day delinquency rate (g) KEY STATS - EXCLUDING WASHINGTON MUTUAL Managed loans Managed average loans Net interest income (e) Risk adjusted margin (e) (f) Net charge-off rate 30+ day delinquency rate 90+ day delinquency rate 4,353 $ 10.03 % 5.86 % 3.25 23,759 3,493 $ 7.72 % 6.16 % 3.22 24,025 2,616 $ 5.56 % 4.97 % 2.34 $ 8,839 $ 10.31 % 8,849 $ 9.73 % 7,692 $ 7.34 % $ 23,093 $ 24,418 17.90 % (3.89) 19.17 11.98 6.85 25,908 $ 27,578 16.45 % 4.42 14.57 10.89 5.79 28,250 $ 27,703 14.87 % 4.18 12.09 9.14 4.39 148,433 $ 149,691 8.63 % 1.34 8.97 5.27 2.90 150,223 $ 155,824 8.75 % 0.46 6.86 5.34 2.78 162,067 $ 159,592 8.18 % 1.62 5.29 4.36 2.09 $ 22,283 1,979 $ 5.00 % 3.91 % 1.77 5,946 $ 6.40 % 1,894 4.98 % 12 % 8 10 $ 85,736 85,790 171,526 $ $ $ 76,278 79,120 155,398 6 $ 15,000 $ 14,100 6 (4) 20 $ 197,234 $ 160,601 23 (8) (1) (5) 19 9 14 $ $ $ 93,715 85,015 178,730 $ 77,537 75,652 153,189 21 12 17 - 6 $ 15,000 $ 14,100 6 (4) 17 19,570 17 22,897 $ 3.46 % 1.76 3,705 4.86 % 27,235 - 139 $ (11) (11) 155,398 152,825 7.92 % 4.16 4.98 3.46 1.76 7,846 $ 8.85 % 5.86 % 3.25 NM NM $ (1) (4) (4) (2) $ 7.53 % 3.51 159,310 $ 157,554 8.18 % 4.19 5.00 3.69 1.74 2009 Change 2008 2008 8,839 $ 10.31 % 3,564 4.68 % 12 % 8 10 120 3.46 % 1.76 3,705 4.86 % 139 23,093 25,990 17.14 % 0.49 16.75 11.98 6.85 148,433 $ 152,740 8.69 % 0.89 7.90 5.27 2.90 NM NM 155,398 153,189 8.13 % 5.01 4.68 3.46 1.76 (4) - (a) Results for the quarters ended June 30, 2009, March 31, 2009, December 31, 2008, and September 30, 2008, reflect the impact of purchase accounting adjustments related to the Washington Mutual transaction and the consolidation of the Washington Mutual Master Trust. (b) Based on loans on balance sheets. (c) Includes loans from the Washington Mutual Master Trust, which were consolidated onto the Card Services balance sheet at fair value during the second quarter of 2009. No allowance for loan losses was recorded for these loans as of June 30, 2009. Excluding these loans, the allowance for loan losses to period-end loans was 10.95%. (d) Statistics are only presented for periods after September 25, 2008, the date of the Washington Mutual transaction. (e) As a percentage of average managed outstandings. (f) Represents total net revenue less provision for credit losses. (g) Excludes the impact of purchase accounting adjustments related to the Washington Mutual transaction and the consolidation of the Washington Mutual Master Trust. Page 18
  • 20.
    JPMORGAN CHASE &CO. CARD RECONCILIATION OF REPORTED AND MANAGED DATA (in millions) QUARTERLY TRENDS YEAR-TO-DATE 2Q09 Change 2Q09 INCOME STATEMENT DATA (a) Credit card income Reported Securitization adjustments Managed credit card income Net interest income Reported Securitization adjustments Managed net interest income Total net revenue Reported Securitization adjustments Managed total net revenue $ $ $ $ $ $ Provision for credit losses Reported Securitization adjustments Managed provision for credit losses $ BALANCE SHEETS - AVERAGE BALANCES (a) Total average assets Reported Securitization adjustments Managed average assets $ CREDIT QUALITY STATISTICS (a) Net charge-offs Reported Securitization adjustments Managed net charge-offs $ $ $ $ 1Q09 1,215 (294) 921 $ 2,353 1,958 4,311 $ $ $ 3,204 1,664 4,868 $ 2,939 1,664 4,603 $ $ 111,722 81,588 193,310 $ 2,689 1,664 4,353 $ $ $ $ 4Q08 1,384 (540) 844 $ 2,478 2,004 4,482 $ $ $ 3,665 1,464 5,129 $ 3,189 1,464 4,653 $ $ 118,418 82,782 201,200 $ 2,029 1,464 3,493 $ $ $ $ 3Q08 1,553 (691) 862 $ 2,408 1,910 4,318 $ $ $ 3,689 1,219 4,908 $ 2,747 1,219 3,966 $ $ 118,290 85,653 203,943 $ 1,397 1,219 2,616 $ $ $ $ 2Q08 1,476 (843) 633 $ 1,525 1,716 3,241 $ $ $ 3,014 873 3,887 $ 1,356 873 2,229 $ $ 93,701 75,712 169,413 $ 1,106 873 1,979 $ $ $ $ 1Q09 2Q08 2009 1,516 (843) 673 (12) % 46 9 1,338 1,673 3,011 (5) (2) (4) 76 17 43 2,945 830 3,775 (13) 14 (5) 9 100 29 1,364 830 2,194 (8) 14 (1) 115 100 110 $ 87,021 74,580 161,601 (6) (1) (4) 28 9 20 $ 33 14 25 153 100 130 1,064 830 1,894 (20) % 65 37 $ $ $ $ $ $ $ $ $ $ 2008 2,599 (834) 1,765 $ 4,831 3,962 8,793 $ 6,869 3,128 9,997 3,053 (1,780) 1,273 $ 66 20 42 6,168 1,511 7,679 11 107 30 2,353 1,511 3,864 160 107 140 87,517 73,084 160,601 31 12 23 2,053 1,511 3,564 130 107 120 $ $ $ 115,052 82,182 197,234 $ 4,718 3,128 7,846 $ $ (15) % 53 39 2,905 3,291 6,196 $ 6,128 3,128 9,256 2009 Change 2008 $ $ (a) JPMorgan Chase uses the concept of “managed receivables” to evaluate the credit performance and overall performance of the underlying credit card loans, both sold and not sold; as the same borrower is continuing to use the credit card for ongoing charges, a borrower’s credit performance will affect both the receivables sold under SFAS 140 and those not sold. Thus, in its disclosures regarding managed receivables, JPMorgan Chase treats the sold receivables as if they were still on the balance sheet in order to disclose the credit performance (such as net charge-off rates) of the entire managed credit card portfolio. Managed results exclude the impact of credit card securitizations on total net revenue, the provision for credit losses, net charge-offs and loan receivables. Securitization does not change reported net income versus managed earnings; however, it does affect the classification of items on the Consolidated Statements of Income and Consolidated Balance Sheets. Page 19
  • 21.
    JPMORGAN CHASE &CO. COMMERCIAL BANKING FINANCIAL HIGHLIGHTS (in millions, except ratio data) QUARTERLY TRENDS YEAR-TO-DATE 2Q09 Change 2Q09 INCOME STATEMENT REVENUE Lending & deposit-related fees Asset management, administration and commissions All other income (a) Noninterest revenue Net interest income TOTAL NET REVENUE $ 1Q09 270 36 152 458 995 1,453 $ 4Q08 263 34 125 422 980 1,402 $ 3Q08 242 32 102 376 1,103 1,479 $ 2Q08 212 29 147 388 737 1,125 $ 1Q09 207 26 150 383 723 1,106 2Q08 3 % 6 22 9 2 4 2009 30 % 38 1 20 38 31 $ 2009 Change 2008 2008 533 70 277 880 1,975 2,855 $ 400 52 265 717 1,456 2,173 33 % 35 5 23 36 31 Provision for credit losses 312 293 190 126 47 6 NM 605 148 309 NONINTEREST EXPENSE Compensation expense Noncompensation expense Amortization of intangibles TOTAL NONINTEREST EXPENSE 197 327 11 535 200 342 11 553 164 324 11 499 177 298 11 486 173 290 13 476 (2) (4) (3) 14 13 (15) 12 397 669 22 1,088 351 584 26 961 13 15 (15) 13 Income before income tax expense Income tax expense NET INCOME 606 238 368 556 218 338 790 310 480 513 201 312 583 228 355 9 9 9 4 4 4 1,162 456 706 1,064 417 647 9 9 9 3 5 56 NM 4 82 8 25 NM 31 79 6 18 NM 31 59 3 (2) 26 (47) 4 MEMO: Revenue by product: Lending Treasury services Investment banking Other Total Commercial Banking revenue IB revenue, gross (b) Revenue by business: Middle Market Banking Commercial Term Lending (c) Mid-Corporate Banking Real Estate Banking (c) Other (c) Total Commercial Banking revenue FINANCIAL RATIOS ROE Overhead ratio $ $ $ 684 679 114 (24) 1,453 $ $ $ $ $ 665 646 73 18 1,402 328 $ 772 224 305 120 32 1,453 $ 18 37 $ $ $ % $ 611 759 88 21 1,479 206 $ 752 228 242 120 60 1,402 $ 17 39 $ $ $ % $ 377 643 87 18 1,125 $ 376 630 91 9 1,106 241 $ 252 $ 270 796 243 243 131 66 1,479 $ 729 236 91 69 1,125 $ 708 235 94 69 1,106 24 34 $ $ $ % 18 43 $ $ % 20 43 % $ $ $ $ 1,349 1,325 187 (6) 2,855 $ 755 1,246 159 13 2,173 21 $ 534 $ 473 9 NM 30 28 (54) 31 $ 1,524 452 547 240 92 2,855 $ 1,414 442 191 126 2,173 $ 18 38 $ $ % 19 44 13 8 NM 24 26 (27) 31 % (a) Revenue from investment banking products sold to Commercial Banking ("CB") clients and commercial card revenue is included in all other income. (b) Represents the total revenue related to investment banking products sold to CB clients. (c) Includes total net revenue on net assets acquired in the Washington Mutual transaction starting in the period ending December 31, 2008. Page 20
  • 22.
    JPMORGAN CHASE &CO. COMMERCIAL BANKING FINANCIAL HIGHLIGHTS, CONTINUED (in millions, except ratio and headcount data) QUARTERLY TRENDS YEAR-TO-DATE 2009 Change 2008 2Q09 Change 2Q09 SELECTED BALANCE SHEET DATA (Period-end) Loans: Loans retained Loans held-for-sale & loans at fair value Total loans Equity SELECTED BALANCE SHEET DATA (Average) Total assets Loans: Loans retained Loans held-for-sale & loans at fair value Total loans Liability balances (a) Equity MEMO: Loans by business: Middle Market Banking Commercial Term Lending (b) Mid-Corporate Banking Real Estate Banking (b) Other (b) Total Commercial Banking loans Net charge-off rate (f) Allowance for loan losses to period-end loans (d) (f) Allowance for loan losses to average loans (d) (f) Allowance for loan losses to nonperforming loans (c) (d) Nonperforming loans to period-end loans (d) Nonperforming loans to average loans (d) 4Q08 3Q08 2Q08 1Q09 105,556 296 105,852 8,000 $ 71,105 306 71,411 7,000 103,469 (5) 33 $ 140,771 $ 102,724 37 70,682 379 71,061 99,404 7,000 (4) (3) (4) (8) - 54 (24) 53 6 14 69,096 450 69,546 99,441 7,000 61 (35) 60 11 14 42,879 15,357 7,500 5,325 71,061 (6) (8) (7) (3) (4) (11) NM 11 65 (15) 53 41,495 15,253 7,479 5,319 69,546 (5) NM 16 71 (14) 60 4,028 (7) 5 4,028 5 130 486 510 142 334 342 1,843 170 2,013 65 60 64 110,923 272 111,195 8,000 $ 115,130 295 115,425 8,000 $ 117,316 313 117,629 8,000 $ 71,105 306 71,411 7,000 $ 137,283 $ 144,298 $ 149,815 $ 101,681 $ $ $ 38,193 36,963 17,012 12,347 4,523 109,038 $ $ 4,228 $ 40,728 36,814 18,416 13,264 4,643 113,865 $ $ 4,545 181 2,111 2,255 $ 3,034 272 3,306 0.67 2.87 2.79 145 1.99 1.94 117,351 329 117,680 114,113 8,000 134 1,531 1,651 0.48 2.65 2.59 192 1.38 1.34 $ $ 5,206 $ 2,945 240 3,185 % 71,901 397 72,298 99,410 7,000 42,613 37,039 18,169 13,529 6,330 117,680 118 1,026 1,142 0.40 2.45 2.41 275 0.89 0.87 $ $ 5,298 $ 2,826 206 3,032 % 43,155 16,491 7,513 5,139 72,298 40 844 923 2,698 191 2,889 % 0.22 % 2.30 2.32 (g) 320 0.72 0.72 (g) 2008 $ $ 113,568 297 113,865 114,975 8,000 2009 48 % (3) 48 14 105,556 296 105,852 8,000 108,750 288 109,038 105,829 8,000 2Q08 (5) % 9 (5) - $ Headcount CREDIT DATA AND QUALITY STATISTICS Net charge-offs Nonperforming loans (c) (d) Nonperforming assets Allowance for credit losses: Allowance for loan losses (e) Allowance for lending-related commitments Total allowance for credit losses 1Q09 $ 49 486 510 35 38 37 269 334 342 1,843 170 2,013 3 13 4 65 60 64 0.28 % 2.59 2.61 401 0.68 0.68 111,146 292 111,438 110,377 8,000 $ $ 39,453 36,889 17,710 12,803 4,583 111,438 $ $ 4,228 $ 315 2,111 2,255 $ 3,034 272 3,306 0.57 % 2.87 2.73 145 1.99 1.89 48 % (3) 48 14 0.38 % 2.59 2.67 401 0.68 0.70 (a) Liability balances include deposits and deposits swept to on-balance sheet liabilities such as commercial paper, federal funds purchased and securities loaned or sold under repurchase agreements. (b) Includes loans acquired in the Washington Mutual transaction starting in the period ended December 31, 2008. (c) Nonperforming loans included loans held-for-sale and loans at fair value of $21 million and $26 million at June 30, 2009 and 2008, respectively. These amounts were excluded when calculating the allowance for loan losses to nonperforming loans ratio. There were no nonperforming loans held-for-sale or held at fair value at March 31, 2009, December 31, 2008, and September 30, 2008. (d) Purchased credit-impaired wholesale loans accounted for under SOP 03-3 that were acquired in the Washington Mutual transaction are considered nonperforming loans because the timing and amount of expected cash flows are not reasonably estimable. These nonperforming loans were included when calculating the allowance coverage ratios, the allowance for loan losses-to-nonperforming loans ratio, and the nonperforming loans-to-average and period-end loans ratios. The carrying amount of these purchased credit-impaired loans at June 30, 2009, March 31, 2009, December 31, 2008, and September 30, 2008, was $209 million, $210 million, $224 million and $272 million, respectively. (e) The allowance for loan losses at September 30, 2008, and June 30, 2008, included amounts related to loans acquired in the Washington Mutual transaction and the merger with Bear Stearns, respectively. (f) Loans held-for-sale and loans accounted for at fair value were excluded when calculating the allowance coverage ratios and the net charge-off rate. (g) Average loans in the calculation of this ratio were adjusted to include $44.5 billion of loans acquired from Washington Mutual as if the transaction occurred on July 1, 2008. Excluding this adjustment, the unadjusted allowance for loan losses-to-average loans and nonperforming loans-to-average loans ratios would have been 3.75% and 1.17%, respectively. Page 21
  • 23.
    JPMORGAN CHASE &CO. TREASURY & SECURITIES SERVICES FINANCIAL HIGHLIGHTS (in millions, except headcount and ratio data) QUARTERLY TRENDS YEAR-TO-DATE 2Q09 Change 2Q09 INCOME STATEMENT REVENUE Lending & deposit-related fees Asset management, administration and commissions All other income Noninterest revenue Net interest income TOTAL NET REVENUE $ Provision for credit losses Credit reimbursement to IB (a) 1Q09 314 710 221 1,245 655 1,900 $ (5) (30) 4Q08 325 626 197 1,148 673 1,821 $ (6) (30) 3Q08 304 748 268 1,320 929 2,249 $ 45 (30) 2Q08 290 719 221 1,230 723 1,953 $ 18 (31) 1Q09 283 846 228 1,357 662 2,019 7 (30) NONINTEREST EXPENSE Compensation expense Noncompensation expense Amortization of intangibles TOTAL NONINTEREST EXPENSE 618 650 20 1,288 629 671 19 1,319 628 692 19 1,339 664 661 14 1,339 669 632 16 1,317 Income before income tax expense Income tax expense NET INCOME 587 208 379 478 170 308 835 302 533 565 159 406 665 240 425 REVENUE BY BUSINESS Treasury Services (b) Worldwide Securities Services (b) TOTAL NET REVENUE $ $ $ FINANCIAL RATIOS ROE Overhead ratio Pretax margin ratio (c) SELECTED BALANCE SHEET DATA (Period-end) Loans (d) Equity SELECTED BALANCE SHEET DATA (Average) Total assets Loans (d) Liability balances (e) Equity Headcount 934 966 1,900 $ $ $ 30 % 68 31 931 890 1,821 $ $ $ 25 % 72 26 1,068 1,181 2,249 $ $ $ 47 % 60 37 946 1,007 1,953 $ $ $ 46 % 69 29 905 1,114 2,019 2Q08 2009 2009 Change 2008 2008 (3) % 13 12 8 (3) 4 11 % (16) (3) (8) (1) (6) 17 - NM - (2) (3) 5 (2) (8) 3 25 (2) 1,247 1,321 39 2,607 1,310 1,203 32 2,545 (5) 10 22 2 23 22 23 (12) (13) (11) 1,065 378 687 1,308 480 828 (19) (21) (17) 1,765 2,167 3,932 6 (14) (5) 9 4 3 (13) (6) $ 639 1,336 418 2,393 1,328 3,721 $ (11) (60) $ $ $ 49 % 65 33 1,865 1,856 3,721 552 1,666 428 2,646 1,286 3,932 16 % (20) (2) (10) 3 (5) 19 (60) $ $ $ 28 % 70 29 NM - 48 % 65 33 $ 17,929 5,000 $ 18,529 5,000 $ 24,508 4,500 $ 40,675 4,500 $ 26,348 3,500 (3) - (32) 43 $ 17,929 5,000 $ 26,348 3,500 (32) 43 $ 35,520 17,524 234,163 5,000 $ 38,682 20,140 276,486 5,000 $ 55,515 31,283 336,277 4,500 $ 49,386 26,650 259,992 3,500 $ 56,192 23,822 268,293 3,500 (8) (13) (15) - (37) (26) (13) 43 $ 37,092 18,825 255,208 5,000 $ 56,698 23,454 261,331 3,500 (35) (20) (2) 43 27,232 1 27,232 - 27,252 26,998 27,070 27,592 - 27,252 (a) The Investment Bank credit portfolio group manages certain exposures on behalf of clients shared with TSS. TSS reimburses IB for a portion of the total cost of managing the credit portfolio. IB recognizes this credit reimbursement as a component of noninterest revenue. (b) Reflects an internal reorganization for escrow products, from Worldwide Securities Services to Treasury Services revenue of $46 million, $45 million, $75 million, $49 million, and $52 million, for the quarters ended June 30, 2009, March 31, 2009, December 31, 2008, September 30, 2008, and June 30, 2008, respectively, and $91 million and $99 million for year-to-date 2009 and 2008, respectively. (c) Pretax margin represents income before income tax expense divided by total net revenue, which is a measure of pretax performance and another basis by which management evaluates its performance and that of its competitors. (d) Loan balances include wholesale overdrafts, commercial card and trade finance loans. (e) Liability balances include deposits and deposits swept to on-balance sheet liabilities such as commercial paper, federal funds purchased and securities loaned or sold under repurchase agreements. Page 22
  • 24.
    JPMORGAN CHASE &CO. TREASURY & SECURITIES SERVICES FINANCIAL HIGHLIGHTS, CONTINUED (in millions, except ratio data and where otherwise noted) TSS firmwide metrics include revenue recorded in the CB, Retail Banking and Asset Management ("AM") lines of business and excludes FX revenue recorded in the IB for TSS-related FX activity. In order to capture the firmwide impact of Treasury Services ("TS") and TSS products and revenue, management reviews firmwide metrics such as liability balances, revenue and overhead ratios in assessing financial performance for TSS. Firmwide metrics are necessary in order to understand the aggregate TSS business. QUARTERLY TRENDS YEAR-TO-DATE 2Q09 Change 2Q09 TSS FIRMWIDE DISCLOSURES Treasury Services revenue - reported (a) Treasury Services revenue reported in Commercial Banking Treasury Services revenue reported in other lines of business Treasury Services firmwide revenue (a) (b) Worldwide Securities Services revenue (a) Treasury & Securities Services firmwide revenue (b) Treasury Services firmwide liability balances (average) (c) (d) Treasury & Securities Services firmwide liability balances (average) (c) $ $ $ TSS FIRMWIDE FINANCIAL RATIOS Treasury Services firmwide overhead ratio (e) Treasury & Securities Services firmwide overhead ratio (e) FIRMWIDE BUSINESS METRICS Assets under custody (in billions) Net charge-off (recovery) rate Allowance for loan losses to period-end loans Allowance for loan losses to average loans Allowance for loan losses to nonperforming loans Nonperforming loans to period-end loans Nonperforming loans to average loans 934 679 63 1,676 966 2,642 $ 258,312 339,992 $ 51 59 $ Number of: US$ ACH transactions originated (in millions) Total US$ clearing volume (in thousands) International electronic funds transfer volume (in thousands) (f) Wholesale check volume (in millions) Wholesale cards issued (in thousands) (g) CREDIT DATA AND QUALITY STATISTICS Net charge-offs (recoveries) Nonperforming loans Allowance for loan losses Allowance for lending-related commitments 1Q09 $ % 13,748 $ $ 289,645 391,461 $ $ % 13,532 $ % $ 1,068 759 82 1,909 1,181 3,090 $ 312,559 450,390 $ $ % 13,205 $ % $ 946 643 76 1,665 1,007 2,672 $ 248,075 359,401 $ $ % 14,417 $ % $ 905 630 72 1,607 1,114 2,721 2Q08 - % 5 2 2 9 4 252,625 367,670 (11) (13) 2009 3 % 8 (13) 4 (13) (3) 2 (8) $ % $ $ $ % 15,476 2 (11) 4 6 1 7 (2) (3) 14 (7) 19 NM (53) (71) 19 NM NM (63) 179 (2) 40 33 (0.03) % 0.15 0.17 NM - $ 1,865 1,325 125 3,315 1,856 5,171 $ 273,892 365,584 $ $ % 13,748 $ 6 % 6 (11) 5 (14) (3) 247,897 360,758 10 1 % $ % 15,476 (11) 1,997 57,119 81,471 1,241 19,917 19 14 15 92 0.20 0.08 0.08 107 0.08 0.07 1,765 1,246 141 3,152 2,167 5,319 53 58 1,956 55,379 91,461 1,140 23,744 $ 2009 Change 2008 2008 52 61 993 29,063 41,432 618 19,917 47 45 0.12 0.18 NM - 1Q09 53 58 997 29,277 41,831 595 21,858 30 74 63 0.30 0.24 247 0.12 0.10 2Q08 52 60 1,006 29,346 47,734 572 22,784 2 30 51 77 0.04 0.28 0.25 170 0.16 0.15 3Q08 44 52 978 27,186 44,365 568 22,233 17 14 15 92 0.39 0.08 0.09 107 0.08 0.08 931 646 62 1,639 890 2,529 53 63 978 28,193 47,096 572 23,744 $ 4Q08 (2) (3) 12 (8) 19 (2) 40 33 NM NM (63) 179 (0.02) % 0.15 0.17 NM - (a) Reflects an internal reorganization for escrow products, from Worldwide Securities Services to Treasury Services revenue, of $46 million, $45 million, $75 million, $49 million, and $52 million, for the quarters ended June 30, 2009, March 31, 2009, December 31, 2008, September 30, 2008, and June 30, 2008, respectively, and $91 million and $99 million for year-to-date 2009 and 2008, respectively. (b) TSS firmwide FX revenue includes FX revenue recorded in TSS and FX revenue associated with TSS customers who are FX customers of IB. FX revenue associated with TSS customers who are FX customers of IB was $191 million, $154 million, $271 million, $196 million, and $222 million, for the quarters ended June 30, 2009, March 31, 2009, December 31, 2008, September 30, 2008, and June 30, 2008, respectively, and $345 million and $413 million for year-to-date 2009 and 2008, respectively. These amounts are not included in TS and TSS firmwide revenue. (c) Firmwide liability balances include liability balances recorded in Commercial Banking. (d) Reflects an internal reorganization for escrow products, from Worldwide Securities Services to Treasury Services liability balances, of $14.9 billion, $18.2 billion, $22.3 billion, $20.3 billion, and $21.9 billion for the quarters ended June 30, 2009, March 31, 2009, December 31, 2008, September 30, 2008, and June 30, 2008, respectively, and $16.5 billion and $21.7 billion for year-to-date 2009 and 2008, respectively. (e) Overhead ratios have been calculated based upon firmwide revenue and TSS and TS expense, respectively, including those allocated to certain other lines of business. FX revenue and expense recorded in IB for TSS-related FX activity are not included in this ratio. (f) International electronic funds transfer includes non-US dollar ACH and clearing volume. (g) Wholesale cards issued include domestic commercial card, stored value card, prepaid card and government electronic benefit card products. Page 23
  • 25.
    JPMORGAN CHASE &CO. ASSET MANAGEMENT FINANCIAL HIGHLIGHTS (in millions, except ratio, ranking and headcount data) QUARTERLY TRENDS YEAR-TO-DATE 2Q09 Change 2Q09 INCOME STATEMENT REVENUE Asset management, administration and commissions All other income Noninterest revenue Net interest income TOTAL NET REVENUE $ Provision for credit losses REVENUE BY CLIENT SEGMENT Private Bank (a) Institutional Retail Private Wealth Management (a) Bear Stearns Private Client Services Total net revenue 1,315 253 1,568 414 1,982 $ 4Q08 1,231 69 1,300 403 1,703 $ 3Q08 1,362 (170) 1,192 466 1,658 $ 2Q08 1,538 43 1,581 380 1,961 $ 1Q09 1,573 130 1,703 361 2,064 59 $ $ $ FINANCIAL RATIOS ROE Overhead ratio Pretax margin ratio (b) 33 32 20 17 810 525 19 1,354 NONINTEREST EXPENSE Compensation expense Noncompensation expense Amortization of intangibles TOTAL NONINTEREST EXPENSE Income before income tax expense Income tax expense NET INCOME 1Q09 800 479 19 1,298 689 504 20 1,213 816 525 21 1,362 886 494 20 1,400 569 217 352 640 487 411 334 110 1,982 $ $ $ 20 % 68 29 BUSINESS METRICS Number of: Client advisors (c) Retirement planning services participants Bear Stearns brokers 372 148 224 583 460 253 312 95 1,703 $ $ $ 13 % 76 22 1,785 1,595,000 362 413 158 255 630 327 265 330 106 1,658 $ $ $ 14 % 73 25 1,833 1,628,000 359 579 228 351 631 486 399 352 93 1,961 $ $ $ 25 % 69 30 1,795 1,531,000 324 2Q08 7 % 267 21 3 16 79 2009 (16) % 95 (8) 15 (4) $ 247 1 10 4 53 47 57 (12) (14) (11) 708 472 490 356 38 2,064 10 6 62 7 16 16 (10) 3 (16) (6) 189 (4) 1,801 1,505,000 326 $ (18) % 70 (13) 22 (7) $ $ $ 33 1,711 971 41 2,723 (6) 3 (7) (3) 1,209 458 751 (22) (20) (23) 1,304 962 956 705 38 3,965 (6) (2) (31) (8) 439 (7) 941 365 576 1,223 947 664 646 205 3,685 $ $ $ 17 % 72 26 (3) (2) 1 3,104 189 3,293 672 3,965 1,610 1,004 38 2,652 31 % 68 31 1,769 1,492,000 323 2,546 322 2,868 817 3,685 92 (9) 6 (5) (3) 647 252 395 2009 Change 2008 2008 (1) 6 11 179 30 % 69 30 1,785 1,595,000 362 1,801 1,505,000 326 (1) 6 11 % of customer assets in 4 & 5 Star Funds (d) 45 % 42 % 42 % 39 % 40 % 7 13 45 % 40 % 13 % of AUM in 1st and 2nd quartiles: (e) 1 year 3 years 5 years 62 % 69 % 80 % 54 % 62 % 66 % 54 % 65 % 76 % 49 % 67 % 77 % 51 % 70 % 76 % 15 11 21 22 (1) 5 62 % 69 % 80 % 51 % 70 % 76 % 22 (1) 5 SELECTED BALANCE SHEET DATA (Period-end) Loans Equity SELECTED BALANCE SHEET DATA (Average) Total assets Loans Deposits Equity $ 35,474 7,000 $ 33,944 7,000 $ 36,188 7,000 $ 39,720 7,000 $ 41,536 5,200 5 - (15) 35 $ 35,474 7,000 $ 41,536 5,200 (15) 35 $ 59,334 34,292 75,355 7,000 $ 58,227 34,585 81,749 7,000 $ 65,648 36,851 76,911 7,000 $ 71,189 39,750 65,621 5,500 $ 65,015 39,264 69,975 5,066 2 (1) (8) - (9) (13) 8 38 $ 58,783 34,438 78,534 7,000 $ 62,651 37,946 69,079 5,033 (6) (9) 14 39 15,840 (2) (6) 15,840 (6) 2 68 147 5 142 4 5 - NM 360 54 (20) 68 147 5 NM 360 54 (20) Headcount CREDIT DATA AND QUALITY STATISTICS Net charge-offs (recoveries) Nonperforming loans Allowance for loan losses Allowance for lending-related commitments Net charge-off (recovery) rate Allowance for loan losses to period-end loans Allowance for loan losses to average loans Allowance for loan losses to nonperforming loans Nonperforming loans to period-end loans Nonperforming loans to average loans (a) (b) (c) (d) (e) 14,840 $ 46 313 226 4 0.54 % 0.64 0.66 72 0.88 0.91 15,109 $ 19 301 215 4 0.22 % 0.63 0.62 71 0.89 0.87 15,339 $ 12 147 191 5 0.13 % 0.53 0.52 130 0.41 0.40 15,493 $ (1) 121 170 5 (0.01) % 0.43 0.43 140 0.30 0.30 $ 0.02 % 0.35 0.37 216 0.16 0.17 14,840 $ 65 313 226 4 0.38 % 0.64 0.66 72 0.88 0.91 $ % 0.35 0.39 216 0.16 0.18 In the third quarter of 2008, certain clients were transferred from Private Bank to Private Wealth Management. Prior periods have been revised to conform with this change. Pretax margin represents income before income tax expense divided by total net revenue, which is a measure of pretax performance and another basis by which management evaluates its performance and that of its competitors. Prior periods revised to conform with current methodology. Derived from the following rating services: Morningstar for the United States; Micropal for the United Kingdom, Luxembourg, Hong Kong and Taiwan; and Nomura for Japan. Derived from the following rating services: Lipper for the United States and Taiwan; Micropal for the United Kingdom, Luxembourg and Hong Kong; and Nomura for Japan. Page 24
  • 26.
    JPMORGAN CHASE &CO. ASSET MANAGEMENT FINANCIAL HIGHLIGHTS, CONTINUED (in billions) Jun 30 2009 Assets by asset class Liquidity Fixed income Equities & balanced Alternatives TOTAL ASSETS UNDER MANAGEMENT Custody / brokerage / administration / deposits TOTAL ASSETS UNDER SUPERVISION Assets by client segment Institutional Private Bank (a) Retail Private Wealth Management (a) Bear Stearns Private Client Services TOTAL ASSETS UNDER MANAGEMENT Institutional Private Bank (a) Retail Private Wealth Management (a) Bear Stearns Private Client Services TOTAL ASSETS UNDER SUPERVISION Assets by geographic region U.S. / Canada International TOTAL ASSETS UNDER MANAGEMENT U.S. / Canada International TOTAL ASSETS UNDER SUPERVISION Mutual fund assets by asset class Liquidity Fixed income Equities Alternatives TOTAL MUTUAL FUND ASSETS $ $ $ $ $ $ $ $ $ $ $ $ 617 194 264 96 1,171 372 1,543 Mar 31 2009 $ $ 697 179 216 67 12 1,171 $ 697 390 289 123 44 1,543 $ 814 357 1,171 $ 1,103 440 1,543 $ 569 48 111 9 737 $ $ $ $ $ $ 625 180 215 95 1,115 349 1,464 Dec 31 2008 $ $ 668 181 184 68 14 1,115 $ 669 375 250 120 50 1,464 $ 789 326 1,115 $ 1,066 398 1,464 $ 570 42 85 8 705 $ $ $ $ $ $ 613 180 240 100 1,133 363 1,496 681 181 194 71 6 1,133 Sep 30 2008 $ $ $ $ 682 378 262 124 50 1,496 $ 798 335 1,133 $ 1,084 412 1,496 $ 553 41 92 7 693 $ $ $ $ $ 524 189 308 132 1,153 409 1,562 653 194 223 75 8 1,153 Jun 30 2008 $ $ $ $ 653 417 303 134 55 1,562 $ 785 368 1,153 $ 1,100 462 1,562 $ 470 44 127 7 648 $ $ $ $ $ 478 199 378 130 1,185 426 1,611 Jun 30, 2009 Change Mar 31 Jun 30 2009 2008 (1) % 8 23 1 5 7 5 29 % (2) (30) (26) (1) (13) (4) 645 181 276 75 8 1,185 4 (1) 17 (1) (14) 5 8 (1) (22) (11) 50 (1) 646 415 357 133 60 1,611 4 4 16 2 (12) 5 8 (6) (19) (8) (27) (4) 771 414 1,185 3 10 5 6 (14) (1) 1,093 518 1,611 3 11 5 1 (15) (4) 14 31 13 5 37 2 (35) 13 15 416 47 171 8 642 (a) In the third quarter of 2008, certain clients were transferred from Private Bank to Private Wealth Management. Prior periods have been revised to conform with this change. Page 25
  • 27.
    JPMORGAN CHASE &CO. ASSET MANAGEMENT FINANCIAL HIGHLIGHTS, CONTINUED (in billions) QUARTERLY TRENDS 2Q09 ASSETS UNDER SUPERVISION (continued) Assets under management rollforward Beginning balance Net asset flows: Liquidity Fixed income Equities, balanced & alternative Market / performance / other impacts (a) TOTAL ASSETS UNDER MANAGEMENT Assets under supervision rollforward Beginning balance Net asset flows Market / performance / other impacts (a) TOTAL ASSETS UNDER SUPERVISION $ 1,115 $ (7) 8 2 53 1,171 $ $ 1,464 (9) 88 1,543 1Q09 $ 1,133 $ 19 1 (5) (33) 1,115 $ $ 1,496 25 (57) 1,464 YEAR-TO-DATE 4Q08 $ 1,153 $ 86 (7) (18) (81) 1,133 $ $ 1,562 73 (139) 1,496 3Q08 $ 1,185 $ 55 (4) (5) (78) 1,153 $ $ 1,611 61 (110) 1,562 2Q08 $ 1,187 $ 1 (1) (3) 1 1,185 $ $ 1,569 (5) 47 1,611 2009 $ 1,133 $ 12 9 (3) 20 1,171 $ $ 1,496 16 31 1,543 2008 $ 1,193 $ 69 (1) (24) (52) 1,185 $ $ 1,572 47 (8) 1,611 (a) Second quarter 2008 reflects $15 billion for assets under management and $68 billion for assets under supervision from the Bear Stearns merger on May 30, 2008. Page 26
  • 28.
    JPMORGAN CHASE &CO. CORPORATE/PRIVATE EQUITY FINANCIAL HIGHLIGHTS (in millions, except headcount data) QUARTERLY TRENDS YEAR-TO-DATE 2Q09 Change 2Q09 INCOME STATEMENT REVENUE Principal transactions Securities gains All other income (a) Noninterest revenue Net interest income (expense) TOTAL NET REVENUE $ Provision for credit losses (b) MEMO: TOTAL NET REVENUE Private equity Corporate TOTAL NET REVENUE NET INCOME (LOSS) Private equity Corporate Merger-related items (e) TOTAL NET INCOME (LOSS) Headcount 1,243 366 (209) 1,400 865 2,265 $ 9 NONINTEREST EXPENSE Compensation expense Noncompensation expense (c) Merger costs Subtotal Net expense allocated to other businesses TOTAL NONINTEREST EXPENSE Income (loss) before income tax expense and extraordinary gain Income tax expense (benefit) Income (loss) before extraordinary gain Extraordinary gain (d) NET INCOME (LOSS) 1Q09 $ $ $ $ $ $ $ $ (27) 993 (158) 808 $ $ $ (221) 41 (262) (262) (1,620) 499 685 (436) 868 432 $ (1,876) 440 (275) (1,711) (125) (1,836) 2Q08 $ 1,977 1Q09 (97) 656 (378) 181 (47) 134 37 2Q08 2009 NM % 71 NM NM (13) NM NM % (44) 45 NM NM NM NM (76) 438 673 181 1,292 (1,364) (72) $ (449) 140 (309) $ (280) 252 (234) (262) $ 22,339 3Q08 (33) 641 345 205 1,191 (1,279) (88) (1) 2,266 2,265 21,522 (1,493) 214 (19) (1,298) 989 (309) - 655 1,319 143 2,117 (1,253) 864 1,392 584 808 808 4Q08 $ $ 652 563 96 1,311 (1,150) 161 611 689 155 1,455 (1,070) 385 2 282 (30) 78 2 NM 537 317 220 1,325 1,545 (3,974) (1,613) (2,361) 581 (1,780) (288) 31 (319) (319) NM NM NM NM 7 91 (8) 45 (17) 124 NM NM NM NM 197 (63) 134 100 NM NM NM NM NM 99 122 (540) (319) 90 294 32 NM NM NM 71 NM (4) (4) $ (1,107) 1,539 432 $ (682) 1,163 1,064 1,545 $ 23,376 $ $ $ (216) (1,620) (1,836) $ (164) (881) (735) (1,780) $ 24,967 $ $ 22,317 $ 2009 Change 2008 2008 (250) 580 (228) 102 1,854 1,956 $ 9 (92) 698 1,263 1,869 (396) 1,473 (172) % (17) NM (95) NM 33 37 (76) 1,296 1,664 348 3,308 (2,532) 776 $ $ $ $ $ 1,250 605 155 2,010 (2,127) (117) 4 175 125 65 (19) NM 1,171 625 546 546 1,553 761 792 792 (25) (18) (31) (31) 360 1,113 1,473 NM 116 33 156 1,176 (540) 792 NM 6 27 (31) (450) 2,406 1,956 (307) 1,245 (392) 546 21,522 $ $ $ $ $ 22,317 (4) (a) Included the following significant items: a gain of $1.0 billion from the dissolution of the Chase Paymentech Solutions joint venture in the fourth quarter of 2008, a charge of $375 million for the repurchase of auction rate securities in the third quarter of 2008, $423 million representing the Firm's share of Bear Stearns' losses from April 8 to May 30, 2008, in the second quarter of 2008, and proceeds of $1.5 billion from the sale of Visa shares in its initial public offering in the first quarter of 2008. (b) The fourth and third quarters of 2008 included accounting conformity loan loss reserve provisions related to the acquisition of Washington Mutual Bank's banking operations. An analysis of loans acquired in the transaction was substantially completed during the fourth quarter. This resulted in an increase in the credit-impaired loan balances, a corresponding reduction in the non-credit-impaired portfolio and a reduction in the estimate of incurred losses related to the non-credit-impaired portfolio requiring a reduction in the accounting conformity provision for these loans. Also, the fourth quarter of 2008 includes a provision for credit losses related to the transfer of higher quality credit card loans from the legacy Chase portfolio to a securitization trust previously established by Washington Mutual. (c) Second quarter 2009 includes a $675 million FDIC special assessment. (d) JPMorgan Chase acquired the banking operations of Washington Mutual Bank for $1.9 billion. The fair value of the net assets acquired exceeded the purchase price, which resulted in negative goodwill. In accordance with SFAS 141, nonfinancial assets that are not held-for-sale were written down against that negative goodwill. The negative goodwill that remained after writing down nonfinancial assets was recognized as an extraordinary gain. (e) Included accounting conformity loan loss reserve provisions, extraordinary gains and merger costs related to the Washington Mutual transaction, as well as items related to the Bear Stearns merger, including Bear Stearns' losses, merger costs, Bear Stearns asset management liquidation costs and Bear Stearns Private Client Services broker retention expense. Page 27
  • 29.
    JPMORGAN CHASE &CO. CORPORATE/PRIVATE EQUITY FINANCIAL HIGHLIGHTS, CONTINUED (in millions, except ratio data) QUARTERLY TRENDS YEAR-TO-DATE 2Q09 Change 2Q09 1Q09 4Q08 3Q08 2Q08 1Q09 2Q08 2009 2008 2009 Change 2008 SUPPLEMENTAL TREASURY Securities gains (a) (b) Investment securities portfolio (average) (b) Investment securities portfolio (ending) (b) Mortgage loans (average) Mortgage loans (ending) PRIVATE EQUITY Private equity gains (losses) Direct investments Realized gains Unrealized gains (losses) (c) Total direct investments Third-party fund investments Total private equity gains (losses) (d) Private equity portfolio information Direct investments Publicly-held securities Carrying value Cost Quoted public value Privately-held direct securities Carrying value Cost Third-party fund investments (e) Carrying value Cost $ $ $ $ 374 336,263 326,414 7,228 7,368 25 16 41 (61) (20) 431 778 477 $ $ $ $ 214 265,785 316,498 7,210 7,162 15 (409) (394) (68) (462) 305 778 346 $ $ $ $ 512 159,209 192,564 7,277 7,292 24 (1,000) (976) (121) (1,097) 483 792 543 $ $ $ $ 442 108,728 119,085 7,221 7,297 40 (273) (233) 27 (206) 600 705 657 $ $ $ $ 656 100,481 106,604 7,004 7,150 75 % 27 3 3 (43) % 235 206 3 3 $ 540 (326) 214 6 220 67 NM NM 10 96 (95) NM (81) NM NM $ 615 665 732 41 38 (30) 17 (35) 4,709 5,627 4,708 5,519 5,564 6,296 6,038 6,058 6,270 6,113 2 1,537 2,082 805 1,169 889 1,121 838 1,094 (8) (1) 40 (393) (353) (129) (482) $ $ $ 698 91,821 106,604 6,867 7,150 1,653 (1,207) 446 (37) 409 (16) % 228 206 5 3 (98) 67 NM (249) NM (25) (8) 1,420 2,055 $ 588 301,219 326,414 7,219 7,368 69 88 Total private equity portfolio - Carrying value $ 6,560 $ 6,550 $ 6,852 $ 7,527 $ 7,723 Total private equity portfolio - Cost $ 8,460 $ 8,379 $ 8,257 $ 7,884 $ 7,872 1 (15) 7 (a) Included a $668 million gain on the sale of MasterCard shares in the second quarter of 2008. All periods reflect repositioning of the Corporate investment securities portfolio, and exclude gains/losses on securities used to manage risk associated with MSRs. (b) Beginning in second quarter 2009, balances reflect Treasury and Chief Investment Office securities. Prior periods have been revised to conform with this change. (c) Unrealized gains (losses) contain reversals of unrealized gains and losses that were recognized in prior periods and have now been realized. (d) Included in principal transactions revenue in the Consolidated Statements of Income. (e) Unfunded commitments to third-party private equity funds were $1.5 billion, $1.5 billion, $1.4 billion, $931 million, and $861 million at June 30, 2009, March 31, 2009, December 31, 2008, September 30, 2008, and June 30, 2008, respectively. Page 28
  • 30.
    JPMORGAN CHASE &CO. CREDIT-RELATED INFORMATION (in millions) Jun 30, 2009 Change Jun 30 2009 CREDIT EXPOSURE WHOLESALE (a) Loans - U.S. Loans - Non-U.S. TOTAL WHOLESALE LOANS - REPORTED (b) $ CONSUMER (c) Home loan portfolio - excluding purchased credit-impaired loans: Home equity Prime mortgage Subprime mortgage Option ARMs Total home loan portfolio - excluding purchased credit-impaired loans Home loan portfolio - purchased credit-impaired loans: (d) Home equity Prime mortgage Subprime mortgage Option ARMs Total home loan portfolio - purchased credit-impaired loans Other consumer: Auto Credit card - reported: Credit card - reported excluding loans consolidated from the Washington Mutual Master Trust Credit card - reported loans consolidated from the Washington Mutual Master Trust (e) Total credit card - reported Other loans Loans held-for-sale (f) TOTAL CONSUMER LOANS - REPORTED TOTAL LOANS - REPORTED Credit card - securitized TOTAL LOANS - MANAGED Derivative receivables Receivables from customers (g) Interests in purchased receivables TOTAL CREDIT-RELATED ASSETS Wholesale lending-related commitments TOTAL Memo: Total by category Total wholesale exposure (h) Total consumer managed loans (i) Total 172,204 59,421 231,625 Mar 31 2009 $ 176,282 66,002 242,284 Dec 31 2008 $ 186,776 75,268 262,044 Sep 30 2008 $ 202,170 86,275 288,445 Jun 30 2008 $ Mar 31 2009 137,236 92,123 229,359 108,229 68,878 13,825 9,034 199,966 116,804 70,243 18,162 18,989 224,198 28,366 21,398 6,565 31,243 87,572 28,555 21,855 6,760 31,643 88,813 26,507 24,672 3,863 22,653 77,695 - 42,887 43,065 42,603 43,306 80,722 5,014 85,736 33,041 1,940 448,976 $ 114,335 72,266 15,330 9,018 210,949 27,729 20,807 6,341 30,529 85,406 $ 111,781 71,731 14,594 8,940 207,046 90,911 90,911 33,700 3,665 465,959 104,746 104,746 33,715 2,028 482,854 92,881 92,881 33,252 1,604 472,936 680,601 85,790 766,391 97,491 12,977 2,972 879,831 343,991 1,223,822 708,243 85,220 793,463 131,247 14,504 939,214 363,013 1,302,227 744,898 85,571 830,469 162,626 16,141 1,009,236 379,871 1,389,107 761,381 93,664 855,045 118,648 25,422 999,115 407,823 1,406,938 $ $ $ 95,129 46,221 14,792 156,142 Jun 30 2008 (2) % (10) (4) 25 % (35) 1 14 49 (7) NM 28 (2) (3) (3) (2) (2) NM NM NM NM NM 44,867 - (4) 76,278 76,278 29,187 2,196 308,670 $ (3) (4) (5) 1 (3) (11) NM (6) (2) (47) (4) 6 NM 12 13 (12) 45 538,029 79,120 617,149 122,389 26,572 766,110 430,028 1,196,138 (4) 1 (3) (26) (11) NM (6) (5) (6) 26 8 24 (20) (51) NM 15 (20) 2 689,056 534,766 1,223,822 $ $ 840,338 566,600 1,406,938 $ $ 820,682 568,425 1,389,107 $ $ 751,048 551,179 1,302,227 $ $ $ 808,348 387,790 1,196,138 (8) (3) (6) (15) 38 2 $ 491,168 $ 546,968 $ 605,210 $ 620,524 $ 595,043 (10) (17) Risk profile of wholesale credit exposure: Investment-grade (j) Noninvestment-grade: (j) Noncriticized Criticized performing Criticized nonperforming Total noninvestment-grade 141,408 26,453 6,533 174,394 147,891 25,320 4,615 177,826 159,379 22,568 3,429 185,376 161,503 14,491 1,418 177,412 154,218 11,611 899 166,728 (4) 4 42 (2) (8) 128 NM 5 Loans held-for-sale & loans at fair value Receivables from customers (g) Interests in purchased receivables Total wholesale exposure 7,545 12,977 2,972 689,056 11,750 14,504 751,048 13,955 16,141 820,682 16,980 25,422 840,338 20,005 26,572 808,348 (36) (11) NM (8) (62) (51) NM (15) $ $ $ $ $ (a) (b) (c) (d) Includes Investment Bank, Commercial Banking, Treasury & Securities Services and Asset Management. Includes loans held-for-sale and loans at fair value. Includes Retail Financial Services, Card Services and residential mortgage loans reported in the Corporate/Private Equity segment to be risk managed by the Chief Investment Office. Purchased credit-impaired loans accounted for under SOP 03-3 represent loans acquired in the Washington Mutual transaction for which a deterioration in credit quality occurred between the origination date and JPMorgan Chase's acquisition date. Under SOP 03-3, these loans were initially recorded at fair value and accrete interest income over the estimated life of the loan when cash flows are reasonably estimable even if the underlying loans are contractually past due. As of September 30, 2008, an analysis of the acquired portfolio was conducted in order to preliminarily identify loans meeting the SOP 03-3 impairment criteria. This analysis was completed during the fourth quarter of 2008, resulting in the reclassification of $12.4 billion of acquired loans from the non-credit-impaired loan balances into the credit-impaired loan balances. (e) Represents loans from the Washington Mutual Master Trust, which were consolidated onto the Firm's balance sheet at fair value during the second quarter of 2009. No allowance for loan losses was recorded for these loans as of June 30, 2009. (f) Included loans for prime mortgage of $589 million, $825 million, $206 million, $132 million, and $964 million at June 30, 2009, March 31, 2009, December 31, 2008, September 30, 2008, and June 30, 2008, respectively, and other (largely student loans) of $1.4 billion, $2.8 billion, $1.8 billion, $1.5 billion, and $1.2 billion at June 30, 2009, March 31, 2009, December 31, 2008, September 30, 2008, and June 30, 2008, respectively. (g) Represents margin loans to prime and retail brokerage customers, which are included in accrued interest and accounts receivable on the Consolidated Balance Sheets. (h) Primarily represents total wholesale loans, derivative receivables, wholesale lending-related commitments and receivables from customers. (i) Represents total consumer loans plus credit card securitizations, and excludes consumer lending-related commitments. (j) Excludes loans held-for-sale and loans at fair value. Note: The risk profile is based on JPMorgan Chase's internal risk ratings, which generally correspond to the following ratings as defined by Standard & Poor's / Moody's: Investment-Grade: AAA / Aaa to BBB- / Baa3 Noninvestment-Grade: BB+ / Ba1 and below Page 29
  • 31.
    JPMORGAN CHASE &CO. CREDIT-RELATED INFORMATION, CONTINUED (in millions, except ratio data) Jun 30 2009 NONPERFORMING ASSETS AND RATIOS WHOLESALE LOANS (a) Loans - U.S. Loans - Non-U.S. TOTAL WHOLESALE LOANS $ CONSUMER LOANS (b) Home loan portfolio (includes RFS and Corporate/Private Equity): Home equity Prime mortgage Subprime mortgage Option ARMs Total home loan portfolio Auto loans Credit card - reported Other loans TOTAL CONSUMER LOANS (c) (d) Mar 31 2009 5,156 806 5,962 $ Dec 31 2008 3,040 622 3,662 $ Sep 30 2008 2,123 259 2,382 $ Jun 30, 2009 Change Mar 31 Jun 30 2009 2008 Jun 30 2008 1,185 220 1,405 $ 806 64 870 70 % 30 63 NM % NM NM 1,487 3,501 2,773 182 7,943 154 4 722 8,823 1,591 2,712 2,545 97 6,945 165 4 625 7,739 1,394 1,895 2,690 10 5,989 148 4 430 6,571 1,142 1,496 2,384 5,022 119 5 382 5,528 1,008 1,232 1,715 3,955 102 6 340 4,403 (7) 29 9 88 14 (7) 16 14 48 184 62 NM 101 51 (33) 112 100 TOTAL NONPERFORMING LOANS REPORTED 14,785 11,401 8,953 6,933 5,273 30 180 Derivative receivables Assets acquired in loan satisfactions TOTAL NONPERFORMING ASSETS 704 2,028 17,517 1,010 2,243 14,654 1,079 2,682 12,714 45 2,542 9,520 80 880 6,233 (30) (10) 20 NM 130 181 49 8 37 (53) 2 22 20 NM 101 (33) 342 NM 379 450 181 $ TOTAL NONPERFORMING LOANS TO TOTAL LOANS REPORTED NONPERFORMING ASSETS BY LOB Investment Bank Retail Financial Services (d) Card Services Commercial Banking Treasury & Securities Services Asset Management Corporate/Private Equity (e) TOTAL 2.17 $ $ 4,534 10,351 4 2,255 14 326 33 17,517 $ % 1.61 $ $ 3,041 9,582 4 1,651 30 319 27 14,654 $ % 1.20 $ $ 2,501 8,841 4 1,142 30 172 24 12,714 $ % 0.91 $ $ 583 7,878 5 923 121 10 9,520 $ % 0.98 $ $ 490 5,153 6 510 68 6 6,233 % (a) Included nonperforming loans held-for-sale and loans at fair value of $133 million, $57 million, $32 million, $32 million, and $51 million at June 30, 2009, March 31, 2009, December 31, 2008, September 30, 2008, and June 30, 2008, respectively. Excluded purchased held-for-sale wholesale loans. (b) There were no nonperforming loans held-for-sale at June 30, 2009, March 31, 2009, December 31, 2008, September 30, 2008, or June 30, 2008. (c) Excludes nonperforming loans and assets related to: (1) loans eligible for repurchase, as well as loans repurchased from GNMA pools that are insured by U.S. government agencies, of $4.7 billion, $4.6 billion, $3.3 billion, $1.8 billion, and $1.9 billion at June 30, 2009, March 31, 2009, December 31, 2008, September 30, 2008, and June 30, 2008, respectively; and (2) student loans that are 90 days past due and still accruing, which are insured by U.S. government agencies under the Federal Family Education Loan Program, of $473 million, $433 million, $437 million, $405 million, and $394 million at June 30, 2009, March 31, 2009, December 31, 2008, September 30, 2008, and June 30, 2008, respectively. These amounts for GNMA and education loans are excluded, as reimbursement is proceeding normally. (d) Excludes home lending purchased credit-impaired loans accounted for under SOP 03-3 that were acquired as part of the Washington Mutual transaction. These loans are accounted for on a pool basis, and the pools are considered to be performing under SOP 03-3. Also excludes loans held-for-sale and loans at fair value. (e) Predominantly relates to held-for-investment prime mortgage. Page 30
  • 32.
    JPMORGAN CHASE &CO. CREDIT-RELATED INFORMATION, CONTINUED (in millions, except ratio data) QUARTERLY TRENDS YEAR-TO-DATE 2Q09 Change 2Q09 GROSS CHARGE-OFFS Wholesale loans Consumer (includes RFS and Corporate/Private Equity) Credit card - reported Total loans - reported Credit card - securitized Total loans - managed $ NET CHARGE-OFF RATES Wholesale loans (a) Consumer excluding credit card (b) 697 $ 4Q08 206 $ 3Q08 238 $ 2Q08 71 $ 1Q09 82 2Q08 238 % 2009 NM % 2,718 2,883 6,298 1,776 8,074 1,752 1,559 3,549 1,351 4,900 1,375 1,245 2,691 985 3,676 1,079 1,209 2,370 949 3,319 21 32 36 12 30 15 21 19 41 20 68 160 243 115 358 51 162 234 123 357 49 139 207 112 319 54 145 240 119 359 (1) 21 15 (3) 9 679 191 217 52 41 255 2,651 2,689 6,019 1,664 7,683 2,176 2,029 4,396 1,464 5,860 1,701 1,397 3,315 1,228 4,543 1,326 1,106 2,484 873 3,357 1,025 1,064 2,130 830 2,960 22 33 37 14 31 $ 152 138 166 87 143 67 194 279 112 391 $ 2,244 2,189 4,639 1,579 6,218 18 RECOVERIES Wholesale loans Consumer (includes RFS and Corporate/Private Equity) Credit card - reported Total loans - reported Credit card - securitized Total loans - managed NET CHARGE-OFFS Wholesale loans Consumer (includes RFS and Corporate/Private Equity) Credit card - reported Total loans - reported Credit card - securitized Total loans - managed 1Q09 1.19 2.90 $ % 0.32 2.36 $ % 0.33 1.80 $ % 0.10 2.29 $ % 0.08 1.81 % 2009 Change 2008 2008 903 $ 212 326 % 4,962 5,072 10,937 3,355 14,292 1,959 2,353 4,524 1,740 6,264 (56) 33 79 (58) 24 34 16 (6) 9 135 354 522 227 749 109 300 488 229 717 24 18 7 (1) 4 NM 870 133 NM 4,827 4,718 10,415 3,128 13,543 1,850 2,053 4,036 1,511 5,547 159 153 183 100 160 $ 0.75 2.63 $ % 0.13 1.66 Consumer excluding purchased credit-impaired loans (b) Credit card - reported Total loans - reported (a) (b) Credit card - securitized Total loans - managed (a) (b) 3.80 12.03 3.52 7.91 4.00 3.09 8.42 2.51 6.93 2.98 2.35 5.63 1.80 5.48 2.20 2.29 5.56 1.91 4.43 2.24 1.81 5.66 1.67 4.32 2.02 3.44 10.15 3.01 7.42 3.49 10.03 7.72 5.56 5.00 4.98 8.85 161 130 158 107 144 % 1.66 5.32 1.60 4.02 1.91 Memo: Credit card - managed 153 116 142 93 128 4.68 (a) Average wholesale loans held-for-sale and loans at fair value were $9.7 billion, $13.3 billion, $16.7 billion, $18.0 billion, and $20.8 billion for the quarters ended June 30, 2009, March 31, 2009, December 31, 2008, September 30, 2008, and June 30, 2008, respectively, and $11.5 billion and $20.5 billion for year-to-date 2009 and 2008, respectively. These amounts were excluded when calculating the net charge-off rates. Excluding average wholesale purchased credit-impaired loans of $210 million, $217 million, and $248 million for the quarters ended June 30, 2009, March 31, 2009, and December 31, 2008, respectively, and $213 million for year-to-date 2009 has no effect on the net charge-off rate. (b) Average consumer (excluding card) loans held-for-sale and loans at fair value were $2.8 billion, $3.1 billion, $1.8 billion, $1.5 billion, and $3.6 billion for the quarters ended June 30, 2009, March 31, 2009, December 31, 2008, September 30, 2008, and June 30, 2008, respectively, and $2.9 billion and $4.0 billion for year-to-date 2009 and 2008, respectively. These amounts were excluded when calculating the net charge-off rates. Page 31
  • 33.
    JPMORGAN CHASE &CO. CREDIT-RELATED INFORMATION, CONTINUED (in millions, except ratio data) QUARTERLY TRENDS YEAR-TO-DATE 2Q09 Change 2Q09 SUMMARY OF CHANGES IN THE ALLOWANCE FOR LOAN LOSSES Beginning balance Acquired allowance resulting from the Washington Mutual transaction Net charge-offs Provision for loan losses (a) Other (b) Ending balance SUMMARY OF CHANGES IN THE ALLOWANCE FOR LENDING-RELATED COMMITMENTS Beginning balance Provision for lending-related commitments Other Ending balance ALLOWANCE COMPONENTS AND RATIOS ALLOWANCE FOR LOAN LOSSES Wholesale Asset specific Formula - based Total wholesale $ $ $ $ $ Consumer Asset specific Formula - based Total consumer Total allowance for loan losses Allowance for lending-related commitments Total allowance for credit losses 27,381 6,019 7,923 (213) 29,072 $ $ 638 108 746 $ 2,108 6,284 8,392 $ $ 132 20,548 20,680 $ Wholesale allowance for loan losses to total wholesale loans (c) Consumer allowance for loan losses to total consumer loans (d) Consumer allowance for loan losses to total consumer loans excluding purchased credit-impaired loans and loans from the Washington Mutual Trust (d) (e) (f) Allowance for loan losses to ending loans (c) (d) Allowance for loan losses to ending loans excluding purchased credit-impaired loans and loans from the Washington Mutual Master Trust (c) (d) (e) (f) Allowance for loan losses to total nonperforming loans (g) (h) ALLOWANCE FOR LOAN LOSSES BY LOB Investment Bank Retail Financial Services Card Services Commercial Banking Treasury & Securities Services Asset Management Corporate/Private Equity Total 1Q09 23,164 4,396 8,617 (4) 27,381 $ 659 (21) 638 $ $ $ 1,213 6,691 7,904 $ 106 19,371 19,477 29,072 746 29,818 3.75 4.63 4Q08 $ % 19,052 3,315 7,434 (7) 23,164 $ 713 (121) 67 659 $ $ $ 712 5,833 6,545 $ 74 16,545 16,619 27,381 638 28,019 3.43 4.21 3Q08 $ % 13,246 2,535 2,484 5,760 (5) 19,052 $ $ % 686 27 713 $ 253 5,326 5,579 $ $ 19,052 713 19,765 2.06 2.86 1Q09 $ % 11,746 2,130 3,624 6 13,246 133 % 183 119 NM 119 (3) NM 17 (25) NM 9 174 4,295 4,469 74 (6) 6 25 6 6 116 136 136 13,246 686 13,932 6 17 6 119 9 114 9 11 3 (71) 5 25 6 $ 2009 Change 2008 2008 NM 46 88 110 134 139 65 (63) 54 25 119 855 (169) 686 $ $ $ 23,164 10,415 16,540 (217) 29,072 659 87 746 $ $ $ $ 9,234 4,036 8,043 5 13,246 850 (164) 686 151 % 158 106 NM 119 (22) NM 9 2.13 % 2.86 5.20 3.95 4.24 3.18 3.42 2.56 2.86 2.57 5.01 198 $ 2009 18 % 37 (8) NM 6 5.80 4.33 $ 2Q08 61 8,716 8,777 $ 70 13,403 13,473 23,164 659 23,823 2.64 3.46 2Q08 4.53 241 3.62 260 2.87 287 2.57 254 5,101 11,832 8,839 3,034 15 226 25 29,072 $ $ 4,682 10,619 8,849 2,945 51 215 20 27,381 $ $ 3,444 8,918 7,692 2,826 74 191 19 23,164 $ $ 2,654 7,517 5,946 2,698 47 170 20 19,052 $ $ 2,429 5,062 3,705 1,843 40 147 20 13,246 (a) Includes accounting conformity loan loss reserve provision related to the acquisition of Washington Mutual Bank's banking operations. (b) Activity for the quarter and six months ended June 30, 2009, predominantly included a reclassification related to the issuance and retention of securities from the Chase Issuance Trust. (c) Wholesale loans held-for-sale and loans at fair value were $7.6 billion, $11.7 billion, $14.0 billion, $17.0 billion, and $20.0 billion at June 30, 2009, March 31, 2009, December 31, 2008, September 30, 2008, and June 30, 2008, respectively. These amounts were excluded when calculating the allowance coverage ratios. Excluding wholesale purchased credit-impaired loans of $209 million, $210 million, $224 million, and $272 million at June 30, 2009, March 31, 2009, December 31, 2008, and September 30, 2008, respectively, has no effect on the wholesale allowance coverage ratios. (d) Consumer loans held-for-sale were $1.9 billion, $3.7 billion, $2.0 billion, $1.6 billion, and $2.2 billion at June 30, 2009, March 31, 2009, December 31, 2008, September 30, 2008, and June 30, 2008, respectively. These amounts were excluded when calculating the allowance coverage ratios. (e) Excludes the impact of purchased credit-impaired loans accounted for under SOP 03-3 that were acquired as part of the Washington Mutual transaction. These loans were accounted for at fair value on the acquisition date, which incorporated management's estimate, as of that date, of credit losses over the remaining life of the portfolio. No allowance for loan losses has been recorded for these loans as of June 30, 2009, March 31, 2009, December 31, 2008, or September 30, 2008. (f) Represents loans from the Washington Mutual Master Trust, which were consolidated onto the Firm's balance sheet at fair value during the second quarter of 2009. No allowance for loan losses was recorded for these loans as of June 30, 2009. (g) Nonperforming loans held-for-sale and loans at fair value were $133 million, $57 million, $32 million, $32 million, and $51 million at June 30, 2009, March 31, 2009, December 31, 2008, September 30, 2008, and June 30, 2008, respectively. These amounts were excluded when calculating the allowance coverage ratios. (h) Excludes consumer purchased credit-impaired loans accounted for under SOP 03-3 that were acquired as part of the Washington Mutual transaction. These loans are accounted for on a pool basis and the pools are considered to be performing under SOP 03-3. Page 32
  • 34.
    JPMORGAN CHASE &CO. CREDIT-RELATED INFORMATION, CONTINUED (in millions) QUARTERLY TRENDS YEAR-TO-DATE 2Q09 Change 2Q09 PROVISION FOR CREDIT LOSSES LOANS Investment Bank Commercial Banking Treasury & Securities Services Asset Management Corporate/Private Equity (a) (b) Total wholesale Retail Financial Services Card Services - reported Corporate/Private Equity (a) Total consumer Total provision for loan losses LENDING-RELATED COMMITMENTS Investment Bank Commercial Banking Treasury & Securities Services Asset Management Corporate/Private Equity (a) Total wholesale Retail Financial Services Card Services - reported Corporate/Private Equity (a) Total consumer Total provision for lending-related commitments TOTAL PROVISION FOR CREDIT LOSSES Investment Bank Commercial Banking Treasury & Securities Services Asset Management Corporate/Private Equity (a) (b) Total wholesale Retail Financial Services Card Services - reported Corporate/Private Equity (a) Total consumer Total provision for credit losses Credit card - securitized Managed provision for credit losses $ $ $ $ $ $ 1Q09 815 280 (20) 59 7 1,141 3,841 2,939 2 6,782 7,923 $ 56 32 15 103 5 5 108 $ 871 312 (5) 59 7 1,244 3,846 2,939 2 6,787 8,031 $ 1,664 9,695 $ $ $ 4Q08 1,274 263 (20) 34 1,551 3,877 3,189 7,066 8,617 $ (64) 30 14 (1) (21) (21) $ 1,210 293 (6) 33 1,530 3,877 3,189 7,066 8,596 $ 1,464 10,060 $ $ $ 3Q08 869 180 27 32 76 1,184 3,578 2,747 (75) 6,250 7,434 $ (104) 10 18 5 (71) (2) (48) (50) (121) $ 765 190 45 32 81 1,113 3,576 2,747 (123) 6,200 7,313 $ 1,228 8,541 $ $ $ 2Q08 238 105 7 21 564 935 2,056 1,356 1,413 4,825 5,760 (4) 21 11 (1) 27 27 234 126 18 20 564 962 2,056 1,356 1,413 4,825 5,787 873 6,660 $ $ $ $ $ $ 1Q09 538 77 7 17 36 675 1,584 1,364 1 2,949 3,624 2Q08 2009 (36) % 6 74 NM (26) (1) (8) NM (4) (8) 51 % 264 NM 247 (81) 69 142 115 100 130 119 $ NM 7 7 NM NM NM NM NM NM NM NM NM 400 400 NM $ 398 47 7 17 36 505 1,585 1,364 1 2,950 3,455 (28) 6 17 79 NM (19) (1) (8) NM (4) (7) 119 NM NM 247 (81) 146 143 115 100 130 132 $ 830 4,285 14 (4) 100 126 (140) (30) (170) 1 1 (169) $ $ $ 2009 Change 2008 2008 2,089 543 (40) 93 7 2,692 7,718 6,128 2 13,848 16,540 $ (8) 62 29 (1) 82 5 5 87 $ 2,081 605 (11) 92 7 2,774 7,723 6,128 2 13,853 16,627 $ 3,128 19,755 $ $ $ 1,109 220 18 34 36 1,417 4,272 2,353 1 6,626 8,043 (93) (72) 1 (1) (165) 1 1 (164) 88 % 147 NM 174 (81) 90 81 160 100 109 106 91 NM NM NM 400 400 NM 1,016 148 19 33 36 1,252 4,273 2,353 1 6,627 7,879 105 309 NM 179 (81) 122 81 160 100 109 111 1,511 9,390 107 110 (a) Includes accounting conformity provisions related to the Washington Mutual transaction in the third quarter of 2008. (b) Includes provision expense related to loans acquired in the Bear Stearns transaction in the second quarter of 2008. Page 33
  • 35.
    JPMORGAN CHASE &CO. MARKET RISK-RELATED INFORMATION (in millions) QUARTERLY TRENDS YEAR-TO-DATE 2Q09 Change 2Q09 AVERAGE IB TRADING VAR AND CREDIT PORTFOLIO VAR - 99% CONFIDENCE LEVEL IB VaR by risk type: Fixed income Foreign exchange Equities Commodities and other Diversification benefit to IB trading VaR (a) 99% IB Trading VaR (b) Credit portfolio VaR (c) Diversification benefit to IB trading and credit portfolio VaR (a) 99% Total IB trading and credit portfolio VaR AVERAGE IB TRADING VAR , CREDIT PORTFOLIO VAR AND OTHER VAR - 95% CONFIDENCE LEVEL (d) IB VaR by risk type: Fixed income Foreign exchange Equities Commodities and other Diversification benefit to IB trading VaR (a) 95% IB Trading VaR (b) $ $ $ 1Q09 249 26 77 34 (136) 250 133 (116) 267 179 16 50 22 (97) 170 $ $ $ 4Q08 218 40 162 28 (159) 289 182 (135) 336 158 23 97 20 (108) 190 $ $ $ 3Q08 276 55 87 30 (146) 302 165 (140) 327 194 32 47 21 (103) 191 $ $ $ 2Q08 183 20 80 41 (104) 220 47 (49) 218 $ $ 1Q09 2Q08 155 26 30 31 (92) 150 14 % (35) (52) 21 14 (13) 35 (36) 149 (27) 14 (21) 130 13 46 24 (69) 144 13 (30) (48) 10 10 (11) 2009 61 % 157 10 (48) 67 280 (222) 79 $ $ $ 2009 Change 2008 2008 234 33 119 31 (148) 269 157 (125) 301 $ $ 137 30 31 29 (91) 136 33 (34) 135 71 % 10 284 7 (63) 98 376 (268) 123 168 19 73 21 (101) 180 Credit portfolio VaR (c) Diversification benefit to IB trading and credit portfolio VaR (a) 95% Total IB trading and credit portfolio VaR 68 (60) 178 86 (63) 213 66 (50) 207 25 (22) 147 (21) 5 (16) 77 (62) 195 Consumer Lending VaR (e) Corporate Risk Management VaR (f) Diversification benefit to total other VaR (a) Total other VaR 43 111 (29) 125 108 121 (61) 168 56 76 (31) 101 19 22 (10) 31 (60) (8) 52 (26) 75 116 (45) 146 (24) 154 4 (26) Diversification benefit to total IB and other VaR (a) Total IB and other VaR $ (89) 214 $ (93) 288 $ (56) 252 $ $ (91) 250 (a) Average VaRs were less than the sum of the VaRs of their market risk components, which was due to risk offsets resulting from portfolio diversification. The diversification effect reflected the fact that the risks were not perfectly correlated. The risk of a portfolio of positions is therefore usually less than the sum of the risks of the positions themselves. (b) IB Trading VaR includes predominantly all trading activities in IB; however, particular risk parameters of certain products are not fully captured, for example, correlation risk. The 95% IB Trading VaR includes syndicated lending facilities that the Firm intends to distribute, and the credit spread sensitivities of certain mortgage products. The 99% IB Trading VaR includes the credit spread sensitivities of certain mortgage products but does not include syndicated lending facilities that the Firm intends to distribute. Both the 95% and 99% IB Trading VaR do not include the debit valuation adjustments ("DVA") taken on derivative and structured liabilities to reflect the credit quality of the Firm. (c) Includes VaR on derivative credit valuation adjustments ("CVA"), hedges of the CVA and mark-to-market hedges of the retained loan portfolio, which are all reported in principal transactions revenue. This VaR does not include the retained loan portfolio. (d) In the third quarter of 2008, the Firm revised the VaR measurement to create a more comprehensive view of its market risks by adding syndicated lending facilities that the Firm intends to distribute, and the credit spread sensitivities of certain mortgage products. In addition, certain actively managed positions utilized as part of the Firm's risk management function within Corporate and in RFS' mortgage banking businesses have been added to IB VaR to provide a Total IB and other VaR measure. Finally, the Firm moved from using a 99% confidence level to a 95% confidence level since the 95% level provides a more stable measure of the VaR for day-to-day risk management. This section presents the results of the Firm’s VaR measure under the revised measurement using a 95% confidence level. The Firm intends to only present the VaR at this confidence level once information for five quarters and two comparative year-to-date periods is available. (e) Consumer Lending VaR includes the Firm’s mortgage pipeline and warehouse, MSR and all related hedges. (f) Corporate Risk Management VaR includes certain actively managed positions utilized as part of the Firm's risk management function within Corporate. It does not include certain nontrading activity such as Private Equity, principal investing (e.g., mezzanine financing, tax-oriented investments, etc.) and Corporate Treasury balance sheet and capital management positions as well as longer-term corporate investments. Page 34
  • 36.
    JPMORGAN CHASE &CO. CAPITAL, INTANGIBLE ASSETS AND DEPOSITS (in millions, except ratio data) Jun 30, 2009 Change Jun 30 2009 CAPITAL RATIOS Tier 1 capital Total capital Risk-weighted assets Adjusted average assets Tier 1 capital ratio Total capital ratio Tier 1 leverage ratio INTANGIBLE ASSETS (PERIOD-END) Goodwill Mortgage servicing rights Purchased credit card relationships All other intangibles Total intangibles DEPOSITS (PERIOD-END) U.S. offices: Noninterest-bearing Interest-bearing Non-U.S. offices: Noninterest-bearing Interest-bearing Total deposits Mar 31 2009 $ 122,187 167,821 1,263,576 1,969,352 9.7 13.3 6.2 (a) $ (a) (a) (a) % (a) (a) (a) $ 48,288 14,600 1,431 3,651 67,970 $ 192,247 433,862 $ $ $ $ 8,291 232,077 866,477 $ $ Dec 31 2008 137,144 $ 183,109 1,207,490 1,923,186 11.4 % 15.2 7.1 48,201 10,634 1,528 3,821 64,184 $ 197,027 463,913 $ 7,073 238,956 906,969 $ $ Sep 30 2008 136,104 $ 184,720 1,244,659 1,966,895 10.9 % 14.8 6.9 48,027 9,403 1,649 3,932 63,011 $ 210,899 511,077 $ 7,697 279,604 1,009,277 $ $ Jun 30 2008 111,630 $ 159,175 1,261,034 1,555,297 8.9 % 12.6 7.2 46,121 17,048 1,827 3,653 68,649 $ 193,253 506,974 $ 9,747 259,809 969,783 $ $ 98,775 145,012 1,079,199 1,536,439 9.2 % 13.4 6.4 Mar 31 2009 Jun 30 2008 (11) % (8) 5 2 24 16 17 28 45,993 11,617 1,984 3,675 63,269 37 (6) (4) 6 5 26 (28) (1) 7 125,606 362,150 (2) (6) 53 20 7,827 227,322 722,905 17 (3) (4) % 6 2 20 (a) Estimated. Page 35
  • 37.
    JPMORGAN CHASE &CO. PER SHARE-RELATED INFORMATION (in millions, except per share and ratio data) QUARTERLY TRENDS YEAR-TO-DATE 2Q09 Change 2Q09 EARNINGS PER SHARE DATA (a) Basic earnings per share: Income (loss) before extraordinary gain Extraordinary gain Net income Less: Preferred stock dividends Less: Preferred stock accelerated amortization from TARP redemption Net income applicable to common equity Less: Dividends and undistributed earnings allocated to participating securities Net income applicable to common stockholders (c) $ $ Total weighted-average basic shares outstanding Income (loss) before extraordinary gain per share (b) Extraordinary gain per share Net income per share (b) Diluted earnings per share: Net income applicable to common stockholders (c) COMMON SHARES OUTSTANDING Common shares outstanding - at period end (f) Cash dividends declared per share Book value per share Dividend payout SHARE PRICE High Low Close Market capitalization STOCK REPURCHASE PROGRAM Common shares repurchased 2,721 2,721 473 1,112 1,136 64 1,072 $ $ 3,811.5 $ $ $ Total weighted-average basic shares outstanding Add: Employee stock options and SARs (d) Total weighted-average diluted shares outstanding (e) Income (loss) before extraordinary gain per share (b) Extraordinary gain per share Net income per share (b) 1Q09 $ $ 0.28 0.28 $ 1,072 $ $ $ 38.94 25.29 34.11 133,852 - $ $ $ $ $ 0.40 0.40 $ 1,519 $ $ % $ 31.64 14.96 26.58 99,881 - (623) 1,325 702 423 279 47 232 $ $ $ $ $ (0.29) 0.35 0.06 $ 232 $ $ % $ (0.29) 0.35 0.06 3,732.8 0.38 36.15 532 50.63 19.69 31.53 117,695 - 2Q08 (54) 581 527 161 366 48 318 $ $ 3,444.6 3,737.5 (g) 3,737.5 0.40 0.40 3,757.7 0.05 36.78 15 3Q08 3,737.5 3,755.7 3.0 3,758.7 0.28 0.28 3,924.1 0.05 37.36 14 2,141 2,141 529 1,612 93 1,519 3,755.7 3,811.5 12.6 3,824.1 $ 4Q08 $ $ (0.08) 0.17 0.09 $ 318 $ $ % $ (0.08) 0.17 0.09 3,726.9 0.38 36.95 399 49.00 29.24 46.70 174,048 - 2,003 2,003 90 1,913 70 1,843 $ $ % $ 2009 36 % 36 426 NM (41) (9) (42) $ $ 1 11 0.54 0.54 (30) (30) (48) (48) $ 1,843 (29) (42) $ 1 320 2 11 (53) 11 (30) (30) (47) (47) 4 2 14 (87) 1 23 69 28 34 (22) (26) (1) 14 3,426.2 26.9 3,453.1 $ 2Q08 27 % 27 (11) NM (30) (31) (29) 3,426.2 3,444.6 (g) 3,444.6 $ 1Q09 0.53 0.53 3,435.7 0.38 37.02 71 49.95 33.96 34.31 117,881 - - $ $ $ $ $ $ 4,376 4,376 90 4,286 153 4,133 11 % 11 NM (36) 3 (37) 3,411.1 0.68 0.68 $ 2,591 $ $ 11 1.21 1.21 (44) (44) 4,133 (37) 3,411.1 27.1 3,438.2 11 (71) 10 1.20 1.20 (43) (43) 3,924.1 0.10 $ 37.36 15 % 3,435.7 0.76 37.02 63 % 14 (87) 1 38.94 14.96 34.11 133,852 49.95 33.96 34.31 117,881 (22) (56) (1) 14 3,783.6 7.8 3,791.4 % - 4,862 4,862 1,002 1,112 2,748 157 2,591 3,783.6 $ 2009 Change 2008 2008 0.68 0.68 - $ $ $ - - (a) Effective January 1, 2009, the Firm implemented FSP EITF 03-6-1, which clarifies that unvested stock-based compensation awards containing nonforfeitable rights to dividends or dividend equivalents (collectively, “dividends”) are participating securities and should be included in the EPS calculation using the two-class method. JPMorgan Chase grants restricted stock and RSUs to certain employees under its stock-based compensation programs, which entitle the recipients to receive nonforfeitable dividends during the vesting period on a basis equivalent to the dividends paid to holders of common stock. These unvested awards meet the FSP’s definition of participating securities. Under the two-class method, all earnings (distributed and undistributed) are allocated to each class of common stock and participating securities, based on their respective rights to receive dividends. EPS data for the prior periods were revised as required by the FSP. (b) The calculation of second quarter 2009 earnings per share includes a one-time, non-cash reduction of $1.1 billion, or $0.27 per share, resulting from repayment of TARP preferred capital. (c) Net income applicable to common stockholders for diluted and basic EPS may differ under the two-class method as a result of adding common stock equivalents for options, SARs and warrants to dilutive shares outstanding, which alters the ratio used to allocate earnings to common stockholders and participating securities for purposes of calculating diluted EPS. (d) Options issued under employee benefit plans and, subsequent to October 28, 2008, the warrant issued under the U.S. Treasury’s Capital Purchase Program, to purchase an aggregate 315 million, 363 million, 299 million, 194 million, and 169 million shares of common stock were outstanding for the quarters ended June 30, 2009, March 31, 2009, December 31, 2008, September 30, 2008, and June 30, 2008, respectively, but were not included in the computation of diluted EPS because the options were antidilutive. (e) Participating securities were included in the calculation of diluted EPS using the two-class method, as this computation was more dilutive than the calculation using the treasury-stock method. (f) On June 5, 2009, the Firm issued $5.8 billion, or 163 million shares, of its common stock at $35.25 per share; and on September 30, 2008, the Firm issued $11.5 billion, or 284 million shares, of its common stock at $40.50 per share. (g) Common equivalent shares have been excluded from the computation of diluted loss per share for the fourth and third quarters of 2008, as the effect would have been antidilutive. Page 36
  • 38.
    JPMORGAN CHASE &CO. Glossary of Terms ACH: Automated Clearing House. Average managed assets: Refers to total assets on the Firm's Consolidated Balance Sheets plus credit card receivables that have been securitized. Beneficial interest issued by consolidated VIEs: Represents the interest of third-party holders of debt/equity securities, or other obligations, issued by VIEs that JPMorgan Chase consolidates under FIN 46R. The underlying obligations of the VIEs consist of short-term borrowings, commercial paper and long-term debt. The related assets consist of trading assets, availablefor-sale securities, loans and other assets. Contractual credit card charge-off: In accordance with the Federal Financial Institutions Examination Council policy, credit card loans are charged off by the end of the month in which the account becomes 180 days past due or within 60 days from receiving notification of the filing of bankruptcy, whichever is earlier. Corporate/Private Equity: Includes Private Equity, Treasury and Corporate Other, which includes other centrally managed expense and discontinued operations. Credit card securitizations: Card Services' managed results excludes the impact of credit card securitizations on total net revenue, the provision for credit losses, net charge-offs and loan receivables. Through securitization, the Firm transforms a portion of its credit card receivables into securities, which are sold to investors. The credit card receivables are removed from the Consolidated Balance Sheets through the transfer of the receivables to a trust and the sale of undivided interests to investors that entitle the investors to specific cash flows generated from the credit card receivables. The Firm retains the remaining undivided interests as seller’s interests, which are recorded in loans on the Consolidated Balance Sheets. A gain or loss on the sale of credit card receivables to investors is recorded in other income. Securitization also affects the Firm’s Consolidated Statements of Income as the aggregate amount of interest income, certain fee revenue and recoveries that is in excess of the aggregate amount of interest paid to the investors, gross credit losses and other trust expense related to the securitized receivables are reclassified into credit card income in the Consolidated Statements of Income. FASB: Financial Accounting Standards Board. FIN 46(R): FASB Interpretation No. 46 (revised December 2003), “Consolidation of Variable Interest Entities, an interpretation of Accounting Research Bulletin No. 51.” FSP EITF 03-6-1: FASB Staff Position No. EITF 03-6-1 "Determining Whether Instruments Granted in Share-Based Payment Transactions Are Participating Securities." Interests in purchased receivables: Represent an ownership interest in cash flows of an underlying pool of receivables transferred by a third-party seller into a bankruptcy-remote entity, generally a trust. Investment-grade: An indication of credit quality based upon JPMorgan Chase's internal risk assessment system. “Investment-grade” generally represents a risk profile similar to a rating of a "BBB-"/"Baa3" or better, as defined by independent rating agencies. Managed basis: A non-GAAP presentation of financial results that includes reclassifications related to credit card securitizations and to present revenue on a fully taxable-equivalent basis. Management uses this non-GAAP financial measure at the segment level because it believes this provides information to enable investors to understand the underlying operational performance and trends of the particular business segment and facilitates a comparison of the business segment with the performance of competitors. Managed credit card receivables: Refers to credit card receivables on the Firm's Consolidated Balance Sheets plus credit card receivables that have been securitized. Mark-to-market exposure: A measure, at a point in time, of the value of a derivative or foreign exchange contract in the open market. When the mark-to-market value is positive, it indicates the counterparty owes JPMorgan Chase and, therefore, creates a repayment risk for the Firm. When the mark-to-market value is negative, JPMorgan Chase owes the counterparty. In this situation, the Firm does not have repayment risk. Merger costs: Reflects costs associated with the Washington Mutual and Bear Stearns mergers in 2008. MSR risk management revenue: Includes changes in MSR asset fair value due to inputs or assumptions in model and derivative valuation adjustments and other. Net yield on interest-earning assets: The average rate for interest-earning assets less the average rate paid for all sources of funds. NM: Not meaningful. Overhead ratio: Noninterest expense as a percentage of total net revenue. Principal transactions (revenue): Realized and unrealized gains and losses from trading activities (including physical commodities inventories that are accounted for at the lower of cost or fair value) and changes in fair value associated with financial instruments held by the Investment Bank for which the SFAS 159 fair value option was elected. Principal transactions revenue also include private equity gains and losses. Reported basis: Financial statements prepared under accounting principles generally accepted in the United States of America ("U.S. GAAP"). The reported basis includes the impact of credit card securitizations, but excludes the impact of taxable equivalent adjustments. SFAS: Statement of Financial Accounting Standards. SFAS 140: "Accounting for Transfers and Servicing of Financial Assets and Extinguishments of Liabilities - a replacement of FASB Statement No. 125." SFAS 141: "Business Combinations." SOP 03-3: “Accounting for Certain Loans of Debt Securities Acquired in a Transfer.” Taxable-equivalent basis: Total net revenue for each of the business segments and the Firm is presented on a tax-equivalent basis. Accordingly, revenue from tax-exempt securities and investments that receive tax credits is presented in the managed results on a basis comparable to fully taxable securities and investments. This non-GAAP financial measure allows management to assess the comparability of revenue arising from both taxable and tax-exempt sources. The corresponding income tax impact related to these items is recorded within income tax expense. Unaudited: Financial statements and information that have not been subjected to auditing procedures sufficient to permit an independent certified public accountant to express an opinion. U.S. GAAP: Accounting principles generally accepted in the United States of America. Value-at-risk: A measure of the dollar amount of potential loss from adverse market moves in an ordinary market environment. Page 37
  • 39.
    JPMORGAN CHASE &CO. Line of Business Metrics Investment Banking Retail Financial Services (continued) IB'S REVENUE COMPRISES THE FOLLOWING: MORTGAGE ORIGINATION CHANNELS COMPRISE THE FOLLOWING: 1. Investment banking fees include advisory, equity underwriting, bond underwriting and loan syndication fees. 1. Retail - Borrowers who are buying or refinancing a home through direct contact with a mortgage banker employed by the Firm using a branch office, the Internet or by phone. Borrowers are frequently referred to a mortgage banker by real estate brokers, home builders or other third parties. 2. Fixed income markets include client and portfolio management revenue related to both market-making and proprietary risk-taking across global fixed income markets, including foreign exchange, interest rate, credit and commodities markets. 3. Equities markets include client and portfolio management revenue related to market-making and proprietary risk-taking across global equity products, including cash instruments, derivatives and convertibles. 4. Credit portfolio revenue includes net interest income, fees and loan sale activity, as well as gains or losses on securities received as part of a loan restructuring, for the IB’s credit portfolio. Credit portfolio revenue also includes the results of risk management related to the Firm's lending and derivative activities, and changes in the credit valuation adjustment, which is the component of the fair value of a derivative that reflects the credit quality of the counterparty. 2. Wholesale - A third-party mortgage broker refers loan applications to a mortgage banker at the Firm. Brokers are independent loan originators that specialize in finding and counseling borrowers but do not provide funding for and do not underwrite the loans. 3. Correspondent - Correspondents are banks, thrifts, other mortgage banks and other financial institutions that sell closed loans to the Firm. 4. Correspondent negotiated transactions ("CNT") - These transactions occur when mid- to large-sized mortgage lenders, banks and bank-owned mortgage companies sell servicing to the Firm on an as-originated basis, and exclude purchased bulk servicing transactions. These transactions supplement traditional production channels and provide growth opportunities in the servicing portfolio in stable and rising-rate periods. Retail Financial Services Card Services DESCRIPTION OF SELECTED BUSINESS METRICS WITHIN RETAIL BANKING: DESCRIPTION OF SELECTED BUSINESS METRICS WITHIN CARD SERVICES: 1. Personal bankers - Retail branch office personnel who acquire, retain and expand new and existing customer relationships by assessing customer needs and recommending and selling appropriate banking products and services. 1. Charge volume - Represents the dollar amount of cardmember purchases, balance transfers and cash advance activity. 2. Net accounts opened - Includes originations, purchases and sales. 2. Sales specialists - Retail branch office personnel who specialize in the marketing of a single product, including mortgages, investments, and business banking, by partnering with the personal bankers. 3. Merchant acquiring business - Represents a business that processes bank card transactions for merchants. MORTGAGE FEES AND RELATED INCOME COMPRISE THE FOLLOWING: 4. Bank card volume - Represents the dollar amount of transactions processed for merchants. 1. Production revenue includes net gains or losses on originations and sales of prime and subprime mortgage loans and other production-related fees. 5. Total transactions - Represents the number of transactions and authorizations processed for merchants. 2. Net mortgage servicing revenue a) Servicing revenue represents all gross income earned from servicing third-party mortgage loans including stated service fees, excess service fees, late fees and other ancillary fees. b) Changes in MSR asset fair value due to: -- market-based inputs such as interest rates and volatility, as well as updates to assumptions used in the MSR valuation model. -- modeled servicing portfolio runoff (or time decay) c) Derivative valuation adjustments and other, which represents changes in the fair value of derivative instruments used to offset the impact of changes in the market-based inputs to the MSR valuation model. 3. MSR risk management results include changes in the MSR asset fair value due to inputs or assumptions and derivative valuation adjustments and other. Page 38
  • 40.
    JPMORGAN CHASE &CO. Line of Business Metrics (continued) Commercial Banking Asset Management COMMERCIAL BANKING REVENUE COMPRISES THE FOLLOWING: Assets under management: Represent assets actively managed by Asset Management on behalf of Institutional, Retail, Private Banking, Private Wealth Management and Bear Stearns Private Client Services clients. Excludes assets managed by American Century Companies, Inc., in which the Firm has a 42% ownership interest as of June 30, 2009. 1. Lending includes a variety of financing alternatives, which are primarily provided on a basis secured by receivables, inventory, equipment, real estate or other assets. Products include term loans, revolving lines of credit, bridge financing, asset-based structures and leases. 2. Treasury services includes a broad range of products and services enabling clients to transfer, invest and manage the receipt and disbursement of funds, while providing the related information reporting. These products and services include U.S. dollar and multi-currency clearing, ACH, lockbox, disbursement and reconciliation services, check deposits, other check and currency-related services, trade finance and logistics solutions, commercial card, and deposit products, sweeps and money market mutual funds. Assets under supervision: Represents assets under management as well as custody, brokerage, administration and deposit accounts. Alternative assets: The following types of assets constitute alternative investments - hedge funds, currency, real estate and private equity. AM's CLIENT SEGMENTS COMPRISE THE FOLLOWING: 3. Investment banking products provide clients with sophisticated capital-raising alternatives, as well as balance sheet and risk management tools through loan syndications, investment-grade debt, asset-backed securities, private placements, high-yield bonds, equity underwriting, advisory, interest rate derivatives, foreign exchange hedges and securities sales. DESCRIPTION OF SELECTED BUSINESS METRICS WITHIN COMMERCIAL BANKING: 1. Liability balances include deposits and deposits that are swept to on-balance sheet liabilities such as commercial paper, federal funds purchased and securities sold under repurchase agreements. 2. IB revenue, gross - Represents total revenue related to investment banking products sold to CB clients. 1. Institutional brings comprehensive global investment services - including asset management, pension analytics, asset/liability management and active risk budgeting strategies - to corporate and public institutions, endowments, foundations, not-for-profit organizations and governments worldwide. 2. Retail provides worldwide investment management services and retirement planning and administration through third-party and direct distribution of a full range of investment vehicles. 3. The Private Bank addresses every facet of wealth management for ultra-high-net-worth individuals and families worldwide, including investment management, capital markets and risk management, tax and estate planning, banking, capital raising and specialty-wealth advisory services. 4. Private Wealth Management offers high-net-worth individuals, families and business owners in the United States comprehensive wealth management solutions, including investment management, capital markets and risk management, tax and estate planning, banking, and specialty-wealth advisory services. Treasury & Securities Services Treasury & Securities Services firmwide metrics include certain TSS product revenue and liability balances reported in other lines of business related to customers who are also customers of those other lines of business. In order to capture the firmwide impact of TS and TSS products and revenue, management reviews firmwide metrics such as liability balances, revenue and overhead ratios in assessing financial performance for TSS. Firmwide metrics are necessary, in management's view, in order to understand the aggregate TSS business. 5. Bear Stearns Private Client Services provides investment advice and wealth management services to highnet-worth individuals, money managers, and small corporations. DESCRIPTION OF SELECTED BUSINESS METRICS WITHIN TREASURY & SECURITIES SERVICES: Liability balances include deposits and deposits that are swept to on-balance sheet liabilities such as commercial paper, federal funds purchased and securities loaned or sold under repurchase agreements. Page 39