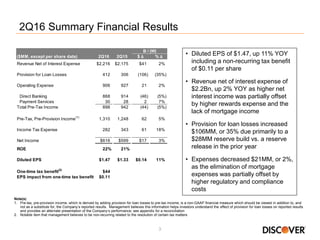
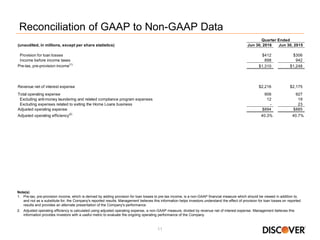
- Discover Financial reported diluted EPS of $1.47 for 2Q16, up 11% YOY, including a one-time $0.11 tax benefit. Revenue was $2.2 billion, up 2% YOY, as higher net interest income was offset by higher rewards expenses and lack of mortgage income. Provision for loan losses increased 35% to $412 million due to loan growth and a $28 million reserve build.
Discover reported financial results for full year 2016 and 4Q16. Key highlights include:
- 2016 diluted EPS grew 12% to $5.77 driven by loan growth and lower expenses.
- 4Q16 diluted EPS increased 23% to $1.40 due to higher net interest income and lower expenses.
- Loan balances and credit card sales volumes increased year-over-year for both periods. However, provision for loan losses grew due to higher net charge-offs from loan growth and seasoning.
1) Discover Financial Services is a leading direct banking and payment services company that issues credit cards, offers deposit products and unsecured personal loans. It is focused on growing its existing customer base through cross-selling additional products.
2) Discover has generated strong returns through responsible growth in lending while maintaining superior credit quality compared to large bank peers. It aims to further diversify its revenue through partnerships in payments processing.
3) The company's proprietary payment network provides valuable brand recognition and rewards customers with cashback bonuses, driving higher customer loyalty and wallet share than competitors.
- Discover Financial Services reported financial results for 3Q16 with diluted EPS up 13% year-over-year to $1.56 per share.
- Revenue was $2.3 billion, up 5% year-over-year, driven by higher net interest income partially offset by higher rewards expenses.
- Operating expenses increased 1% to $895 million due to investments in marketing and regulatory compliance staff, while credit quality remained stable.
- The company repurchased $582 million in stock and remains well capitalized with a Common Equity Tier 1 Capital Ratio of 13.8% under fully phased-in Basel III rules.
- Discover Financial reported a 31% increase in diluted EPS of $1.14 for the fourth quarter of 2015 compared to the prior year. Revenue increased 8% to $2.2 billion, though was down slightly excluding a one-time charge from 2014. The provision for loan losses rose 6% due to a larger reserve build. Expenses were flat as higher professional fees in 2015 offset one-time charges in 2014.
- For the full year 2015, revenue increased 3% while EPS grew 5% compared to 2014. Loan growth and strong credit performance contributed to results, though expenses grew due to investments in compliance. The company will focus on loan growth, expense management, and capital deployment in 2016 to continue delivering
This document contains charts showing trends in global IP traffic, mobile data traffic, global IP video traffic, and global data center traffic from 2014 to 2019. It also includes a description of a partnership between AT&T and Digital Realty to provide colocation services and connectivity. Finally, it presents a reconciliation of Telx core EBITDA and non-GAAP financial measures for the third quarter of 2016. In summary, global digital traffic is growing significantly year over year across several metrics, and the partnership combines AT&T's network capabilities with Digital Realty's colocation facilities.
Aon reported its second quarter 2016 results, with the following highlights:
- Organic revenue grew 3% in Risk Solutions and 1% in HR Solutions. Retail Brokerage delivered strong 4% organic revenue growth, with 6% growth internationally.
- Risk Solutions operating margin increased 70 basis points due to organic revenue growth, favorable foreign exchange, and investments in data/analytics. HR Solutions margin declined 40 basis points due to expenses for future growth and divestitures.
- Earnings per share improved 6%, reflecting operational improvements and capital management.
- Year-to-date free cash flow increased 51% to $660 million, driven by higher operating cash flow and lower capital expenditures.
Aon plc reported first quarter 2016 results with the following highlights:
- Organic revenue growth of 3% in both Risk Solutions and HR Solutions segments.
- Risk Solutions operating margin increased 100 basis points to 24.2% due to organic revenue growth and investments in data and analytics.
- HR Solutions operating margin decreased 140 basis points to 11.8% due to $20 million in transaction and portfolio repositioning costs.
- EPS of $1.35 was down 1% year-over-year due to unfavorable foreign exchange rates.
- Net revenue for the third quarter of fiscal year 2016 was $555 million, down 4% from the previous year. Earnings per share were $0.41 excluding special items, up 3% from the previous year.
- Free cash flow on a trailing twelve month basis was $681 million, or 31% of revenue. The company returned $170 million to shareholders in the form of dividends and share repurchases.
- Guidance for the fourth quarter of fiscal year 2016 forecasts revenue between $555-595 million and earnings per share between $0.45-0.51 excluding special items.
- Discover Financial reported a 5% increase in diluted EPS to $1.35 for Q1 2016. Revenue net of interest expense grew 2% to $2.2 billion, as loan growth offset the lack of mortgage income. Provision for loan losses increased 9% due to a higher reserve build. Expenses grew 1% as increases in compliance costs offset reductions from exiting mortgage origination. Credit quality improved with net charge-offs up 3% and delinquency rates mostly stable.
- Discover Financial Services reported their 3Q17 financial results, with key highlights including net income of $602 million, 10% revenue growth year-over-year driven by higher net interest income, and continued loan growth across all primary lending products.
- Net interest margin was up 29 basis points year-over-year to 10.28% due to increased loan yields, and return on equity remained strong at 22%.
- Credit performance trends showed a total net charge-off rate of 2.63%, up 61 basis points from the previous year, influenced by credit normalization and loan seasoning.
Synacor is a digital technology company that enables cable and telecom providers to better engage with consumers through portal experiences, email/collaboration, video platforms, and advertising solutions. The document outlines Synacor's growth strategy focused on recurring and fee-based revenue streams, and targets $300 million in revenue and $30 million in EBITDA by 2019 through winning new customers, expanding existing customer relationships, and growing advertising and open source support offerings. Financial guidance projects 2017 revenue of $160-170 million and adjusted EBITDA of $6-10 million.
Visa inc. q1 2016 financial results conference call presentationvisainc
Visa reported financial results for its fiscal first quarter of 2016, with the following key highlights:
- Net operating revenues increased 5% year-over-year to $3.6 billion.
- Net income was $1.9 billion, with adjusted net income of $1.7 billion.
- Payments volume grew 4% nominally to $1.3 trillion.
- The company repurchased $2 billion of stock and expects full year revenue growth in the high single to low double digits range.
- Discover Financial reported first quarter 2017 financial results, with diluted EPS of $1.43, up 6% year-over-year. Revenue grew 5% to $2.3 billion due to an 8% increase in net interest income, partially offset by higher rewards expense. Credit performance remained stable compared to historical levels.
The document provides an overview of TDS Telecom's fourth quarter 2016 results and strategic priorities for 2017. Key points include:
- 2016 results showed revenue impacts from competition but improvements in churn. Adjusted EBITDA was up 4% excluding discrete items.
- 2017 priorities are protecting the customer base, driving high margin revenue streams, and continuing cost improvements. Investments will focus on network quality and preparing for VoLTE deployment.
- Guidance for 2017 estimates total operating revenues of $3.8-4 billion and adjusted EBITDA of $650-800 million.
This document provides an overview of Aon plc for investors. It summarizes that Aon is an industry-leading global professional services firm focused on risk, retirement, and health operating in growing markets. It operates two industry-leading segments, Aon Hewitt and Aon Risk Solutions, which serve clients in over 120 countries. The markets of risk, retirement, and health that Aon operates in are growing in both size and complexity long-term.
Mike Salop introduces the presentation and notes that it contains forward-looking statements. The document then provides a summary of Western Union's Q4 2016 financial performance, including that GAAP revenues declined 1% while constant currency revenues increased 4%. It also notes that consumer money transfer performance was driven by strong results from westernunion.com and the U.S. business, and that settlements were reached to resolve U.S. government investigations. The presentation concludes by outlining Western Union's 2017 outlook and plans to continue strategic focus on mobile/online services and customer experience through a transformation program.
This document summarizes Principal Financial Group's first quarter 2016 earnings call. Some key points:
- Outstanding investment performance with over 90% of investment options in the top two Morningstar quartiles.
- Record assets under management of $548 billion with $3.3 billion in net cash flows for the quarter.
- Deployed $196 million in capital through share repurchases and dividends. Announced an increase in the second quarter dividend.
- Underlying fundamentals remain strong despite macroeconomic headwinds.
- Discover Financial reported quarterly net income of $546 million, down 11% year-over-year, with revenue growth of 9% and earnings per share of $1.40.
- Loan balances grew 8% year-over-year led by credit cards and personal loans, while net interest margin expanded 17 basis points.
- Operating expenses rose just 1% despite higher loan volumes, and the company executed $2.23 billion in planned capital returns including dividend increases and share repurchases.
- Credit performance trends showed net charge-off rates increasing compared to a year ago but within expectations.
- Visa reported fiscal third quarter 2016 financial results, with net operating revenues up 3% to $3.6 billion compared to the prior year. Volume and processed transactions also increased year-over-year.
- Notable highlights included solid payments volume and transaction growth, share repurchases totaling $1.7 billion, and an adjusted operating margin of 68%.
- For fiscal year 2016, Visa expects net revenue growth of 7-8% excluding Europe and an incremental 3-4% including Europe, as well as low double-digit constant dollar growth in adjusted earnings per share.
This document provides an overview of Belden, a global signal transmission solutions company. It discusses Belden's five business platforms that deliver innovative connectivity solutions for broadcast, enterprise, industrial, and network security applications. It highlights Belden's financial performance over time, including improvements in EBITDA margin, return on invested capital, and free cash flow. The document also outlines Belden's strategy for capital deployment, including investing in innovation, acquisitions, and share repurchases. Finally, it provides guidance for Q2 and full year 2016 revenues and earnings per share.
Nielsen reported first quarter 2016 results with the following highlights:
- Revenue increased 5.2% to $1.5 billion driven by growth in both Watch and Buy segments.
- Adjusted EBITDA increased 7.2% to $402 million and margins expanded.
- Adjusted net income per share increased 10.9% to $0.51.
- The company reiterated full year 2016 guidance for revenue growth and adjusted EBITDA margin expansion.
Visa inc. Q3 2017 financial results conference call presentationvisainc
Visa reported strong fiscal third quarter 2017 financial results, with net income of $2.1 billion and net operating revenue growth of 26%. Payments volume grew 25% nominally, driven by inclusion of Europe and continued growth. Visa returned $2.1 billion to shareholders in the form of share repurchases and dividends. For fiscal full-year 2017, Visa expects net revenue growth of approximately 20% and operating margin in the mid-60s.
The document provides a reconciliation of core EBITDA for a company. It shows the company had a net loss of $8.2 million for the quarter. After accounting for taxes, interest, depreciation, and amortization, EBITDA was $32.7 million. Additional adjustments including non-cash rent, compensation, and expenses resulted in a core EBITDA of $39.2 million for the quarter.
Visa inc. q1 2017 financial results conference call presentationvisainc
Visa Inc. reported fiscal first quarter 2017 financial results. Key highlights include:
- Net operating revenues increased 25% to $4.5 billion.
- Adjusted net income grew 23% and diluted EPS increased 23%.
- Payments volume excluding Europe co-badge increased 38% on a nominal and constant basis.
- The company repurchased $1.8 billion of stock during the quarter.
BGC Partners reported financial results for the second quarter of 2016. Revenues declined slightly year-over-year but pre-tax and post-tax distributable earnings increased due to improved margins. The financial services segment saw higher pre-tax profits and margins despite the sale of the Trayport business, driven by growth in fully electronic trading. BGC completed its acquisition of Sunrise Brokers Group and CRE Group to expand its offerings.
- Discover Financial reported full year 2017 net income of $2.1 billion and diluted EPS of $5.42, with a return on equity of 19%. Excluding non-recurring charges related to tax reform, diluted EPS was $5.98.
- For 4Q17, net income was $387 million and diluted EPS was $0.99. Revenue grew 11% year-over-year to $2.6 billion due to higher net interest income. Credit performance continued to normalize with a total net charge-off rate of 2.85%.
- Total loans grew 9% year-over-year to $84.2 billion as all lending products saw strong origination volumes. The company returned
The document is an investor presentation for Canadian Tire Corporation that provides an overview of the company and its various business segments. It discusses the company's strengths, growth plans, and financial highlights for its retail banners (Canadian Tire, FGL Sports, and Mark's), CT REIT, and Canadian Tire Bank. The presentation outlines strategies to strengthen its core retail businesses, engage younger customers, expand digital capabilities, and pursue growth opportunities across its brands and real estate portfolio.
Visa inc. q2 2017 financial results conference call presentationvisainc
- Visa reported strong fiscal second quarter 2017 financial results, with adjusted net income of $2.1 billion excluding special items related to the Visa Europe reorganization.
- Net operating revenue increased 23% to $4.5 billion, driven by the inclusion of Europe and continued growth in payments volume, cross-border volume, and processed transactions.
- The company returned approximately $2.1 billion to shareholders in the form of share repurchases and dividends in the fiscal second quarter.
The document outlines several reasons why tourists should visit the Transcarpathia region of Ukraine, including its hospitable people, millennia of culture influenced by Eastern and Western traditions, untouched natural beauty featuring mountains, valleys, rivers and lakes, mineral water springs that offer health benefits, nationally protected parks and reserves showcasing unique landscapes and biodiversity, vibrant folk art, facilities and activities for an active lifestyle, delicious local cuisine and drinks, and opportunities to purchase unique crafts and gifts as souvenirs.
The File connector allows Mule applications to exchange files with a file system. It can be used as an inbound endpoint, acting as a message source that triggers flows when new files are received, or as an outbound endpoint to pass files to a file system. When used as an inbound endpoint, the File connector polls a directory at a specified frequency and moves processed files based on configurable filters and patterns.
This document summarizes a conference session on componentizing code for an English to Pig Latin translator application. The session will involve building a new feature of the translator, reviewing the code, discussing characteristics of componentized code, and refactoring the code into components. The translator currently handles simple words, words starting with vowels, and words starting with "qu" with switch statements. The session will advocate refactoring these features into polymorphic components using interfaces and delegates to make the code more maintainable and extensible.
Este documento presenta un taller práctico sobre 10 claves para la implementación de tendencias y enfoques innovadores. El taller busca que los docentes identifiquen los cambios necesarios para incorporar las TIC al aula y currículo. El taller aborda temas como nuevas habilidades del siglo 21, políticas de acceso a TIC e innovación educativa. El documento propone ejercicios para que los docentes analicen estas temáticas y desarrollen 10 claves esenciales para implementar enfoques innovadores en sus prácticas.
The nervous system is divided into the central nervous system (CNS) and peripheral nervous system (PNS). The CNS includes the brain and spinal cord. The PNS includes nerves connecting the CNS to other parts of the body. The PNS is further divided into the somatic and autonomic nervous systems. The autonomic nervous system regulates involuntary body functions and is divided into the sympathetic and parasympathetic nervous systems. The brain contains several parts that each have specific functions like processing sensory information, motor control, and regulating homeostasis. Neurons transmit signals as electrical impulses through a process involving ion exchanges across the cell membrane.
El taller práctico: 10 claves para la implementación de tendencias y enfoques innovadores, tiene como propósito que los docentes identifiquen el cambio paradigmático que se requiere para atender al desafío pedagógico que implica incorporar las Tecnologías de la Información y la Comunicación (TIC) al aula y al currículo escolar.
- Will is advising Jill on the importance and benefits of writing testimonials for networking purposes. He outlines the "5 Ss" that make for an effective testimonial: specific, short, sizzling, stamped, and signed.
- Jill provides Will with a draft testimonial that he critiques and improves upon by making it more targeted, compelling, and professional-looking.
- Will then explains to Jill that to maximize the benefits of testimonials, she should share them widely on her website, social media, publications, and more. He emphasizes that just asking for testimonials is the best approach.
A role within the Anypoint Platform is a set of pre-defined permissions for each different product within the Platform.
Depending on the product, you can find pre-defined roles with their standard permissions, or you can customize your own permissions for each role.
The Access Management section grants you a space in which you can create Roles for the products to which you own the appropriate entitlements.
Pairwise testing has become an indispensable tool in a software tester’s toolbox. This presentation pays special attention to usability of the pairwise testing technique. In particular, it focuses on ways in which the pure pairwise-testing approach must be modified to become practically applicable, and on the features that tools must offer to support the tester who is trying to use pairwise testing in practice.
A power team in BNI consists of a minimum of 4 non-competing businesses that work together to generate more business opportunities. It is like a cricket team where each member contributes unique strengths. Benefits include increased talent collaboration, contacts, knowledge sharing, marketing and business synergy. New power teams need a minimum of 4 members and to meet at least once every 8 weeks to be formally recognized. The team leader needs to take initiative and core members tend to be more experienced BNI members. Working together in a power team can lead to success through continued cooperation.
Curtiss-Wright reported third quarter 2016 financial results with diluted EPS of $1.02, ahead of expectations. Operating income increased 20% and operating margin increased 300 basis points to 15.1% compared to the third quarter of 2015. Net sales decreased 4% due to continued industrial and nuclear aftermarket headwinds. For full-year 2016, Curtiss-Wright raised operating margin guidance to 14.3-14.5% while maintaining diluted EPS guidance of $4.00-$4.15 and free cash flow guidance of $300-$320 million.
Curtiss-Wright First Quarter 2016 Financial Resultsq4curtisswright
The document provides an earnings conference call summary and outlook for Curtiss-Wright Corporation for 1Q 2016 and full year 2016. Some key points:
- 1Q 2016 EPS of $0.73, ahead of expectations, with lower costs and strong free cash flow of $61M. However, sales decreased 8% due to weaker industrial markets.
- Full year 2016 guidance expects sales growth of -1% to 1% with operating margin expansion to 14.0-14.2% through cost savings and improving defense and power markets.
- The outlook expects solid earnings growth of 7-11% and continued strong free cash flow of $290-310M through ongoing initiatives and AP1000 reactor component sales.
"Теоретические и прикладные аспекты трофологии в клинической медицине" Луфт ...rnw-aspen
Доклад с XVI Межрегиональной научно-практической конференции "Искусственное питание и инфузионная терапия больных в медицине критических состояний" 21-22 апреля 2016 г.
CloudHub is MuleSoft's integration platform that provides a multi-tenant, secure, and elastic environment for running integrations. It has two major components - platform services which coordinate deployment and monitoring, and worker clouds which run integration applications in isolated containers across regions. Applications are deployed via the Runtime Manager console and run on workers that can be scaled based on processing needs. Workers and platform services work together to provide high availability and security in a multi-tenant environment.
Scania Interim Report January – June 2016Scania Group
Summary of the first six months of 2016
* Operating income amounted to SEK 1,348 m. (4,737), negatively impacted by a provision of SEK 3.8 billion related to the European Commission’s competition investigation
* Operating income excluding items affecting comparability rose by 9 percent to SEK 5,148 m. (4,737), resulting in an operating margin of 10.3 (10.1) percent
* Net sales rose by 7 percent to SEK 50,110 m. (46,798)
* Cash flow amounted to SEK -492 m. (1,106) in Vehicles and Services
Scania interim report january september 2016Scania Group
Scania’s sales reached SEK 75.2 billion in the first nine months of 2016 and the company’s underlying operational performance was strong. Higher vehicle volume in Europe and increased service revenue was partly offset by negative currency rate effects and lower deliveries in Latin America.
- Discover Financial Services reported quarterly financial results, with net income of $669 million and diluted EPS of $1.91, up 36% year-over-year. Total loans grew 9% driven by a 10% increase in credit card loans.
- The total NCO rate was 3.11%, up 40 basis points from the prior year, due to credit normalization and loan seasoning. However, credit performance remains strong due to disciplined underwriting.
- The company returned $656 million to shareholders in the form of dividends and share repurchases during the quarter.
- Discover Financial Services reported quarterly financial results for 1Q18 with the following highlights:
- Net income of $666 million, up 18% year-over-year, with diluted EPS of $1.82.
- Total loan growth of 9% led by a 10% increase in credit card loans. Revenue grew 10% to $2.6 billion driven by higher net interest income.
- The net interest margin on loans increased 16 basis points to 10.23% compared to a year ago.
The document reports on the bank's 2Q16 earnings results. It discusses solid business performance in a challenging quarter, with total quarterly credit disbursements up and stable net margins. However, net profit decreased QoQ due to higher credit provisions to address isolated restructuring cases and recovery efforts. Asset quality remains strong and the syndications platform executed five new deals in Q2. The outlook for the remainder of the year is positive with economic stabilization and projected portfolio growth of around 3% for 2016 and stable net interest margin of around 2%. Key financial metrics such as earnings per share, return on equity and assets, efficiency ratio and capital ratios are reported.
The document summarizes JPMorgan Chase's financial results for the first quarter of 2011. Key highlights include:
- Net income of $5.6 billion and earnings per share of $1.28.
- Card Services reported net income of $1.3 billion compared to a net loss in the prior year, driven by lower credit costs.
- The Investment Bank reported net income of $2.4 billion on revenues of $8.2 billion, with strong fixed income and equity markets revenue.
- Retail Financial Services reported a net loss of $937 million in its mortgage banking business due to losses from mortgage servicing rights.
The document summarizes JPMorgan Chase's financial results for the first quarter of 2011. Key highlights include:
- Net income of $5.6 billion and earnings per share of $1.28. Revenue was $25.8 billion.
- Significant items that impacted results were a $2 billion benefit from lower credit card loan loss reserves, a $1.1 billion loss from mortgage servicing rights adjustments, and a $650 million expense for estimated foreclosure costs.
- The balance sheet was strengthened with a Basel I Tier 1 Common ratio of 10% and estimated Basel III Tier 1 Common of 7.3%. Credit reserves totaled $30.4 billion.
The document summarizes JPMorgan Chase's financial results for the first quarter of 2011. Key highlights include:
- Net income of $5.6 billion and earnings per share of $1.28. Revenue was $25.8 billion.
- Significant items that impacted results were a $2 billion benefit from reduced credit card loan loss reserves in Card Services, a $1.1 billion loss from mortgage servicing rights asset adjustments in Retail Financial Services, and a $650 million expense for estimated costs of foreclosure matters in Retail Financial Services.
- The Investment Bank generated net income of $2.4 billion on revenue of $8.2 billion, with strong performance in fixed income and
1. In 2Q11, JPMorgan Chase reported net income of $5.4 billion on revenue of $27.4 billion, with EPS of $1.27 per share.
2. Significant items impacting results included a $1 billion benefit from reduced loan loss reserves in Card Services, $620 million in securities gains in Corporate, a $1 billion expense for estimated foreclosure costs in Retail Financial Services, and $787 million in additional litigation reserves in Corporate.
3. The Investment Bank reported net income of $2.1 billion on revenue of $7.3 billion, with strong performance across most businesses. Retail Financial Services reported a net loss of $454 million due to
EOP Loans & Leases
Avg Deposits
FINANCIAL RESULTS
1
Actual numbers for all periods, not over/under
2 Calculated based on average equity; 3Q09 average equity was $2B
3 Excludes loans held-for-sale and loans at fair value
4 Calculated based on average equity; 3Q09 average equity was $2B
8
Total revenue of $1.5B up 4% YoY driven by growth in
Middle Market Banking and Real Estate Banking, partially
offset by lower Commercial Term Lending revenue
Credit costs of $43mm reflect higher net charge-offs
Expense up 10
EOP Loans & Leases
Avg Deposits
FINANCIAL RESULTS
1
Actual numbers for all periods, not over/under
2 Calculated based on average equity; 3Q09 average equity was $2B
3 Excludes loans held-for-sale and loans at fair value
4 Calculated based on average equity; 3Q09 average equity was $2B
8
Total revenue of $1.5B up 335% YoY driven by the
impact of the WaMu transaction and wider loan spreads
Middle Market Banking revenue up $729mm YoY due to
the WaMu transaction
Credit costs of $43mm reflect higher net
The bank reported financial results for the first quarter of 2016, with business profit increasing 11% quarter-over-quarter and 2% year-over-year. Net profit increased 1% quarter-over-quarter but decreased 22% year-over-year due to negative non-core results from investment funds. Higher interest rates increased net interest income and margins. Credit quality remained stable with non-performing loans at 0.43% and allowance coverage of 3.4 times non-performing loans. Operating expenses decreased while efficiency ratios improved. Return on equity decreased from prior periods due to non-core investment fund results.
- The bank reported business net income of $78.0 million for 9M15, a 7% increase over the same period last year, driven by a 5% increase in net interest income from higher loan balances.
- Net income was $82.7 million for 9M15, a 17% increase over 9M14, which includes non-core income from participation in investment funds.
- Asset quality remains strong, with non-accrual loans representing only 0.31% of the total loan portfolio and reserves covering non-accrual loans 4.5 times.
Bladex presentación de llamada en conferencia 3 trim15 (inglés)Bladex
- The bank reported business net income of $78.0 million for 9M15, a 7% increase over the same period last year, driven by a 5% increase in net interest income from higher loan balances.
- Net income was $82.7 million for 9M15, a 17% increase over 9M14, which includes non-core income from participation in investment funds.
- Asset quality remains strong, with non-accrual loans representing only 0.31% of the total loan portfolio and reserves covering non-accrual loans 4.5 times.
- Hancock reported improved financial results for the first quarter of 2014, with operating expenses declining 6% linked-quarter and the efficiency ratio improving to 62%.
- Net loans increased $231 million linked-quarter, driven primarily by growth in commercial and industrial loans.
- Asset quality metrics continued to improve with a reduction in non-performing assets and net charge-offs.
The document summarizes Banco Latinoamericano de Comercio Exterior, S.A.'s (Bladex) unaudited financial results for the year ended December 31, 2015. Key highlights include:
- Net income increased 2% year-over-year to $104 million, driven by higher revenues and lower expenses partially offset by higher credit loss provisions.
- Business net income, which excludes non-core gains/losses, was flat at $99 million year-over-year.
- The commercial loan portfolio grew 3% to $7.2 billion, with growth focused in Central America and the Caribbean.
- Credit quality remained strong with non-performing loans covered
- In 3Q11, JPMorgan Chase reported net income of $4.3 billion and earnings per share of $1.02. Revenue for the quarter was $24.4 billion.
- The Investment Bank contributed net income of $1.6 billion on revenue of $6.4 billion, which included $1.9 billion in DVA gains.
- Retail Financial Services reported net income of $1.2 billion, with credit costs of $1 billion reflecting continued losses in mortgage and home equity portfolios.
- Mortgage Production and Servicing reported net income of $205 million, with production revenue of $1.3 billion and servicing revenue of $1.2 billion
The bank reported strong financial results in 2Q23, with net income of $37.1 million, up 61% YoY. Return on equity was 13.4%, up from 9.1% in 2Q22. Total assets grew to $10.1 billion, up 14% YoY. Net interest margin expanded to 2.42% from 1.54% YoY due to higher interest rates. Fees also increased 52% YoY driven by growth in letters of credit. Asset quality remained strong with non-performing loans at 0.1% of total loans. The bank expects to maintain double-digit ROE and net interest margin above 2022 levels for the full year.
Bank of America reported record earnings of $16.9 billion for 2005, up 19% from 2004. Revenue grew 9% to $57.6 billion driven by a 19% increase in noninterest income. Earnings were driven by strong consumer growth and commercial lending recovery, despite higher provision costs and fewer securities gains. For the fourth quarter of 2005, earnings were $3.8 billion, down 9% from the previous quarter due to an 8% decline in noninterest income and a 21% rise in provision for credit losses.
Morgan Stanley Dean Witter reported record quarterly operating results for Q2 1999, with net income up 35% to $1.15 billion and diluted EPS up 42% to $1.95 per share. Net revenues increased 23% to $5.7 billion, driven by strong performances across institutional securities, investment banking, and private client businesses. The company also saw improved credit quality and higher transaction volume in its credit services segment. Overall, Morgan Stanley Dean Witter had another very successful quarter with significant revenue and earnings growth across all business lines.
JPMorgan Chase reported third quarter 2010 net income of $4.4 billion. Key highlights included a $930 million reduction to loan loss reserves in card services and increases of $776 million and $622 million to litigation and mortgage repurchase reserves, respectively. Several business segments reported solid results, with the investment bank ranked number one for the year in global fees and the retail bank seeing growth in deposits and mortgage originations. Credit costs declined across most businesses from reduced charge-offs.
Similar to Second quarter 2016 earnings presentation (20)
The E-Way Bill revolutionizes logistics by digitizing the documentation of goods transport, ensuring transparency, tax compliance, and streamlined processes. This mandatory, electronic system reduces delays, enhances accountability, and combats tax evasion, benefiting businesses and authorities alike. Embrace the E-Way Bill for efficient, reliable transportation operations.
Cleades Robinson, a respected leader in Philadelphia's police force, is known for his diplomatic and tactful approach, fostering a strong community rapport.
MUTUAL FUNDS (ICICI Prudential Mutual Fund) BY JAMES RODRIGUESWilliamRodrigues148
Mutual funds are investment vehicles that pool money from multiple investors to purchase a diversified portfolio of stocks, bonds, or other securities. They are managed by professional portfolio managers or investment companies who make investment decisions on behalf of the fund's investors.
World economy charts case study presented by a Big 4
World economy charts case
World economy charts case study presented by a Big 4
World economy charts case study presented by a Big 4World economy charts case study presented by a Big 4
World economy charts case study presented by a Big 4
World economy charts case study presented by a Big 4World economy charts case study presented by a Big 4World economy charts case study presented by a Big 4World economy charts case study presented by a Big 4World economy charts case study presented by a Big 4World economy charts case study presented by a Big 4World economy charts case study presented by a Big 4World economy charts case study presented by a Big 4World economy charts case study presented by a Big 4World economy charts case study presented by a Big 4World economy charts case study presented by a Big 4World economy charts case study presented by a Big 4World economy charts case study presented by a Big 4World economy charts case study presented by a Big 4study presented by a Big 4
2. 2
Notice
The following slides are part of a presentation by Discover Financial Services (the "Company") in connection with
reporting quarterly financial results and are intended to be viewed as part of that presentation. No representation is made
that the information in these slides is complete. For additional financial, statistical, and business related information, as
well as information regarding business and segment trends, see the earnings release and financial supplement included
as exhibits to the Company’s Current Report on Form 8-K filed today and available on the Company’s website
(www.discover.com) and the SEC’s website (www.sec.gov).
The information provided herein includes certain non-GAAP financial measures. The reconciliations of such measures to
the comparable GAAP figures are included at the end of this presentation, which is available on the Company’s website
and the SEC’s website.
The presentation contains forward-looking statements. You are cautioned not to place undue reliance on forward-looking
statements, which speak only as of the date on which they are made, which reflect management’s estimates,
projections, expectations or beliefs at that time, and which are subject to risks and uncertainties that may cause actual
results to differ materially. For a discussion of certain risks and uncertainties that may affect the future results of the
Company, please see "Special Note Regarding Forward-Looking Statements," "Risk Factors," "Business – Competition,"
"Business – Supervision and Regulation" and "Management’s Discussion and Analysis of Financial Condition and
Results of Operations" in the Company’s Annual Report on Form 10-K for the year ended December 31, 2015, and
under “Management’s Discussion and Analysis of Financial Condition and Results of Operations” in the company’s
Quarterly Report on Form 10-Q for the quarter ended March 31, 2016, which are filed with the SEC and available at the
SEC's website (www.sec.gov). The Company does not undertake to update or revise forward-looking statements as
more information becomes available.
3. 3
2Q16 Summary Financial Results
• Diluted EPS of $1.47, up 11% YOY
including a non-recurring tax benefit
of $0.11 per share
• Revenue net of interest expense of
$2.2Bn, up 2% YOY as higher net
interest income was partially offset
by higher rewards expense and the
lack of mortgage income
• Provision for loan losses increased
$106MM, or 35% due primarily to a
$28MM reserve build vs. a reserve
release in the prior year
• Expenses decreased $21MM, or 2%,
as the elimination of mortgage
expenses was partially offset by
higher regulatory and compliance
costs
Note(s)
1. Pre-tax, pre-provision income, which is derived by adding provision for loan losses to pre-tax income, is a non-GAAP financial measure which should be viewed in addition to, and
not as a substitute for, the Company’s reported results. Management believes this information helps investors understand the effect of provision for loan losses on reported results
and provides an alternate presentation of the Company’s performance; see appendix for a reconciliation
2. Notable item that management believes to be non-recurring related to the resolution of certain tax matters
($MM, except per share data) 2Q16 2Q15 $ ∆ % ∆
Revenue Net of Interest Expense $2,216 $2,175 $41 2%
Provision for Loan Losses 412 306 (106) (35%)
Operating Expense 906 927 21 2%
Direct Banking 868 914 (46) (5%)
Payment Services 30 28 2 7%
Total Pre-Tax Income 898 942 (44) (5%)
Pre-Tax, Pre-Provision Income(1)
1,310 1,248 62 5%
Income Tax Expense 282 343 61 18%
Net Income $616 $599 $17 3%
ROE 22% 21%
Diluted EPS $1.47 $1.33 $0.14 11%
One-time tax benefit(2)
$44
EPS impact from one-time tax benefit $0.11
B / (W)
4. 4
$69.0
$54.9
$8.5
$5.2
$71.9
$57.2
$8.7
$5.7
Total Card Student Personal
2Q15 2Q16
$31.1
$37.2
$6.8
$3.5
$31.8
$33.9
$7.2
$3.7
Proprietary PULSE Diners
Network
Partners
2Q15 2Q16
2Q16 Loan and Volume Growth
Ending Loans ($Bn) Volume ($Bn)
+4% +4% +2% +10% +2% -9% +6% +5%
Note(s)
1. Volume is derived from data provided by licensees for Diners Club branded cards issued outside of North America and is subject to subsequent revision or amendment
(1)
Total Payments Volume down 3% YOY
5. 5
2Q16 Revenue Detail
• Net interest income of $1.8Bn, up 7%
YOY due primarily to loan growth and
higher net interest margin
• Discount and interchange revenue of
$636MM, up 4% YOY driven primarily
by an increase in card sales
• Rewards rate increased 16bps YOY
driven by higher promotional rewards,
primarily double rewards for new
accounts
• Protection products revenue of
$59MM, down 13% YOY due to the
prior suspension of new product sales
• Other income decreased by $30MM
primarily due to the absence of
$28MM in mortgage origination
revenue as the business was exited
last year
Note(s)
1. Rewards cost divided by Discover card sales volume
($MM) 2Q16 2Q15 $ ∆ % ∆
Interest Income $2,090 $1,947 $143 7%
Interest Expense 339 311 (28) (9%)
Net Interest Income 1,751 1,636 115 7%
Discount/Interchange Revenue 636 612 24 4%
Rewards Cost 371 314 (57) (18%)
Net Discount/Interchange Revenue 265 298 (33) (11%)
Protection Products Revenue 59 68 (9) (13%)
Loan Fee Income 79 80 (1) (1%)
Transaction Processing Revenue 39 40 (1) (3%)
Other Income 23 53 (30) (57%)
Total Non-Interest Income 465 539 (74) (14%)
Revenue Net of Interest Expense $2,216 $2,175 $41 2%
Direct Banking $2,147 $2,104 $43 2%
Payment Services 69 71 (2) (3%)
Revenue Net of Interest Expense $2,216 $2,175 $41 2%
($MM) 2Q16 2Q15 QOQ YOY
Discover Card Sales Volume $30,702 $30,017 11% 2%
Rewards Rate(1)
1.21% 1.05% 15 bps 16 bps
B / (W)
Change
6. 6
2Q16 Net Interest Margin
• Net interest margin on receivables
increased 31bps YOY due to higher
total yield partially offset by higher
funding costs
• Total interest yield of 11.72%
increased 37bps YOY driven
primarily by higher card yield
• Credit card yield increased 38bps
YOY due to portfolio mix and the
prime rate increase
• Average direct to consumer and
affinity deposits grew 14% YOY and
made up 46% of total funding
• Funding costs on interest-bearing
liabilities increased 8bps YOY to
1.88% primarily due to higher market
rates and funding mix
Average Average
($MM) Balance Rate Balance Rate
Credit Card $56,124 12.42% $53,987 12.04%
Private Student 8,816 7.13% 8,597 6.91%
Personal 5,608 12.25% 5,131 12.12%
Other 262 5.04% 385 4.62%
Total Loans 70,810 11.72% 68,100 11.35%
Other Interest-Earning Assets 14,562 0.71% 13,905 0.56%
Total Interest-Earning Assets $85,372 9.84% $82,005 9.52%
Direct to Consumer and Affinity $33,215 1.22% $29,194 1.23%
Brokered Deposits and Other 14,740 1.78% 16,840 1.55%
Interest Bearing Deposits 47,955 1.39% 46,034 1.35%
Borrowings 24,621 2.82% 23,461 2.67%
Total Interest-Bearing Liabilities $72,576 1.88% $69,495 1.80%
(%) 2Q16 QOQ YOY
Total Interest Yield 11.72% 3 bps 37 bps
NIM on Receivables 9.94% - 31 bps
NIM on Interest-Earning Assets 8.25% -2 bps 25 bps
Change
2Q16 2Q15
7. 7
2Q16 Operating Expense Detail
• Employee compensation and
benefits of $340MM, up 4% YOY
primarily due to higher regulatory
and compliance staffing as well as
higher salaries
• Professional fees of $150MM, down
2% YOY. Look back related anti-
money laundering remediation
expenses were $12MM in 2Q16 vs.
$19MM in 2Q15
• Other expense of $106MM, down
22% YOY largely due to the $23MM
in expenses related to exiting the
Home Loans business in 2Q15
• In total, prior year mortgage
expenses including restructuring
charges were $62MM
Note(s)
1. Defined as reported total operating expense divided by revenue net of interest expense
2. 2Q16 operating efficiency adjusted for $12 million in look back related anti-money laundering remediation expenses. 2Q15 operating efficiency adjusted for $23 million associated
with the closure of the Home Loans business and $19 million anti-money laundering and related compliance program enhancement expenses; see appendix for a reconciliation.
Management believes adjusted operating efficiency, which is a non-GAAP measure, provides investors with a useful metric to evaluate the ongoing operating performance of the
Company
($MM) 2Q16 2Q15 $ ∆ % ∆
Employee Compensation and Benefits $340 $326 ($14) (4%)
Marketing and Business Development 198 199 1 1%
Information Processing & Communications 89 90 1 1%
Professional Fees 150 153 3 2%
Premises and Equipment 23 23 - -
Other Expense 106 136 30 22%
Total Operating Expense $906 $927 $21 2%
Direct Banking $868 $884 $16 2%
Payment Services 38 43 5 12%
Total Operating Expense $906 $927 $21 2%
Operating Efficiency(1)
40.9% 42.6% 170 bps
Adjusted Operating Efficiency(2)
40.3% 40.7% 40 bps
B / (W)
8. 8
2Q16 Provision for Loan Losses and Credit Quality
• Net charge-offs of $384MM, up 11%
YOY and reserve build of $28MM
both primarily due to loan growth
• Card net charge-off rate increased
11bps YOY to 2.39%
• Card 30+ day delinquency rate of
1.63% increased 8bps YOY
• Student loan net charge-off rate
excluding PCI loans of 1.10%, up
8bps YOY
• Personal loan net charge-off rate of
2.38%, up 28bps YOY
Note(s)
1. Excludes PCI loans which are accounted for on a pooled basis. Since a pool is accounted for as a single asset with a single composite interest rate and aggregate expectation of
cash flows, the past-due status of a pool, or that of the individual loans within a pool, is not meaningful. Because the Company is recognizing interest income on a pool of loans,
it is all considered to be performing
($MM) 2Q16 2Q15 $ ∆ % ∆
Net Principal Charge-off $384 $347 ($37) (11%)
Reserve Changes build/(release) 28 (41) (69) NM
Total Provision for Loan Loss $412 $306 ($106) (35%)
(%) 2Q16 QOQ YOY
Credit Card Loans
Gross Principal Charge-off Rate 3.21% 6 bps 7 bps
Net Principal Charge-off Rate 2.39% 5 bps 11 bps
30-Day Delinquency Rate 1.63% -5 bps 8 bps
Reserve Rate 2.80% -6 bps 18 bps
Private Student Loans
Net Principal Charge-off Rate (excl. PCI Loans)(1)
1.10% 25 bps 8 bps
30-Day Delinquency Rate (excl. PCI Loans)(1)
1.88% -4 bps 10 bps
Reserve Rate (excl. PCI Loans)(1)
1.95% 9 bps -28 bps
Personal Loans
Net Principal Charge-off Rate 2.38% -7 bps 28 bps
30-Day Delinquency Rate 1.02% 5 bps 31 bps
Reserve Rate 3.07% 8 bps 53 bps
Total Loans
Gross Principal Charge-off Rate (excl. PCI Loans)(1)
2.99% 7 bps 8 bps
Net Principal Charge-off Rate (excl. PCI Loans)(1)
2.27% 6 bps 11 bps
30-Day Delinquency Rate (excl. PCI Loans)(1)
1.60% -4 bps 11 bps
Reserve Rate (excl. PCI Loans)(1)
2.77% -3 bps 17 bps
B / (W)
Change
9. 9
Capital Position
Capital Ratios
Note(s)
1. Common Equity Tier 1 Capital Ratio (Basel III Fully Phased-in) is calculated using Basel III Fully Phased-in Common Equity Tier 1 Capital, a non-GAAP measure. The Company
believes that the Common Equity Tier 1 Capital Ratio based on Fully Phased-in Basel III rules is an important complement to the existing capital ratios and for comparability to
other financial institutions. For the corresponding reconciliation of Common Equity Tier 1 Capital and risk weighted assets calculated under Fully Phased-in Basel III rules to
Common Equity Tier 1 Capital and risk weighted assets calculated under Basel III transition rules, see appendix
• Common Equity Tier 1 Capital Ratio
(Basel III fully phased-in) of 14.2%
• Received non-objection from Federal
Reserve for proposed capital actions
from 7/1/2016 through 6/30/17
- Increased quarterly common
dividend from $0.28 to $0.30 per
share on 7/14/16
- Gross repurchases of up to $1.95Bn
of common stock through four
quarters
2Q16 1Q16 2Q15
Total Risk Based Capital Ratio 16.7% 16.8% 17.2%
Tier 1 Risk Based Capital Ratio 15.0% 15.0% 15.3%
Tier 1 Leverage Ratio 12.8% 12.8% 13.2%
Common Equity Tier 1 Capital Ratio 14.3% 14.3% 14.5%
Common Equity Tier 1 Capital Ratio
(1)
14.2% 14.2% 14.4%
Basel III Fully Phased-in
Basel III Transition
11. 11
Reconciliation of GAAP to Non-GAAP Data
Note(s)
1. Pre-tax, pre-provision income, which is derived by adding provision for loan losses to pre-tax income, is a non-GAAP financial measure which should be viewed in addition to,
and not as a substitute for, the Company's reported results. Management believes this information helps investors understand the effect of provision for loan losses on reported
results and provides an alternate presentation of the Company's performance
2. Adjusted operating efficiency is calculated using adjusted operating expense, a non-GAAP measure, divided by revenue net of interest expense. Management believes this
information provides investors with a useful metric to evaluate the ongoing operating performance of the Company
(unaudited, in millions, except per share statistics) Jun 30, 2016 Jun 30, 2015
Provision for loan losses $412 $306
Income before income taxes 898 942
Pre-tax, pre-provision income(1)
$1,310 $1,248
Revenue net of interest expense $2,216 $2,175
Total operating expense 906 927
Excluding anti-money laundering and related compliance program expenses 12 19
Excluding expenses related to exiting the Home Loans business - 23
Adjusted operating expense $894 $885
Adjusted operating efficiency(2)
40.3% 40.7%
Quarter Ended
12. 12
Reconciliation of GAAP to Non-GAAP Data (cont’d)
Note(s)
1. Tangible Common Equity ("TCE"), a non-GAAP financial measure, represents common equity less goodwill and intangibles. A reconciliation of TCE to common equity, a GAAP
financial measure, is shown above. Other financial services companies may also use TCE and definitions may vary, so users of this information are advised to exercise caution
in comparing TCE of different companies. TCE is included because management believes that common equity excluding goodwill and intangibles is a more meaningful
measure to investors of the true net asset value of the Company
2. Adjustments related to capital components for fully phased-in Basel III include the phase-in of the intangible asset exclusion
3. Key differences under fully phased-in Basel III rules in the calculation of risk weighted assets include higher risk weighting for past due loans and unfunded commitments
4. Common Equity Tier 1 Capital Ratio (Basel III Fully Phased-in) is calculated using Common Equity Tier 1 Capital (Basel III Fully Phased-in), a non-GAAP measure, divided by
Risk Weighted Assets (Basel III Fully Phased-in)
(unaudited, in millions) Jun 30, 2016 Mar 31, 2016 Jun 30, 2015
GAAP Total Common Equity $10,837 $10,756 $10,703
Less: Goodwill (255) (255) (255)
Less: Intangibles (167) (167) (170)
Tangible Common Equity(1)
$10,415 $10,334 $10,278
Common Equity Tier 1 Capital (Basel III Transition) $10,677 $10,593 $10,552
Adjustments Related to Capital Components During Transition(2)
(53) (54) (83)
Common Equity Tier 1 Capital (Basel III Fully Phased-in) $10,624 $10,539 $10,469
Risk Weighted Assets (Basel III Transition) $74,892 $74,205 $72,658
Risk Weighted Assets (Basel III Fully Phased-in)(3)
$74,824 $74,137 $72,555
Common Equity Tier 1 Capital Ratio (Basel III Transition) 14.3% 14.3% 14.5%
Common Equity Tier 1 Capital Ratio (Basel III Fully Phased-in)(4)
14.2% 14.2% 14.4%
Quarter Ended