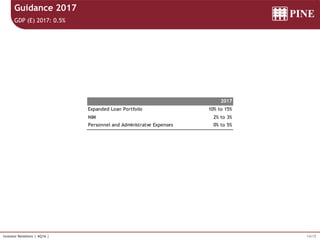
4Q16 Earnings Release
Conference Call
February, 24th 2017
2/15Investor Relations | 4Q16 |
Highlights
 Liquid balance sheet with a cash position of R$1.2 bi, equivalent to 31% of time deposits.
 Excess capital, with a BIS ratio of 15.4%, being 15.0% in Tier I Capital.
 Loan portfolio coverage ratio of approximately 6% as a result of the significant increase in provisions in the previous periods.
 Retraction of approximately 7% in personnel and administrative expenses in the accumulated of 12 months.
 Continuous liability management with a diversified portfolio and adequate terms.
3/15Investor Relations | 4Q16 |
7,409 6,859
Sept-15 Dec-15
Total Funding
-7.4%
7,691 6,933
Sept-15 Dec-15
Total Loan Portfolio
1
-9.9%
1,181 1,163
Sept-15 Dec-15
Shareholders' Equity
-1.5%
3.5% 3.6%
3Q15 4Q15
ROAE
0.1 p.p
2.9% 3.2%
3Q15 4Q15
NIM Evolution
0.33 p.p.
10 10
3Q15 4Q15
Net Income
Financial Highlights
1 Includes Stand by LCs, Bank Guarantees, Credit Securities to be Received and Securities (bonds, CRIs, eurobonds and fund shares)
R$ million
The main performance indicators were within expectations in the period…
3.2%
2.0%
1.0%
4Q15 3Q16 4Q16
NIM
-220 bps.
-100 bps.
3.4%
1.7%
2015 2016
NIM Evolution
-170 bps
10
-7
-9
4Q15 3Q16 4Q16
-190.0%
-37.2%
41
-14
2015 2016
Net Income
-134.9%
3.6%
-2.3%
-3.1%
4Q15 3Q16 4Q16
ROAE
-670 bps.
-80 bps.
3.4%
-1.2%
2015 2016
ROAE
-460 bps
6,933
6,238 6,445
Dec-15 Sept-16 Dec-16
Total Loan Portfolio1
3.3%
-7.0%
6,859
5,908 5,692
Dec-15 Sept-16 Dec-16
Total Funding
-3.7%
-17.0%
1,163 1,152 1,148
Dec-15 Sept-16 Dec-16
Shareholders' Equity
-0.3%
-1.3%
4/15Investor Relations | 4Q16 |
Revenue Mix
Participations by Business
 Evolution of other business lines, such as FICC and Pine Investimentos.
Product and Revenue Diversification
...with contributions from all business lines.
Credit
64.4%
FICC
22.0%
Pine
Investimentos
8.9%
Treasury
4.7%
2016
Credit
79.1%
FICC
14.5%
Pine
Investimentos
3.8%
Treasury
2.6%
2015
5/15Investor Relations | 4Q16 |
NIM and Efficiency Ratio
NIM
Expenses and Efficiency Ratio
Rigorous cost control.
23
21 22
19
17
18
60.0%
77.6%
111.1%
-100%
-50%
00%
50%
100%
150%
0
5
10
15
20
25
30
35
40
4Q15 3Q16 4Q16
89
85
74
67
47.9%
88.2%
-100%
-80%
-60%
-40%
-20%
00%
20%
40%
60%
80%
100%
0
20
40
60
80
100
120
140
2015 2016
Personnel
Expenses
Other
administrative
expenses
Recurring
Efficiency Ratio
(%)
3.2%
2.0%
1.0%
4Q15 3Q16 4Q16
NIM
-220 bps.
-100 bps.
3.4%
1.7%
2015 2016
NIM Evolution
-170 bps
6/15Investor Relations | 4Q16 |
3,282 3,172 3,139 3,275 3,468
794
747 659 520
437
2,373
2,250
2,122 2,104 2,120
485
438
351 339
419
Dec-15 Mar-16 Jun-16 Sept-16 Dec-16
Trade finance: 6.5%
Bank Guarantees: 32.9%
BNDES Onlending : 6.8%
Working Capital: 53.8%
6,608
6,271 6,238
6,933
6,445
1 Includes Stand by LC
2 Includes debentures, CRIs, Hedge Fund Shares, Eurobonds, Credit Portfolio acquired from financial institutions with recourse and Individuals
R$ million
Loan Portfolio
The portfolio amounted to R$6.4 billion...
1
2
-7.0%
3.3%
7/15Investor Relations | 4Q16 |
39%36%40%40%39%
6%
6%
6%5%5%
9%10%
8%9%7%
10%13%
14%14%15%
11%10%
10%9%9%
12%12%
12%14%
12%
13%13%10%9%13%
Dec-16Dec-15Dec-14Dec-13Dec-12
Energy
Real Estate
Agriculture
Sugar and Ethanol
Engineering
Transportation
and Logistics
Others
Continuous Loan Portfolio Management
Sectors Rebalance
...with improved sector diversification.
 The composition of the portfolio of the 20 largest clients changed by over 20% in the past twelve months;
 The share of wallet of the 20 largest clients remained at around 30%, in line with market peers.
Energy
13%
Real Estate
12%
Agriculture
11%
Sugar and Ethanol
10%
Engineering
9%
Transportation
and Logistics
6%
Telecom
5%
Foreign Trade
4%
Specialized
Services
4%
Retail
3%
Metallurgy
3%
Construction
Material
2%
Mining
2%
Vehicles and Parts
2%
Meatpacking
2%
Food Industry
1%
Other
10%
8/15Investor Relations | 4Q16 |
9.3%
15.1%
13.7%
5.1%
6.1% 5.9%
00%
02%
04%
06%
08%
10%
12%
-01%
01%
03%
05%
07%
09%
11%
13%
15%
17%
Dec-15 Sept-16 Dec-16
D-H Portfolio Coverage of Total Portfolio
80%
193%
426%
50.0%
250.0%
450.0%
650.0%
Coverage of D-H Overdue Portfolio
December 31st, 2016
Contracts Overdue: total amount of the contracts overdue for more than 90 days / Loan Portfolio
excluding Bank Guarantees and Stand-by Letters of Credit.
1D-H Portfolio: D-H Portfolio / Loan Portfolio Res. 2,682
2Coverage of Total Portfolio: Provisions / Loan Portfolio Res. 2,682
3Coverage D-H Overdue Portfolio: Provisions / D-H Overdue Portfolio
Loan Portfolio Quality
86.3% of the loan portfolio is classified between AA-C ratings.
Loan Portfolio Quality – Res. 2,682
Credit Coverage
Non Performing Loans > 90 days (Total Contract)
Collaterals
1 2 3
Products
Pledge
37%
Receivables
14%
Properties
Pledge
46%
Investments
3%
1.1%
2.1%
1.8%
1.2%
1.7%
0.7%
1.3% 1.5%
0.6%
Dec-14 Mar-15 Jun-15 Sept-15 Dec-15 Mar-16 Jun-16 Sept-16 Dec-16
AA-A
22.6%
B
23.5%
C
40.2%D-E
7.8%
F-H
5.8%
9/15Investor Relations | 4Q16 |
December 31st, 2016
 Fixed income: Fixed, Floating, Inflation, Libor
 Currencies: Dollar, Euro, Yen, Pound, Canadian Dollar,
Australian Dollar
 Commodities, Sugar, Soybean ( Grain, Meal and Oil), Corn,
Cotton, Metals, Energy
R$ million
FICC
Solid trackrecord.
Client Notional Derivatives by Market
Market Segments
Notional Value and MtM
Portfolio Profile
 Scenario on December 31st, 2016:
 Duration: 151 days
 Mark-to-Market: R$103 million
 Stress Scenario (Dollar: +31% and Commodities Prices: -30%):
 Stressed MtM : R$119 million
4,941 4,845 2,968 3,833 3,979
479
398
212
166
103
160
(171 )
315
164
119
Dec-15 Mar-16 Jun-16 Sept-16 Dec-16
Notional Amount
MtM
Stressed MtM
Commodities
17%
Fixed Income
9%
Currencies
74%
10/15Investor Relations | 4Q16 |
R$ million
Pine Investimentos
Fee Generation
Selected Transactions
 Capital Markets: Structuring and Distribution of Fixed
Income Transactions.
 Financial Advisory: Project & Structured Finance, M&A,
and hybrid capital transactions.
 Research: Macro and Commodities.
4
6
3Q16 4Q16
12
16
2015 2016
September, 2016
Structure Credit
Facility
R$ 10,000,000
Lead Coordinator
September, 2016
Mortage Backed
Securities
R$ 10,000,000
Lead Coordinator
September, 2016
Bond
R$ 469,000,000
October, 2016
NCE
R$ 30,000,000
Coordinator
October, 2016
Mortage Backed
Securities
R$ 50,000,000
Lead Coordinator
November, 2016
Promissory Note
R$ 20,000,000
November, 2016
CRI
R$ 47,400,000
Lead Coordinator
December, 2016
Mortage Backed
Securities
R$ 8,500,000
Lead Coordinator
December, 2016
CRI
R$ 50,000,000
Lead Coordinator
11/15Investor Relations | 4Q16 |
R$ million
Funding
Diversified sources of funding...
53% 52% 50%53% 31% Cash over Deposits
841 787 648 617 460
324 348
261 376
384
1,570 1,662 1,939
2,600 2,980
336 218 156
133
46
18 17 19
29
17
806 759 668
530 454
295 284 296
198 213751 761 734
259 247
279 244
216 206 204
1,029
777
680 665 416
113
61
39 33
33
497
352
270 262
239
6,859
6,270
5,925 5,908
5,692
Dec-15 Mar-16 Jun-16 Sept-16 Dec-16
Trade Finance: 4.2%
Private Placements: 0.6%
Multilateral Lines: 7.3%
International Capital Markets:
3.6%
Financial Letter : 4.3%
Local Capital Markets: 3.7%
Onlending: 8%
Demand Deposits: 0.3%
Interbank Time Deposits: 0.8%
High Net Worth Individual Time
Deposits: 52.4%
Corporate Time Deposits: 6.7%
Institutional Time Deposits:
8.1%
12/15Investor Relations | 4Q16 |
45% 48% 51%
64% 68%
55% 52% 49%
36% 32%
Dec-15 Mar-16 Jun-16 Sept-16 Dec-16
Total Deposits Others
Leverage: Expanded Loan Portfolio / Shareholders’ Equity
Expanded Loan Portfolio excluding Bank Guarantees and Stand-by Letters of Credit /
Shareholders’ Equity
Credit over Funding ratio: Loan Portfolio excluding Bank Guarantees and Stand-by Letters of
Credit / Total Funding
Asset & Liability Management
... matching assets’ and liabilities’ duration.
Leverage Credit over Funding Ratio
Total Deposits over Total Funding
R$ millionR$ billion
5,6926,270 5,925 5,9086,859
Asset and Liability Management (ALM)
66%
69% 70% 70%
76%
Dec-15 Mar-16 Jun-16 Sept-16 Dec-16
6.0x
5.6x 5.4x 5.4x 5.6x
3.9x 3.7x 3.6x 3.6x 3.8x
-
1.00
2.00
3.00
4.00
5.00
6.00
7.00
8.00
9.00
10.00
Dec-15 Mar-16 Jun-16 Sept-16 Dec-16
Expanded loan Porfolio
Loan Portfolio excluding
Bank Guarantees
1.1
0.7
5.0
0.0
0.7
0.6
Assets
0.1
0.4
3.8
2.7
0.4
0.7
Liabilities
8.2 8.2
Coverage
of 131%
Cash and cash equivalents
Assets financed through REPOs
Other assets
Credit Portfolio
Trading portfolio assets
Illiquid assets
Secured funding
Other liabilities
Unsecured funding
Demand deposits
Equity
REPO Financing
13/15Investor Relations | 4Q16 |
Capital Adequacy Ratio (BIS), Basel III
BIS ratio of 15.4%, being 15.0% in Tier I Capital.
14.1% 14.7% 15.4% 15.3% 15.0%
0.9% 0.4%
0.5% 0.5% 0.4%
Dec-15 Mar-16 Jun-16 Sept-16 Dec-16
Tier II Tier I
Minimum Regulatory
Capital (10.5%)
15.0% 15.1%
15.9% 15.8% 15.4%
14/15Investor Relations | 4Q16 |
Guidance 2017
GDP (E) 2017: 0.5%
2017
Expanded Loan Portfolio 10% to 15%
NIM 2% to 3%
Personnel and Administratve Expenses 0% to 5%
15/15Investor Relations | 4Q16 |
This report may contain forward-looking statements concerning the business prospects, projections of operating and financial results and growth outlook of PINE. These are merely projections and as such
are based solely on management’s expectations regarding the future of the business. These statements depend substantially on market conditions, the performance of the sector and the Brazilian economy
(political and economic changes, volatility in interest and exchange rates, technological changes, inflation, financial disintermediation, competitive pressures on products and prices and changes in tax
legislation) and therefore are subject to change without prior notice.
Norberto Zaiet Junior
CEO
João Brito
CFO
Raquel Varela Bastos
Head of Investor Relations, Local Funding and Communication
Luiz Maximo
Investor Relations Coordinator
Kianne Paganini
Investor Relations Analyst
Phone: (55 11) 3372-5343
ir.pine.com
ir@pine.com
Investor Relations

Cc 4Q16_eng

  • 1.
    4Q16 Earnings Release ConferenceCall February, 24th 2017
  • 2.
    2/15Investor Relations |4Q16 | Highlights  Liquid balance sheet with a cash position of R$1.2 bi, equivalent to 31% of time deposits.  Excess capital, with a BIS ratio of 15.4%, being 15.0% in Tier I Capital.  Loan portfolio coverage ratio of approximately 6% as a result of the significant increase in provisions in the previous periods.  Retraction of approximately 7% in personnel and administrative expenses in the accumulated of 12 months.  Continuous liability management with a diversified portfolio and adequate terms.
  • 3.
    3/15Investor Relations |4Q16 | 7,409 6,859 Sept-15 Dec-15 Total Funding -7.4% 7,691 6,933 Sept-15 Dec-15 Total Loan Portfolio 1 -9.9% 1,181 1,163 Sept-15 Dec-15 Shareholders' Equity -1.5% 3.5% 3.6% 3Q15 4Q15 ROAE 0.1 p.p 2.9% 3.2% 3Q15 4Q15 NIM Evolution 0.33 p.p. 10 10 3Q15 4Q15 Net Income Financial Highlights 1 Includes Stand by LCs, Bank Guarantees, Credit Securities to be Received and Securities (bonds, CRIs, eurobonds and fund shares) R$ million The main performance indicators were within expectations in the period… 3.2% 2.0% 1.0% 4Q15 3Q16 4Q16 NIM -220 bps. -100 bps. 3.4% 1.7% 2015 2016 NIM Evolution -170 bps 10 -7 -9 4Q15 3Q16 4Q16 -190.0% -37.2% 41 -14 2015 2016 Net Income -134.9% 3.6% -2.3% -3.1% 4Q15 3Q16 4Q16 ROAE -670 bps. -80 bps. 3.4% -1.2% 2015 2016 ROAE -460 bps 6,933 6,238 6,445 Dec-15 Sept-16 Dec-16 Total Loan Portfolio1 3.3% -7.0% 6,859 5,908 5,692 Dec-15 Sept-16 Dec-16 Total Funding -3.7% -17.0% 1,163 1,152 1,148 Dec-15 Sept-16 Dec-16 Shareholders' Equity -0.3% -1.3%
  • 4.
    4/15Investor Relations |4Q16 | Revenue Mix Participations by Business  Evolution of other business lines, such as FICC and Pine Investimentos. Product and Revenue Diversification ...with contributions from all business lines. Credit 64.4% FICC 22.0% Pine Investimentos 8.9% Treasury 4.7% 2016 Credit 79.1% FICC 14.5% Pine Investimentos 3.8% Treasury 2.6% 2015
  • 5.
    5/15Investor Relations |4Q16 | NIM and Efficiency Ratio NIM Expenses and Efficiency Ratio Rigorous cost control. 23 21 22 19 17 18 60.0% 77.6% 111.1% -100% -50% 00% 50% 100% 150% 0 5 10 15 20 25 30 35 40 4Q15 3Q16 4Q16 89 85 74 67 47.9% 88.2% -100% -80% -60% -40% -20% 00% 20% 40% 60% 80% 100% 0 20 40 60 80 100 120 140 2015 2016 Personnel Expenses Other administrative expenses Recurring Efficiency Ratio (%) 3.2% 2.0% 1.0% 4Q15 3Q16 4Q16 NIM -220 bps. -100 bps. 3.4% 1.7% 2015 2016 NIM Evolution -170 bps
  • 6.
    6/15Investor Relations |4Q16 | 3,282 3,172 3,139 3,275 3,468 794 747 659 520 437 2,373 2,250 2,122 2,104 2,120 485 438 351 339 419 Dec-15 Mar-16 Jun-16 Sept-16 Dec-16 Trade finance: 6.5% Bank Guarantees: 32.9% BNDES Onlending : 6.8% Working Capital: 53.8% 6,608 6,271 6,238 6,933 6,445 1 Includes Stand by LC 2 Includes debentures, CRIs, Hedge Fund Shares, Eurobonds, Credit Portfolio acquired from financial institutions with recourse and Individuals R$ million Loan Portfolio The portfolio amounted to R$6.4 billion... 1 2 -7.0% 3.3%
  • 7.
    7/15Investor Relations |4Q16 | 39%36%40%40%39% 6% 6% 6%5%5% 9%10% 8%9%7% 10%13% 14%14%15% 11%10% 10%9%9% 12%12% 12%14% 12% 13%13%10%9%13% Dec-16Dec-15Dec-14Dec-13Dec-12 Energy Real Estate Agriculture Sugar and Ethanol Engineering Transportation and Logistics Others Continuous Loan Portfolio Management Sectors Rebalance ...with improved sector diversification.  The composition of the portfolio of the 20 largest clients changed by over 20% in the past twelve months;  The share of wallet of the 20 largest clients remained at around 30%, in line with market peers. Energy 13% Real Estate 12% Agriculture 11% Sugar and Ethanol 10% Engineering 9% Transportation and Logistics 6% Telecom 5% Foreign Trade 4% Specialized Services 4% Retail 3% Metallurgy 3% Construction Material 2% Mining 2% Vehicles and Parts 2% Meatpacking 2% Food Industry 1% Other 10%
  • 8.
    8/15Investor Relations |4Q16 | 9.3% 15.1% 13.7% 5.1% 6.1% 5.9% 00% 02% 04% 06% 08% 10% 12% -01% 01% 03% 05% 07% 09% 11% 13% 15% 17% Dec-15 Sept-16 Dec-16 D-H Portfolio Coverage of Total Portfolio 80% 193% 426% 50.0% 250.0% 450.0% 650.0% Coverage of D-H Overdue Portfolio December 31st, 2016 Contracts Overdue: total amount of the contracts overdue for more than 90 days / Loan Portfolio excluding Bank Guarantees and Stand-by Letters of Credit. 1D-H Portfolio: D-H Portfolio / Loan Portfolio Res. 2,682 2Coverage of Total Portfolio: Provisions / Loan Portfolio Res. 2,682 3Coverage D-H Overdue Portfolio: Provisions / D-H Overdue Portfolio Loan Portfolio Quality 86.3% of the loan portfolio is classified between AA-C ratings. Loan Portfolio Quality – Res. 2,682 Credit Coverage Non Performing Loans > 90 days (Total Contract) Collaterals 1 2 3 Products Pledge 37% Receivables 14% Properties Pledge 46% Investments 3% 1.1% 2.1% 1.8% 1.2% 1.7% 0.7% 1.3% 1.5% 0.6% Dec-14 Mar-15 Jun-15 Sept-15 Dec-15 Mar-16 Jun-16 Sept-16 Dec-16 AA-A 22.6% B 23.5% C 40.2%D-E 7.8% F-H 5.8%
  • 9.
    9/15Investor Relations |4Q16 | December 31st, 2016  Fixed income: Fixed, Floating, Inflation, Libor  Currencies: Dollar, Euro, Yen, Pound, Canadian Dollar, Australian Dollar  Commodities, Sugar, Soybean ( Grain, Meal and Oil), Corn, Cotton, Metals, Energy R$ million FICC Solid trackrecord. Client Notional Derivatives by Market Market Segments Notional Value and MtM Portfolio Profile  Scenario on December 31st, 2016:  Duration: 151 days  Mark-to-Market: R$103 million  Stress Scenario (Dollar: +31% and Commodities Prices: -30%):  Stressed MtM : R$119 million 4,941 4,845 2,968 3,833 3,979 479 398 212 166 103 160 (171 ) 315 164 119 Dec-15 Mar-16 Jun-16 Sept-16 Dec-16 Notional Amount MtM Stressed MtM Commodities 17% Fixed Income 9% Currencies 74%
  • 10.
    10/15Investor Relations |4Q16 | R$ million Pine Investimentos Fee Generation Selected Transactions  Capital Markets: Structuring and Distribution of Fixed Income Transactions.  Financial Advisory: Project & Structured Finance, M&A, and hybrid capital transactions.  Research: Macro and Commodities. 4 6 3Q16 4Q16 12 16 2015 2016 September, 2016 Structure Credit Facility R$ 10,000,000 Lead Coordinator September, 2016 Mortage Backed Securities R$ 10,000,000 Lead Coordinator September, 2016 Bond R$ 469,000,000 October, 2016 NCE R$ 30,000,000 Coordinator October, 2016 Mortage Backed Securities R$ 50,000,000 Lead Coordinator November, 2016 Promissory Note R$ 20,000,000 November, 2016 CRI R$ 47,400,000 Lead Coordinator December, 2016 Mortage Backed Securities R$ 8,500,000 Lead Coordinator December, 2016 CRI R$ 50,000,000 Lead Coordinator
  • 11.
    11/15Investor Relations |4Q16 | R$ million Funding Diversified sources of funding... 53% 52% 50%53% 31% Cash over Deposits 841 787 648 617 460 324 348 261 376 384 1,570 1,662 1,939 2,600 2,980 336 218 156 133 46 18 17 19 29 17 806 759 668 530 454 295 284 296 198 213751 761 734 259 247 279 244 216 206 204 1,029 777 680 665 416 113 61 39 33 33 497 352 270 262 239 6,859 6,270 5,925 5,908 5,692 Dec-15 Mar-16 Jun-16 Sept-16 Dec-16 Trade Finance: 4.2% Private Placements: 0.6% Multilateral Lines: 7.3% International Capital Markets: 3.6% Financial Letter : 4.3% Local Capital Markets: 3.7% Onlending: 8% Demand Deposits: 0.3% Interbank Time Deposits: 0.8% High Net Worth Individual Time Deposits: 52.4% Corporate Time Deposits: 6.7% Institutional Time Deposits: 8.1%
  • 12.
    12/15Investor Relations |4Q16 | 45% 48% 51% 64% 68% 55% 52% 49% 36% 32% Dec-15 Mar-16 Jun-16 Sept-16 Dec-16 Total Deposits Others Leverage: Expanded Loan Portfolio / Shareholders’ Equity Expanded Loan Portfolio excluding Bank Guarantees and Stand-by Letters of Credit / Shareholders’ Equity Credit over Funding ratio: Loan Portfolio excluding Bank Guarantees and Stand-by Letters of Credit / Total Funding Asset & Liability Management ... matching assets’ and liabilities’ duration. Leverage Credit over Funding Ratio Total Deposits over Total Funding R$ millionR$ billion 5,6926,270 5,925 5,9086,859 Asset and Liability Management (ALM) 66% 69% 70% 70% 76% Dec-15 Mar-16 Jun-16 Sept-16 Dec-16 6.0x 5.6x 5.4x 5.4x 5.6x 3.9x 3.7x 3.6x 3.6x 3.8x - 1.00 2.00 3.00 4.00 5.00 6.00 7.00 8.00 9.00 10.00 Dec-15 Mar-16 Jun-16 Sept-16 Dec-16 Expanded loan Porfolio Loan Portfolio excluding Bank Guarantees 1.1 0.7 5.0 0.0 0.7 0.6 Assets 0.1 0.4 3.8 2.7 0.4 0.7 Liabilities 8.2 8.2 Coverage of 131% Cash and cash equivalents Assets financed through REPOs Other assets Credit Portfolio Trading portfolio assets Illiquid assets Secured funding Other liabilities Unsecured funding Demand deposits Equity REPO Financing
  • 13.
    13/15Investor Relations |4Q16 | Capital Adequacy Ratio (BIS), Basel III BIS ratio of 15.4%, being 15.0% in Tier I Capital. 14.1% 14.7% 15.4% 15.3% 15.0% 0.9% 0.4% 0.5% 0.5% 0.4% Dec-15 Mar-16 Jun-16 Sept-16 Dec-16 Tier II Tier I Minimum Regulatory Capital (10.5%) 15.0% 15.1% 15.9% 15.8% 15.4%
  • 14.
    14/15Investor Relations |4Q16 | Guidance 2017 GDP (E) 2017: 0.5% 2017 Expanded Loan Portfolio 10% to 15% NIM 2% to 3% Personnel and Administratve Expenses 0% to 5%
  • 15.
    15/15Investor Relations |4Q16 | This report may contain forward-looking statements concerning the business prospects, projections of operating and financial results and growth outlook of PINE. These are merely projections and as such are based solely on management’s expectations regarding the future of the business. These statements depend substantially on market conditions, the performance of the sector and the Brazilian economy (political and economic changes, volatility in interest and exchange rates, technological changes, inflation, financial disintermediation, competitive pressures on products and prices and changes in tax legislation) and therefore are subject to change without prior notice. Norberto Zaiet Junior CEO João Brito CFO Raquel Varela Bastos Head of Investor Relations, Local Funding and Communication Luiz Maximo Investor Relations Coordinator Kianne Paganini Investor Relations Analyst Phone: (55 11) 3372-5343 ir.pine.com ir@pine.com Investor Relations