Download to read offline


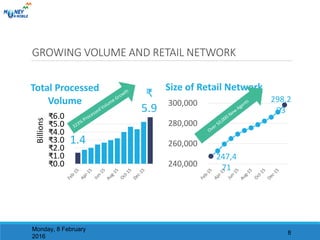
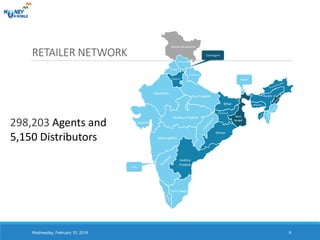


Calpian is a mobile payments company operating in India. It has experienced explosive growth, with processing volume up 300% year-over-year and revenue growth of 43% year-over-year. Calpian has a large retail network of over 298,000 agents across India and processes high transaction volumes. However, the document notes that forecasts and projections depend on key assumptions being realized, such as continued access to financing and favorable business conditions.