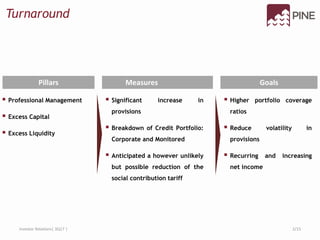
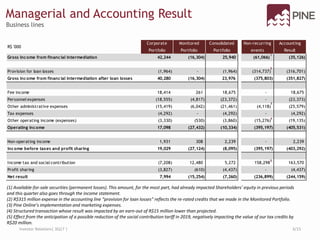
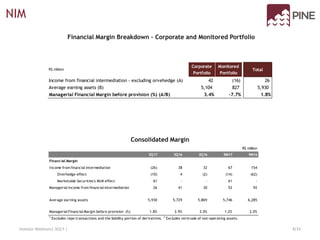
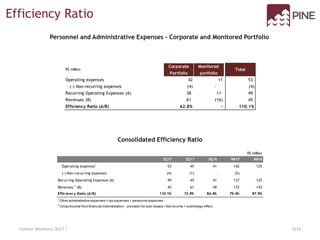
3Q17 Earnings Release
Conference Call
November, 10th 2017
Turnaround
 Professional Management
 Excess Capital
 Excess Liquidity
Measures
 Significant increase in
provisions
 Breakdown of Credit Portfolio:
Corporate and Monitored
 Anticipated a however unlikely
but possible reduction of the
social contribution tariff
 Higher portfolio coverage
ratios
 Reduce volatility in
provisions
 Recurring and increasing
net income
GoalsPillars
2/15Investor Relations| 3Q17 |
R$ '000
Corporate
Portfolio
Consolidated
Portfolio
Non-recurring
events
Accounting
Result
Gross income from financial intermediation 42,244 (16,304) 25,940 (61,066) (35,126)
Provision for loan losses (1,964) - (1,964) (314,737) (316,701)
Gross income from financial intermediation after loan losses 40,280 (16,304) 23,976 (375,803) (351,827)
Fee income 18,414 261 18,675 - 18,675
Personnel expenses (18,555) (4,817) (23,372) - (23,373)
Other administrative expenses (15,419) (6,042) (21,461) (4,118) (25,579)
Tax expenses (4,292) - (4,292) - (4,292)
Other operating income (expenses) (3,330) (530) (3,860) (15,276) (19,135)
Operating income 17,098 (27,432) (10,334) (395,197) (405,531)
Non-operating income 1,931 308 2,239 - 2,239
Income before taxes and profit sharing 19,029 (27,124) (8,095) (395,197) (403,292)
Income tax and social contribution (7,208) 12,480 5,272 158,298 163,570
Profit sharing (3,827) (610) (4,437) - (4,437)
Net result 7,994 (15,254) (7,260) (236,899) (244,159)
Monitored
Portfolio
Managerial and Accounting Result
Business lines
(1) Available-for-sale securities (permanent losses). This amount, for the most part, had already impacted Shareholders’ equity in previous periods
and this quarter also goes through the income statement.
(2) R$315 million expense in the accounting line “provision for loan losses” reflects the re-rated credits that we made in the Monitored Portfolio.
(3) Pine Online’s implementation and marketing expenses.
(4) Structured transaction whose result was impacted by an earn-out of R$15 million lower than projected.
(5) Effect from the anticipation of a possible reduction of the social contribution tariff in 2019, negatively impacting the value of our tax credits by
R$20 million.
3/15Investor Relations| 3Q17 |
1
2
3
4
5
Financial Margin Breakdown – Corporate and Monitored Portfolio
Consolidated Margin
NIM
4/15Investor Relations| 3Q17 |
R$ million
Corporate
Portfolio
Monitored
Portfolio
Total
Income from financial intermediation - excluding orvehedge (A) 42 (16) 26
Average earning assets (B) 5,104 827 5,930
Managerial Financial Margin before provision (%) (A/B) 3.4% -7.7% 1.8%
R$ million
3Q17 3Q16 3Q16 9M17 9M16
Financial Margin
Income from financial intermediation (26) 38 32 67 154
Overhedge effect (10) 4 (2) (14) (62)
Marketable Securities's MtM effect 61 - - 61 -
Managerial income from financial intermediation 26 41 30 52 92
Average earning assets 5,930 5,729 5,869 5,746 6,285
Managerial Financial Margin before provision (%) 1.8% 2.9% 2.0% 1.2% 2.0%
1
Excludes repo transactions and the liability portion of derivatives. 2
Excludes term sale of non-operating assets.
Personnel and Administrative Expenses - Corporate and Monitored Portfolio
Consolidated Efficiency Ratio
Efficiency Ratio
5/15Investor Relations| 3Q17 |
Operating expenses 42 11 53
(-) Non-recurring expenses (4) - (4)
Recurring Operating Expenses (A) 38 11 49
Revenues (B) 61 (16) 45
Efficiency Ratio (A/B) 62.8% - 110.1%
R$ million
Corporate
Portfolio
Monitored
portfolio
Total
R$ million
3Q17 2Q17 3Q16 9M17 9M16
Operating expenses1
53 45 41 142 125
(-) Non-recurring expenses (4) (1) - (5) -
Recurring Operating Expenses (A) 49 45 41 137 125
Revenues 2
(B) 45 61 49 172 143
Efficiency Ratio (A/B) 110.1% 72.9% 84.4% 79.4% 87.9%
1
Other administrative expenses + tax expenses + personnel expenses
2
Gross Income from financial intermediation - provision for loan losses + fee income + overhedge effect
Client Notional Derivatives by Market
Market Segments
Relações com Investidores | 3T17 | 6/15
Solid trackrecord
FICC
Notional Value and MtM
Portfolio Profile
 Currencies: Dollar, Euro, Yen, Pound, Canadian Dollar,
Australian Dollar
 Commodities: Sugar, Soybean ( Grain, Meal and Oil), Corn,
Cotton, Metals, Energy
 Fixed income: Fixed, Floating, Inflation, Libor
 Duration: 197 days
 MtM: R$51 million
Stress Scenario (Dollar: +31% and Commodities Prices: -30%):
 Stressed MtM: R$123 million
3,833 3,979 4,487 4,564 2,982
166
103
55 82 51
164
119
172
218
123
Sept-16 Dec-16 Mar-17 Jun-17 Sept-17
Notional Amount
MtM
Stressed MtM
Investor Relations| 3Q17 | 7/15
7th player in volume of CRI’s origination and 8th place in number of short-term fixed income transactions
Pine Investimentos
Selected Transactions
 Capital Markets: Structuring and Distribution of Fixed
Income Transactions.
 Financial Advisory: Project & Structured Finance, M&A,
and hybrid capital transactions.
January, 2017
Structure Credit
Facility
R$ 6,000,000
January, 2017
Structure Credit
Facility
R$ 15,000,000
Lead Coordinator
March, 2017
CCBI
R$ 15,000,000
Lead Coordinator
March, 2017
Promissory Note
R$ 35,000,000
Coordinator
March, 2017
CRI
R$ 47,000,000
Lead Coordinator
March, 2017
Structure Credit
Facility
R$ 90,000,000
Lead Coordinator
May, 2017
R$ 60,000,000
Bond
May, 2017
Promissory Note
R$ 40,000,000
Lead Coordinator
May, 2017
BRDE Bank Guarantee
R$ 10,000,000
2,796 2,975
3,203 3,331 3,356
520
437
370 298 319339
419
399 388 313
2,104
2,120 2,022 2,123
1,934
479
493 470
442
395
Sept-16 Dec-16 Mar-17 Jun-17 Sept-17
Securities: 6.2%
Bank Guarantees: 30.6%
Trade finance: 5%
BNDES Onlending : 5.1%
Working Capital: 53.1%
6,238
6,445 6,465
6,582
6,318
Investor Relations| 3Q17 | 8/15
¹ Includes Standby LC
² Includes receivables on purchase of assets.
1
2
Expanded Loan Portfolio
Investor Relations| 3Q17 | 9/15
R$ million
Volume % Volume % Volume %
Working capital¹ 2,672 42% 685 11% 3,356 53%
Onlendings 316 5% 3 0% 319 5%
Trade finance² 283 4% 30 0% 313 5%
Res. 2.682 Loan Portfolio 3,271 52% 717 11% 3,989 63%
Bank guarantees 1,893 30% 41 1% 1,934 31%
Securities 285 5% 109 2% 395 6%
Expanded Loan Portfolio 5,450 86% 868 14% 6,318 100%
1
Includes receivables on purchase of assets
2
Includes Standby LC
Corporate Portfolio Monitored Portfolio Consolidated Portfolio
Loan Portfolio Breakdown
Breakdown – Corporate and Monitored Portfolio
Consolidated Loan Portfolio Quality Non Performing Loans > 90 days (Total Contract)¹
¹ Includes securities and ex-bank guarantees and stand by LC
Overdue Total
AA-D 71 3,271
E-H 197 717
Total Portfolio- Res 2,682 268 3,989
E-H Portfolio/Total 73.4% 18.0%
E-H coverage ratio 303.7% 83.3%
Consolidated Portfolio
PP PP
PPPP
4.2%
3.7%
0.7%0.6%
1.5%1.3%
0.7%
1.7%
1.2%
Sept-17Jun-17Mar-17Dec-16Sept-16Jun-16Mar-16Dec-15Sept-15
Ratings Sectors
Average Ticket Evolution (R$ K)
Investor Relations| 3Q17 | 10/15
AA-B
75%
C
25%
 297 new operations
 Total amount of R$2.9 billions
 Average Ticket of approximately R$10 million
Agriculture
16%
Energy
16%
Sugar and
Ethanol
14%
Real Estate
9%
Transportation
and
8%
Chemical and
petrochemical
7%
Foreign Trade
6%
Engineering
6%
Others
18%
Credit Production
16.981
15.000
17.000
19.000
21.000
23.000
25.000
2Q14 3Q14 4Q14 1Q15 2Q15 3Q15 4Q15 1Q16 2Q16 3Q16 4Q16 1Q17 2Q17 3Q17
25,953
24,635
16,981
Investor Relations| 3Q17 | 11/15
Funding
617 460 464 446 461
376
384 460 421 344
2,600 2,980
3,241
3,893 3,988
133
46
72
114 116
29
17
11
27 19
530 454
383
331 332
198 213
240
203 273
259 247
203
176 153
206 204
86
89 91
698 448
386
403 334
262
239 150
178 1425,908
5,692 5,697
6,280 6,252
Sept-16 Dec-16 Mar-17 Jun-17 Sept-17
Trade Finance: 2.3%
Multilateral Lines: 5.3%
International Capital Markets:
1.5%
Financial Letter : 2.4%
Local Capital Markets: 4.4%
Onlending: 5.3%
Demand Deposits: 0.3%
Interbank Time Deposits: 1.9%
High Net Worth Individual Time
Deposits: 63.8%
Corporate Time Deposits: 5.5%
Institutional Time Deposits:
7.4%
Investor Relations| 3Q17 | 12/15
 Pine launched its digital investment platform, Pine Online
 Products: CDBs, LCAs and LCIs
 App: IOS and Android
 The Bank's five largest funding channels
PINE ONLINE
1.8
1.4 1.5 1.5
1.8
1.2 1.1
1.4
1.6
3Q15 4Q15 1Q16 2Q16 3Q16 4Q16 1Q17 2Q17 3Q17
Cash Position (R$ bi)
64% 68%
75% 78% 79%
36% 32%
25% 22% 21%
Sept-16 Dec-16 Mar-17 Jun-17 Sept-17
Total Deposits Others
Cash Position Total Deposits over Total Funding
Capital Adequacy Ratio (BIS), Basel III
Investor Relations| 3Q17 | 13/15
5,6975,908 5,692 6,277 6,252
Capital & Liability Management
15.3% 15.0% 14.7% 14.2%
11.9%
0.5% 0.5% 0.4% 0.4%
0.4%
Sept-16 Dec-16 Mar-17 Jun-17 Sept-17
Tier II
Tier I
12.4%
14.6%
15.1%15.4%15.8%
151%
124% 127% 128%
155%
103% 95%
121%
174%
Cash/Equity
Cash/Equity
Investor Relations| 3Q17 | 14/15
¹Growth of expanded loan portfolio between 2% and 5%, as a result of
continued diversification of the corporate portfolio and the run-off of the
monitored portfolio.
Guidance
2018
Expanded Loan Portfolio¹ 2% to 5%
ROAE 2% to 5%
Investor Relations| 3Q17 | 15/15
Norberto Zaiet Junior
CEO
João Brito
CFO
Raquel Varela Bastos
Head of Investor Relations, Local Funding and Communication
Luiz Maximo
Investor Relations Manager
Kianne Paganini
Investor Relations Analyst
Phone: (55 11) 3372-5343
ir.pine.com
ir@pine.com
This report may contain forward-looking statements concerning the business prospects, projections of operating and financial results and growth outlook of PINE. These are merely projections and as such are based solely on
management’s expectations regarding the future of the business. These statements depend substantially on market conditions, the performance of the sector and the Brazilian economy (political and economic changes,
volatility in interest and exchange rates, technological changes, inflation, financial disintermediation, competitive pressures on products and prices and changes in tax legislation) and therefore are subject to change without
prior notice.
Investor Relations

Cc 3 t17_eng

  • 1.
    3Q17 Earnings Release ConferenceCall November, 10th 2017
  • 2.
    Turnaround  Professional Management Excess Capital  Excess Liquidity Measures  Significant increase in provisions  Breakdown of Credit Portfolio: Corporate and Monitored  Anticipated a however unlikely but possible reduction of the social contribution tariff  Higher portfolio coverage ratios  Reduce volatility in provisions  Recurring and increasing net income GoalsPillars 2/15Investor Relations| 3Q17 |
  • 3.
    R$ '000 Corporate Portfolio Consolidated Portfolio Non-recurring events Accounting Result Gross incomefrom financial intermediation 42,244 (16,304) 25,940 (61,066) (35,126) Provision for loan losses (1,964) - (1,964) (314,737) (316,701) Gross income from financial intermediation after loan losses 40,280 (16,304) 23,976 (375,803) (351,827) Fee income 18,414 261 18,675 - 18,675 Personnel expenses (18,555) (4,817) (23,372) - (23,373) Other administrative expenses (15,419) (6,042) (21,461) (4,118) (25,579) Tax expenses (4,292) - (4,292) - (4,292) Other operating income (expenses) (3,330) (530) (3,860) (15,276) (19,135) Operating income 17,098 (27,432) (10,334) (395,197) (405,531) Non-operating income 1,931 308 2,239 - 2,239 Income before taxes and profit sharing 19,029 (27,124) (8,095) (395,197) (403,292) Income tax and social contribution (7,208) 12,480 5,272 158,298 163,570 Profit sharing (3,827) (610) (4,437) - (4,437) Net result 7,994 (15,254) (7,260) (236,899) (244,159) Monitored Portfolio Managerial and Accounting Result Business lines (1) Available-for-sale securities (permanent losses). This amount, for the most part, had already impacted Shareholders’ equity in previous periods and this quarter also goes through the income statement. (2) R$315 million expense in the accounting line “provision for loan losses” reflects the re-rated credits that we made in the Monitored Portfolio. (3) Pine Online’s implementation and marketing expenses. (4) Structured transaction whose result was impacted by an earn-out of R$15 million lower than projected. (5) Effect from the anticipation of a possible reduction of the social contribution tariff in 2019, negatively impacting the value of our tax credits by R$20 million. 3/15Investor Relations| 3Q17 | 1 2 3 4 5
  • 4.
    Financial Margin Breakdown– Corporate and Monitored Portfolio Consolidated Margin NIM 4/15Investor Relations| 3Q17 | R$ million Corporate Portfolio Monitored Portfolio Total Income from financial intermediation - excluding orvehedge (A) 42 (16) 26 Average earning assets (B) 5,104 827 5,930 Managerial Financial Margin before provision (%) (A/B) 3.4% -7.7% 1.8% R$ million 3Q17 3Q16 3Q16 9M17 9M16 Financial Margin Income from financial intermediation (26) 38 32 67 154 Overhedge effect (10) 4 (2) (14) (62) Marketable Securities's MtM effect 61 - - 61 - Managerial income from financial intermediation 26 41 30 52 92 Average earning assets 5,930 5,729 5,869 5,746 6,285 Managerial Financial Margin before provision (%) 1.8% 2.9% 2.0% 1.2% 2.0% 1 Excludes repo transactions and the liability portion of derivatives. 2 Excludes term sale of non-operating assets.
  • 5.
    Personnel and AdministrativeExpenses - Corporate and Monitored Portfolio Consolidated Efficiency Ratio Efficiency Ratio 5/15Investor Relations| 3Q17 | Operating expenses 42 11 53 (-) Non-recurring expenses (4) - (4) Recurring Operating Expenses (A) 38 11 49 Revenues (B) 61 (16) 45 Efficiency Ratio (A/B) 62.8% - 110.1% R$ million Corporate Portfolio Monitored portfolio Total R$ million 3Q17 2Q17 3Q16 9M17 9M16 Operating expenses1 53 45 41 142 125 (-) Non-recurring expenses (4) (1) - (5) - Recurring Operating Expenses (A) 49 45 41 137 125 Revenues 2 (B) 45 61 49 172 143 Efficiency Ratio (A/B) 110.1% 72.9% 84.4% 79.4% 87.9% 1 Other administrative expenses + tax expenses + personnel expenses 2 Gross Income from financial intermediation - provision for loan losses + fee income + overhedge effect
  • 6.
    Client Notional Derivativesby Market Market Segments Relações com Investidores | 3T17 | 6/15 Solid trackrecord FICC Notional Value and MtM Portfolio Profile  Currencies: Dollar, Euro, Yen, Pound, Canadian Dollar, Australian Dollar  Commodities: Sugar, Soybean ( Grain, Meal and Oil), Corn, Cotton, Metals, Energy  Fixed income: Fixed, Floating, Inflation, Libor  Duration: 197 days  MtM: R$51 million Stress Scenario (Dollar: +31% and Commodities Prices: -30%):  Stressed MtM: R$123 million 3,833 3,979 4,487 4,564 2,982 166 103 55 82 51 164 119 172 218 123 Sept-16 Dec-16 Mar-17 Jun-17 Sept-17 Notional Amount MtM Stressed MtM
  • 7.
    Investor Relations| 3Q17| 7/15 7th player in volume of CRI’s origination and 8th place in number of short-term fixed income transactions Pine Investimentos Selected Transactions  Capital Markets: Structuring and Distribution of Fixed Income Transactions.  Financial Advisory: Project & Structured Finance, M&A, and hybrid capital transactions. January, 2017 Structure Credit Facility R$ 6,000,000 January, 2017 Structure Credit Facility R$ 15,000,000 Lead Coordinator March, 2017 CCBI R$ 15,000,000 Lead Coordinator March, 2017 Promissory Note R$ 35,000,000 Coordinator March, 2017 CRI R$ 47,000,000 Lead Coordinator March, 2017 Structure Credit Facility R$ 90,000,000 Lead Coordinator May, 2017 R$ 60,000,000 Bond May, 2017 Promissory Note R$ 40,000,000 Lead Coordinator May, 2017 BRDE Bank Guarantee R$ 10,000,000
  • 8.
    2,796 2,975 3,203 3,3313,356 520 437 370 298 319339 419 399 388 313 2,104 2,120 2,022 2,123 1,934 479 493 470 442 395 Sept-16 Dec-16 Mar-17 Jun-17 Sept-17 Securities: 6.2% Bank Guarantees: 30.6% Trade finance: 5% BNDES Onlending : 5.1% Working Capital: 53.1% 6,238 6,445 6,465 6,582 6,318 Investor Relations| 3Q17 | 8/15 ¹ Includes Standby LC ² Includes receivables on purchase of assets. 1 2 Expanded Loan Portfolio
  • 9.
    Investor Relations| 3Q17| 9/15 R$ million Volume % Volume % Volume % Working capital¹ 2,672 42% 685 11% 3,356 53% Onlendings 316 5% 3 0% 319 5% Trade finance² 283 4% 30 0% 313 5% Res. 2.682 Loan Portfolio 3,271 52% 717 11% 3,989 63% Bank guarantees 1,893 30% 41 1% 1,934 31% Securities 285 5% 109 2% 395 6% Expanded Loan Portfolio 5,450 86% 868 14% 6,318 100% 1 Includes receivables on purchase of assets 2 Includes Standby LC Corporate Portfolio Monitored Portfolio Consolidated Portfolio Loan Portfolio Breakdown Breakdown – Corporate and Monitored Portfolio Consolidated Loan Portfolio Quality Non Performing Loans > 90 days (Total Contract)¹ ¹ Includes securities and ex-bank guarantees and stand by LC Overdue Total AA-D 71 3,271 E-H 197 717 Total Portfolio- Res 2,682 268 3,989 E-H Portfolio/Total 73.4% 18.0% E-H coverage ratio 303.7% 83.3% Consolidated Portfolio PP PP PPPP 4.2% 3.7% 0.7%0.6% 1.5%1.3% 0.7% 1.7% 1.2% Sept-17Jun-17Mar-17Dec-16Sept-16Jun-16Mar-16Dec-15Sept-15
  • 10.
    Ratings Sectors Average TicketEvolution (R$ K) Investor Relations| 3Q17 | 10/15 AA-B 75% C 25%  297 new operations  Total amount of R$2.9 billions  Average Ticket of approximately R$10 million Agriculture 16% Energy 16% Sugar and Ethanol 14% Real Estate 9% Transportation and 8% Chemical and petrochemical 7% Foreign Trade 6% Engineering 6% Others 18% Credit Production 16.981 15.000 17.000 19.000 21.000 23.000 25.000 2Q14 3Q14 4Q14 1Q15 2Q15 3Q15 4Q15 1Q16 2Q16 3Q16 4Q16 1Q17 2Q17 3Q17 25,953 24,635 16,981
  • 11.
    Investor Relations| 3Q17| 11/15 Funding 617 460 464 446 461 376 384 460 421 344 2,600 2,980 3,241 3,893 3,988 133 46 72 114 116 29 17 11 27 19 530 454 383 331 332 198 213 240 203 273 259 247 203 176 153 206 204 86 89 91 698 448 386 403 334 262 239 150 178 1425,908 5,692 5,697 6,280 6,252 Sept-16 Dec-16 Mar-17 Jun-17 Sept-17 Trade Finance: 2.3% Multilateral Lines: 5.3% International Capital Markets: 1.5% Financial Letter : 2.4% Local Capital Markets: 4.4% Onlending: 5.3% Demand Deposits: 0.3% Interbank Time Deposits: 1.9% High Net Worth Individual Time Deposits: 63.8% Corporate Time Deposits: 5.5% Institutional Time Deposits: 7.4%
  • 12.
    Investor Relations| 3Q17| 12/15  Pine launched its digital investment platform, Pine Online  Products: CDBs, LCAs and LCIs  App: IOS and Android  The Bank's five largest funding channels PINE ONLINE
  • 13.
    1.8 1.4 1.5 1.5 1.8 1.21.1 1.4 1.6 3Q15 4Q15 1Q16 2Q16 3Q16 4Q16 1Q17 2Q17 3Q17 Cash Position (R$ bi) 64% 68% 75% 78% 79% 36% 32% 25% 22% 21% Sept-16 Dec-16 Mar-17 Jun-17 Sept-17 Total Deposits Others Cash Position Total Deposits over Total Funding Capital Adequacy Ratio (BIS), Basel III Investor Relations| 3Q17 | 13/15 5,6975,908 5,692 6,277 6,252 Capital & Liability Management 15.3% 15.0% 14.7% 14.2% 11.9% 0.5% 0.5% 0.4% 0.4% 0.4% Sept-16 Dec-16 Mar-17 Jun-17 Sept-17 Tier II Tier I 12.4% 14.6% 15.1%15.4%15.8% 151% 124% 127% 128% 155% 103% 95% 121% 174% Cash/Equity Cash/Equity
  • 14.
    Investor Relations| 3Q17| 14/15 ¹Growth of expanded loan portfolio between 2% and 5%, as a result of continued diversification of the corporate portfolio and the run-off of the monitored portfolio. Guidance 2018 Expanded Loan Portfolio¹ 2% to 5% ROAE 2% to 5%
  • 15.
    Investor Relations| 3Q17| 15/15 Norberto Zaiet Junior CEO João Brito CFO Raquel Varela Bastos Head of Investor Relations, Local Funding and Communication Luiz Maximo Investor Relations Manager Kianne Paganini Investor Relations Analyst Phone: (55 11) 3372-5343 ir.pine.com ir@pine.com This report may contain forward-looking statements concerning the business prospects, projections of operating and financial results and growth outlook of PINE. These are merely projections and as such are based solely on management’s expectations regarding the future of the business. These statements depend substantially on market conditions, the performance of the sector and the Brazilian economy (political and economic changes, volatility in interest and exchange rates, technological changes, inflation, financial disintermediation, competitive pressures on products and prices and changes in tax legislation) and therefore are subject to change without prior notice. Investor Relations