Download to read offline


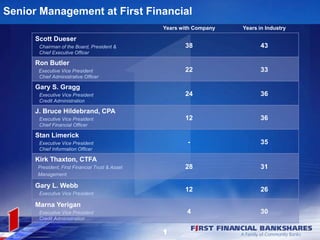
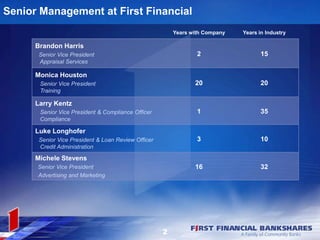
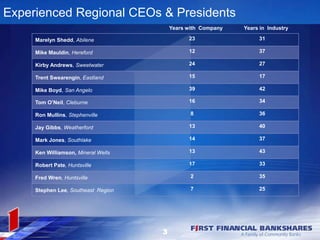


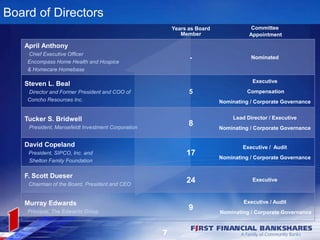
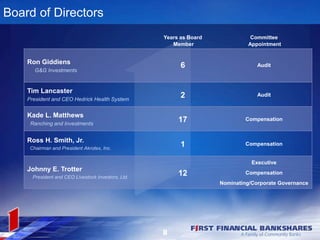


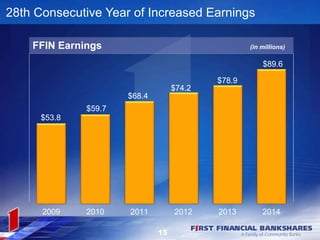
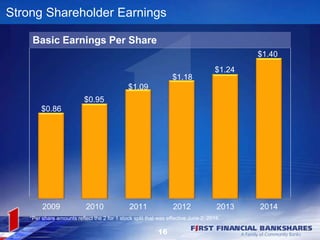
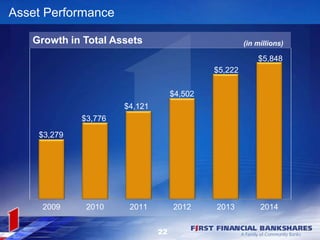
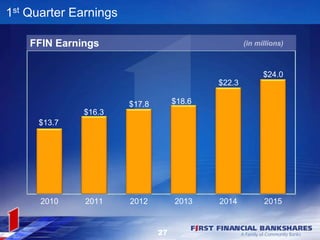
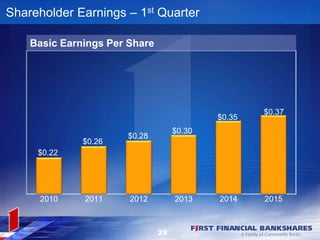

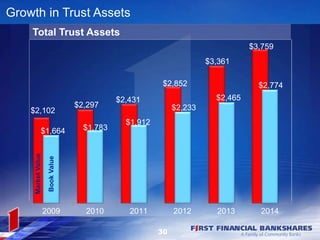
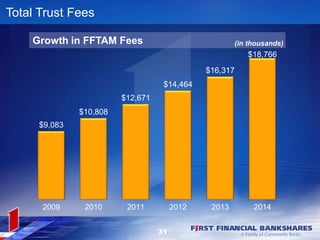


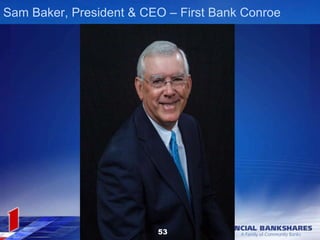


This document provides an overview of First Financial Bank's annual shareholder meeting in 2015. It includes information on senior management, regional CEOs and presidents, board of directors, auditors, and financial performance highlights for 2014 and the first quarter of 2015. Key details include 28 consecutive years of increased earnings, continued growth in assets, loans, and deposits, and sound capital ratios and credit quality. The acquisition of First Bank of Conroe and 4Trust Mortgage are also announced.


