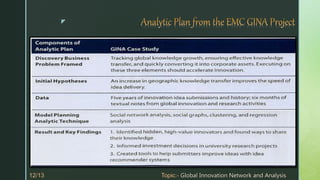
z
SNJB’s Late Sau K. B. Jain COE, Chandwad
Department of Computer Engineering
Academic Year- 2020-21
Subject: Data Analytics
z
 Global Innovation Network and Analytics (GINA) team is a group of senior
technologists located in centers of excellence (COEs) around the world.
 This team’s charter is to engage employees across global COEs to drive
innovation, research, and university partnerships.
 The GINA case study provides an example of how a team applied the
Data Analytics Lifecycle to analyze innovation data at EMC.
 Innovation is typically a difficult concept to measure, and this team wanted
to look for ways to use advanced analytical methods to identify key
innovators within the company.
z
 The GINA team thought its approach would provide a means to share
ideas globally and increase knowledge sharing among GINA members who
may be separated geographically .
 It planned to create a data repository containing both structured and
unstructured data to accomplish three main goals:
 Store formal and informal data.
 Track research from global technologists.
 Mine the data for patterns and insights to improve the team’s
operations and strategy
z
 In the GINA project’s discovery phase, the team began identifying data
sources.
 The Various Roles are involved in this phase :
 Business user, project sponsor, project manager :– Vice President from Office
of CTO
 BI analyst :– person from IT
 Data engineer and DBA :– people from IT
 Data scientist :– distinguished engineer
z
 The data for the project fell into two main categories :-
 Innovation Roadmap.
 Data encompassed minutes and notes representing innovation
and research activity from around the world.
 The GINA (Hypothesis) can be grouped into two categories :-
 Descriptive analytics of what is currently happening to spark further
creativity, collaboration, and asset generation.
 Predictive analytics to advise executive management of where it
should be investing in the future. Global Innovation Network.
z
 IT department to set up a new analytics sandbox to store and experiment
on the data.
 The data scientists and data engineers began to notice that certain data
needed conditioning and normalization.
 As the team explored the data, it quickly realized that if it did not have
data of sufficient quality or could not get good quality data, it would not be
able to perform the subsequent steps in the lifecycle process.
 Important to determine what level of data quality and cleanliness was
sufficient for the project being undertaken.
z
 The team made a decision to initiate a longitudinal study to begin tracking data
points over time regarding people developing new intellectual property.
 The parameters related to the scope of the study included the following
considerations:
 Identify the right milestones to achieve this goal.
 Trace how people move ideas from each milestone toward the goal.
 Once this is done, trace ideas that die, and trace others that reach the goal.
Compare the journeys of ideas that make it and those that do not.
 Compare the times and the outcomes using a few different methods (depending on
how the data is collected and assembled). These could be as simple as t-tests or
perhaps involve different types of classification algorithms.
z
 The GINA team employed several analytical methods. This included work by
the data scientist using Natural Language Processing (NLP) techniques on
the textual descriptions of the Innovation Roadmap ideas.
 Social network analysis using R and Rstudio.
Fig. Social graph [27] visualization of idea submitters and finalists.
z
 Fig shows social graphs that portray the relationships between idea
submitters within GINA.
 Each colour represents an innovator from a different country.
 The large dots with red circles around them represent hubs. A hub
represents a person with high connectivity and a high “betweenness” score.
 The team used Tableau software for data visualization and exploration and
used the Pivotal Greenplum database as the main data repository and
analytics engine.
z
 This project was considered successful in identifying boundary spanners
and hidden innovators.
 The GINA project promoted knowledge sharing related to innovation and
researchers spanning multiple areas within the company and outside of it.
 GINA also enabled EMC to cultivate additional intellectual property that
led to additional research topics and provided opportunities to forge
relationships with universities for joint academic research in the fields of
Data Science and Big Data.
z
 Study was successful in in identifying hidden innovators :
 Found high density of innovators in Cork, Ireland.
 The CTO office launched longitudinal studies to begin data collection
efforts and track innovation results over longer periods of time.
z
 Deployment was not really discussed .
 Key findings :
 Need more data in future
 Some data were sensitive
 A parallel initiative needs to be created to improve basic BI activities
 A mechanism is needed to continually reevaluate the model after
deployment
z
z
 https://data-science-and-big-data-analy-nieizv_book.pdf.
 https://bhavanakhivsara.files.wordpress.com/2018/07/data
-analytics-unit-i-1.pptx

Case study on gina(gobal innovation network and analysis)

  • 1.
    z SNJB’s Late SauK. B. Jain COE, Chandwad Department of Computer Engineering Academic Year- 2020-21 Subject: Data Analytics
  • 2.
    z  Global InnovationNetwork and Analytics (GINA) team is a group of senior technologists located in centers of excellence (COEs) around the world.  This team’s charter is to engage employees across global COEs to drive innovation, research, and university partnerships.  The GINA case study provides an example of how a team applied the Data Analytics Lifecycle to analyze innovation data at EMC.  Innovation is typically a difficult concept to measure, and this team wanted to look for ways to use advanced analytical methods to identify key innovators within the company.
  • 3.
    z  The GINAteam thought its approach would provide a means to share ideas globally and increase knowledge sharing among GINA members who may be separated geographically .  It planned to create a data repository containing both structured and unstructured data to accomplish three main goals:  Store formal and informal data.  Track research from global technologists.  Mine the data for patterns and insights to improve the team’s operations and strategy
  • 4.
    z  In theGINA project’s discovery phase, the team began identifying data sources.  The Various Roles are involved in this phase :  Business user, project sponsor, project manager :– Vice President from Office of CTO  BI analyst :– person from IT  Data engineer and DBA :– people from IT  Data scientist :– distinguished engineer
  • 5.
    z  The datafor the project fell into two main categories :-  Innovation Roadmap.  Data encompassed minutes and notes representing innovation and research activity from around the world.  The GINA (Hypothesis) can be grouped into two categories :-  Descriptive analytics of what is currently happening to spark further creativity, collaboration, and asset generation.  Predictive analytics to advise executive management of where it should be investing in the future. Global Innovation Network.
  • 6.
    z  IT departmentto set up a new analytics sandbox to store and experiment on the data.  The data scientists and data engineers began to notice that certain data needed conditioning and normalization.  As the team explored the data, it quickly realized that if it did not have data of sufficient quality or could not get good quality data, it would not be able to perform the subsequent steps in the lifecycle process.  Important to determine what level of data quality and cleanliness was sufficient for the project being undertaken.
  • 7.
    z  The teammade a decision to initiate a longitudinal study to begin tracking data points over time regarding people developing new intellectual property.  The parameters related to the scope of the study included the following considerations:  Identify the right milestones to achieve this goal.  Trace how people move ideas from each milestone toward the goal.  Once this is done, trace ideas that die, and trace others that reach the goal. Compare the journeys of ideas that make it and those that do not.  Compare the times and the outcomes using a few different methods (depending on how the data is collected and assembled). These could be as simple as t-tests or perhaps involve different types of classification algorithms.
  • 8.
    z  The GINAteam employed several analytical methods. This included work by the data scientist using Natural Language Processing (NLP) techniques on the textual descriptions of the Innovation Roadmap ideas.  Social network analysis using R and Rstudio. Fig. Social graph [27] visualization of idea submitters and finalists.
  • 9.
    z  Fig showssocial graphs that portray the relationships between idea submitters within GINA.  Each colour represents an innovator from a different country.  The large dots with red circles around them represent hubs. A hub represents a person with high connectivity and a high “betweenness” score.  The team used Tableau software for data visualization and exploration and used the Pivotal Greenplum database as the main data repository and analytics engine.
  • 10.
    z  This projectwas considered successful in identifying boundary spanners and hidden innovators.  The GINA project promoted knowledge sharing related to innovation and researchers spanning multiple areas within the company and outside of it.  GINA also enabled EMC to cultivate additional intellectual property that led to additional research topics and provided opportunities to forge relationships with universities for joint academic research in the fields of Data Science and Big Data.
  • 11.
    z  Study wassuccessful in in identifying hidden innovators :  Found high density of innovators in Cork, Ireland.  The CTO office launched longitudinal studies to begin data collection efforts and track innovation results over longer periods of time.
  • 12.
    z  Deployment wasnot really discussed .  Key findings :  Need more data in future  Some data were sensitive  A parallel initiative needs to be created to improve basic BI activities  A mechanism is needed to continually reevaluate the model after deployment
  • 13.
  • 14.