This document provides a summary and analysis of employment and social developments in Europe in 2014. It finds that while growth has resumed, obstacles to job creation remain, including weak demand, crisis legacies, and recurrent issues. Youth, the long-term unemployed, and low-skilled workers face particular challenges benefiting from growth. Job polarization is ongoing, emphasizing the need for lifelong learning. Household incomes declined in the crisis but are recovering, though poverty risks remain, requiring training, quality jobs, and effective social policies. Social and labor market imbalances can negatively impact GDP growth both domestically and across borders. The crisis had lasting effects on welfare systems, labor market institutions, and society, but countries that invested in human capital


![14
Employment and Social Developments in Europe 2014
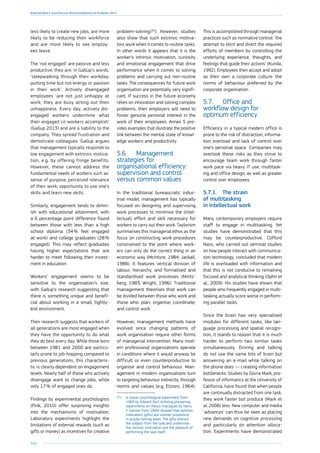
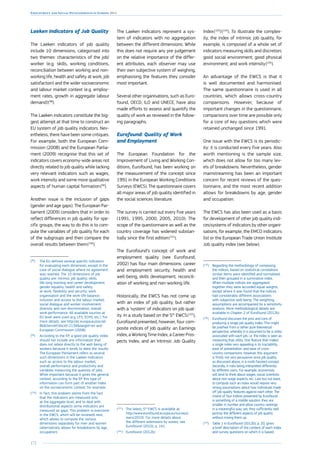
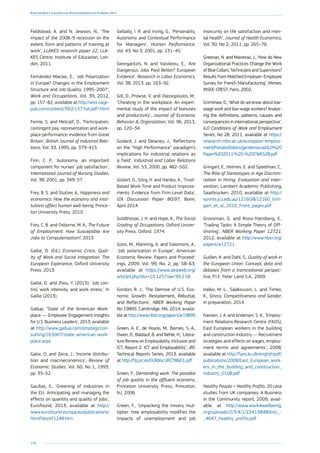
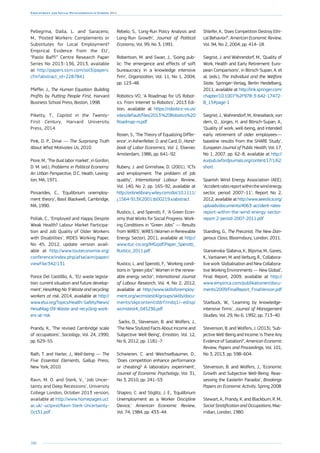
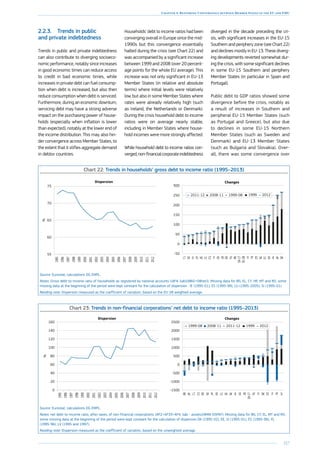
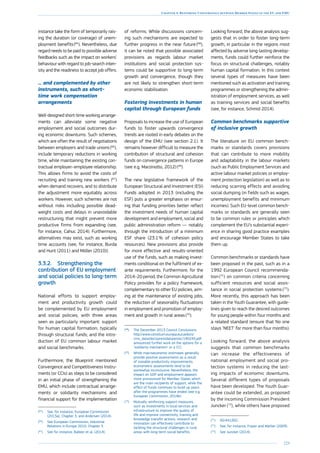
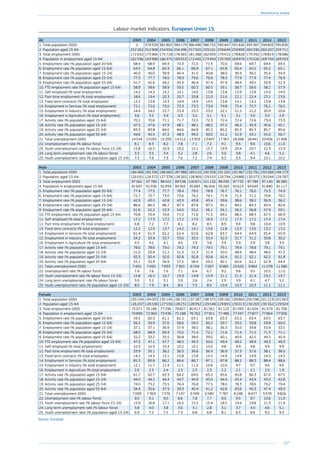
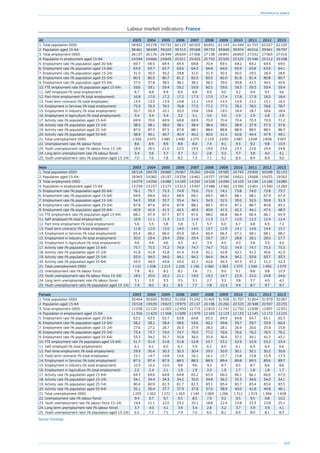
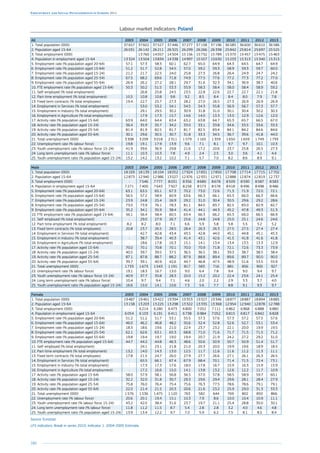
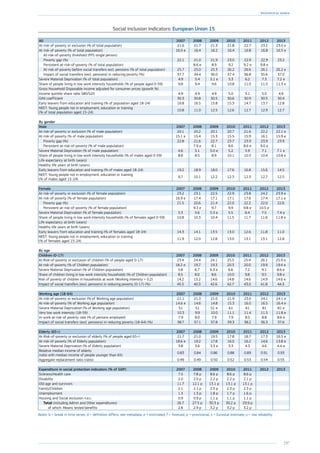
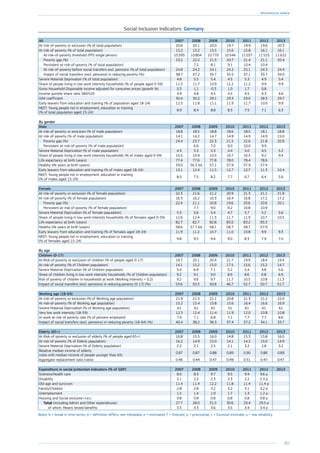
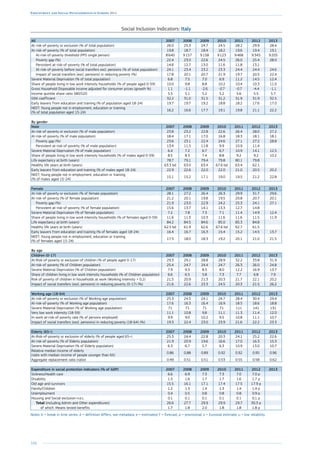
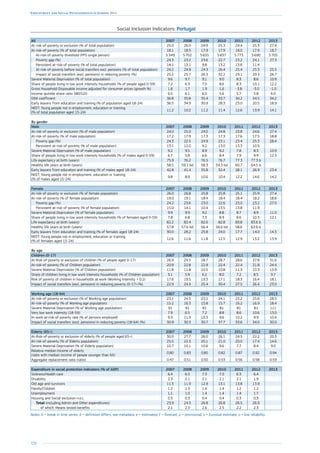
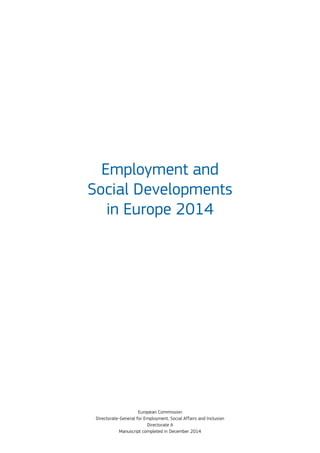
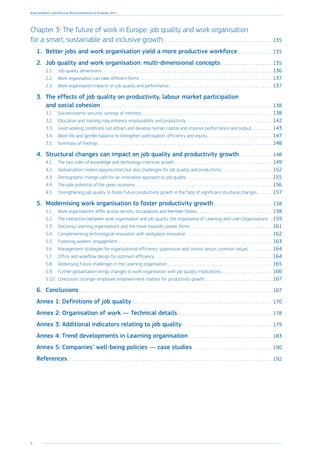
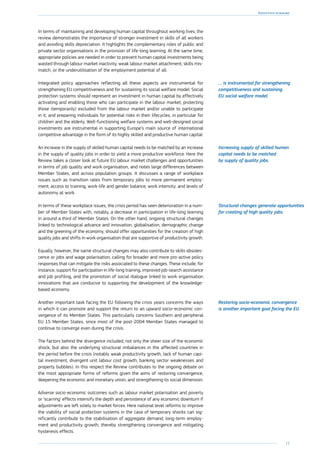
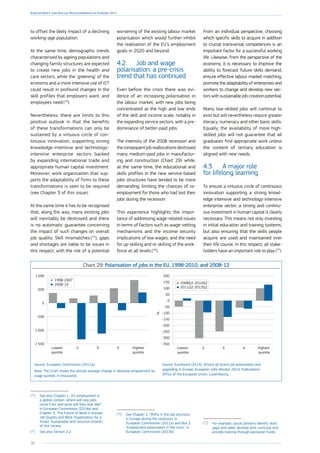
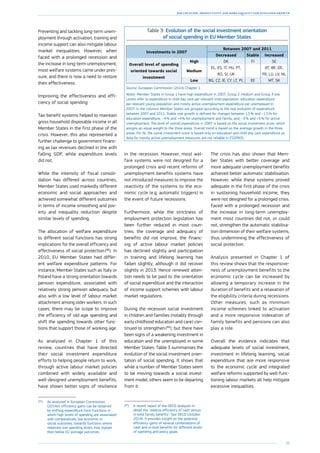
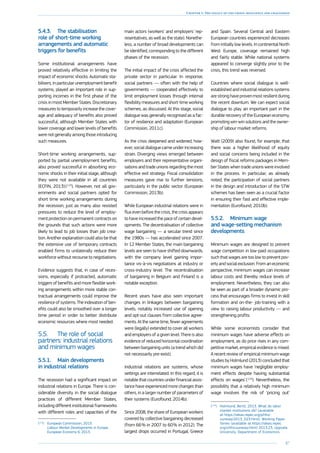
rates (for 20-64) remain well below
pre-crisis levels (68.4 % in 2013 vs.
70.3 % in 2008) and a long way off
the Europe 2020 target of 75 %. While
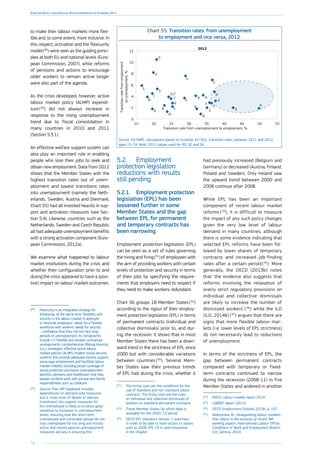
6.7 million jobs were destroyed between
2008 and the first quarter of 2013, the
number of jobs increased by 1.8 million up
to the second quarter of 2014. Moreover,
a large proportion of the new jobs cre-
ated recently are temporary or part-time,
raising concerns about the robustness of
the recovery.
The impact of the crisis on employment
and the social situation increased as the
unemployment rate rose from less than
7 % in 2008 to 10.8 % in 2013, putting
9 million more people out of work. The
effects were unevenly spread across the
EU however, with unemployment rates in
2013 still only around 5 % in Austria and
Germany against over 25 % in Greece
and Spain.
While the economic recovery is expected
to strengthen only gradually, EU employ-
ment is foreseen to start growing from
this year onwards, leading to a decline
in the overall EU unemployment rate
towards 9.5 % by 2016, according to the
Commission autumn forecast.
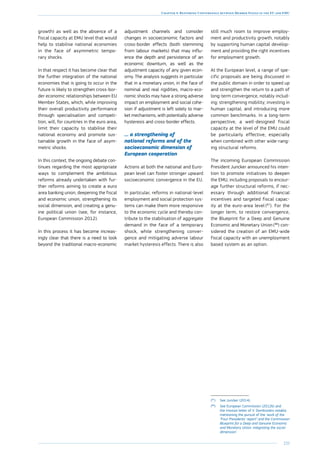
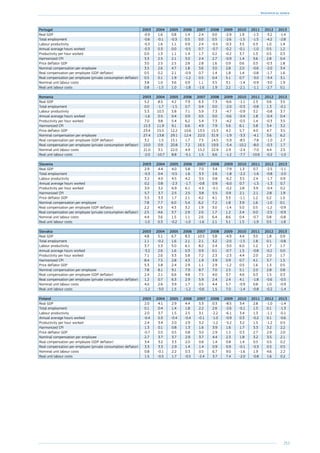
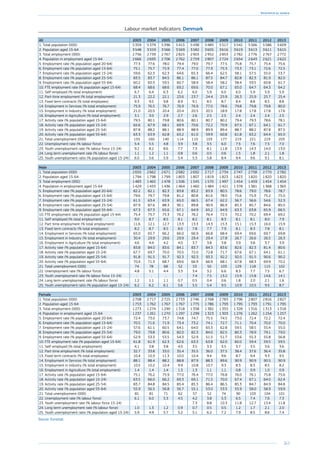
Cross-country differences in employ-
ment are large. Between 2008 and mid-
2014 most of the jobs were destroyed
in Spain (-3.4 million), Italy (-1.2 million),
and Greece (-1.0 million), while the num-
ber of jobs increased by 1.8 million in
Germany, and by 0.9 million in the United
Kingdom during the same period.
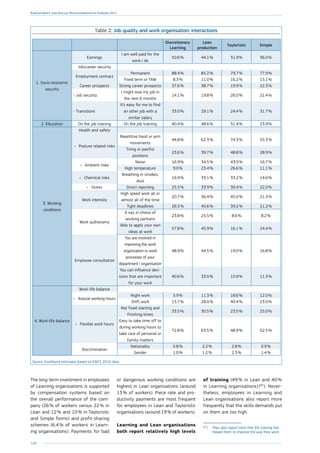
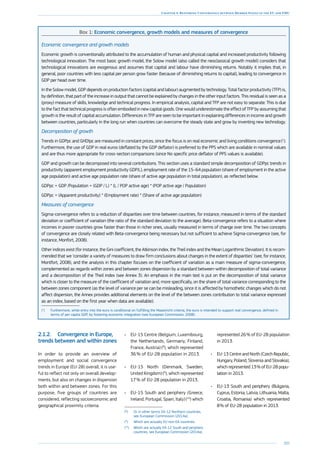
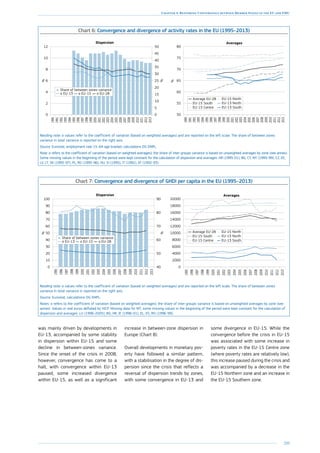
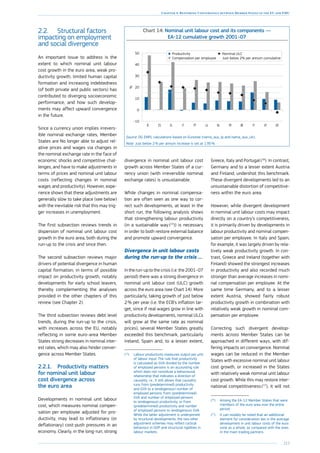
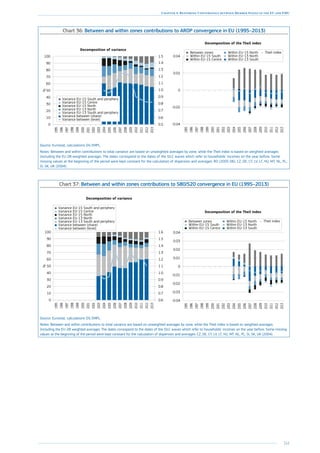
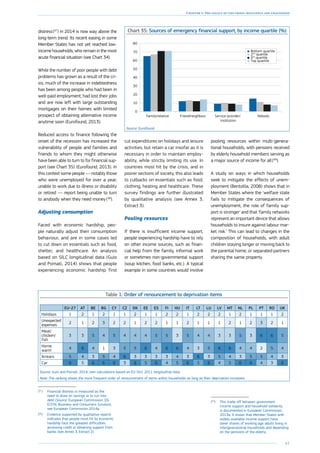
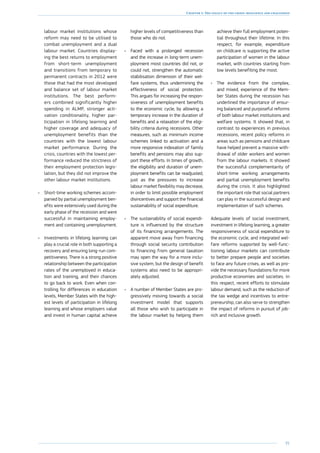
Employment divergence was reflected in
cross-country differences in unemploy-
ment, particularly in the euro area, with
Southern/peripheral countries seeing a
massive increase while rates remained
stable and low in the Northern/core
countries (see Chart 2). The dispersion in
unemployment rates is expected to start
to decline only gradually, still remaining
well above the pre-crisis level.
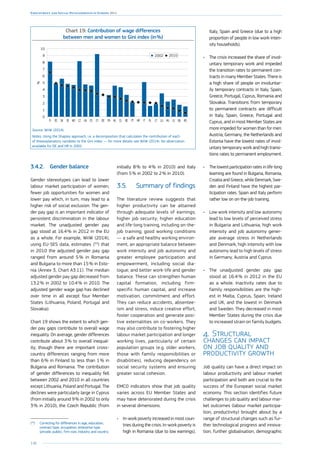
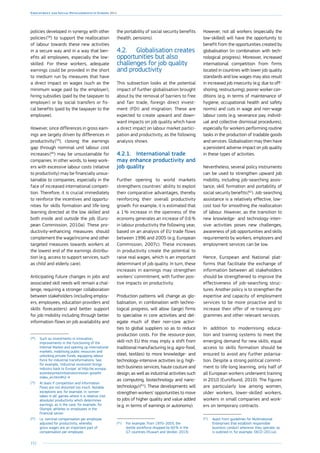
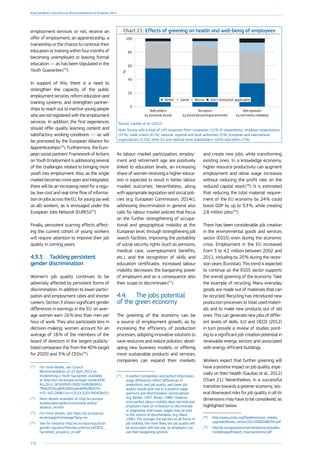
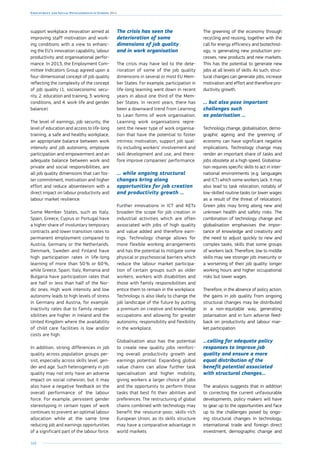
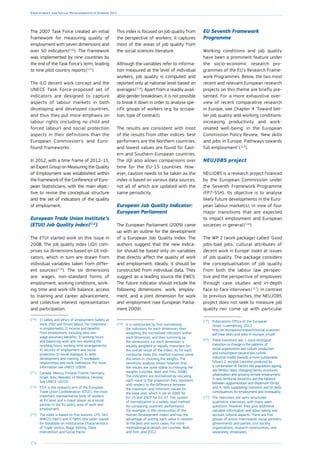
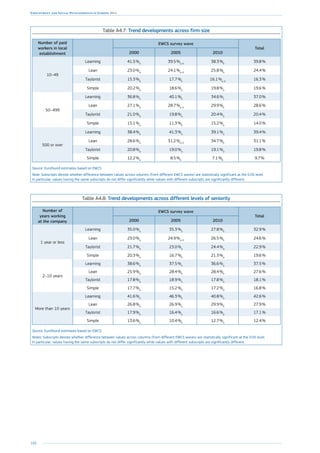
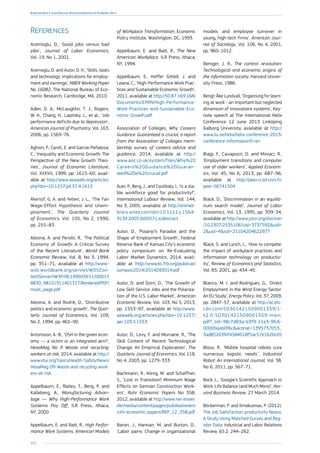
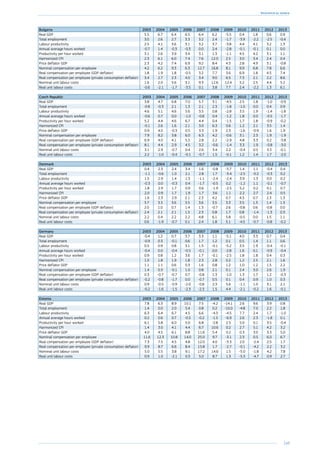
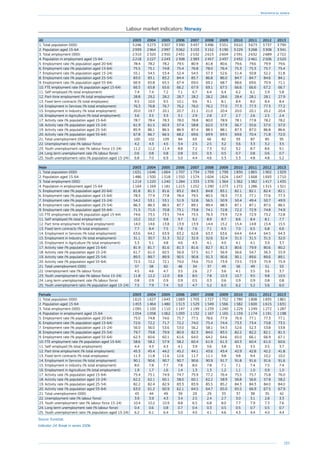
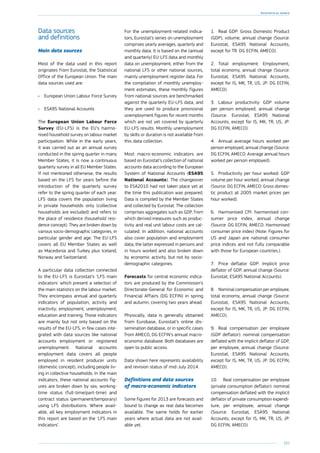
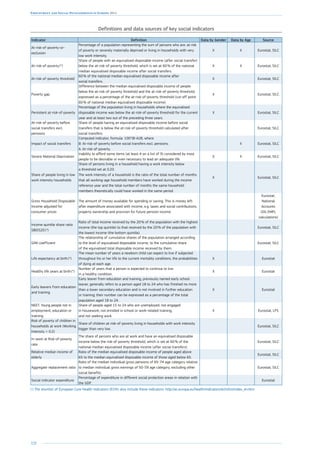
Chart 1: Growth in real GDP, real household disposable income
and employment, year-on-year change
-8
-6
-4
-2
0
2
4
Q2Q1Q4Q3Q2Q1Q4Q3Q2Q1Q4Q3Q2Q1Q4Q3Q2Q1Q4Q3Q2Q1Q4Q3Q2Q1Q4Q3Q2Q1
%changeonpreviousyear
GDP
GDHI
Employment
2007 2008 2009 2010 2011 2012 2013 2014
Source: Eurostat, National Accounts, data non-seasonally adjusted [namq_gdp_k]
Chart 2: Unemployment rates in the EU by group of Member States
0
5
10
15
20
201420132012201120102009200820072006200520042003200220012000
Non-EA South and peripheryEA North and core
EA South and peripheryNon-EA North
%oflabourforce15-74
Source: Eurostat, EU-LFS; DG EMPL calculations.
Note: EA North and core: AT BE DE FI FR LU NL, EA South and periphery: EE EL ES IE IT CY MT PT SI SK LV
Non-EA north: CZ DK PL SE UK, Non-EA South and periphery: BG HR LT HU RO.
Chart 3: Youth unemployment rates in the EU Member States
in August 2014 and the highest and lowest rates since 2008
%oflabourforce15-24
0
10
20
30
40
50
60
70
ESELITHRCYPTSKIEROFRBE
EA-18
PLBGLVSE
EU-28
LTHUFISICZUKLUMTEEDKNLATDE
August 2014
Highest rate since 2008
Lowest rate since 2008
Source: Eurostat, EU-LFS data, seasonally adjusted [une_rt_m].
Notes: EE EL HU UK Jul 2014 CY HR LV RO SI 2014Q2.
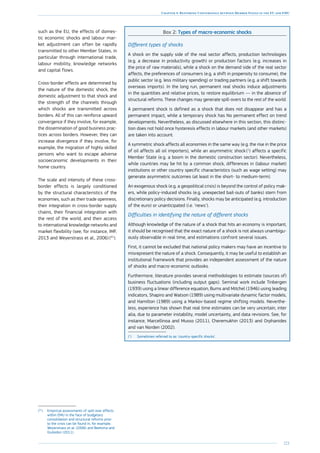
The convergence in the cyclical positions
and the ongoing labour cost adjustment
in high-unemployment countries would
contribute to further reduce the diver-
gence of labour market conditions in
the EU. Nevertheless, the present diver-
gence shows the need to look beyond
the traditional macro-economic adjust-
ment channels and consider changes in
socio-economic factors and cross-border
effects that may influence the depth and](https://image.slidesharecdn.com/fd1af655-5d67-4954-a059-19619f458af7-150123121918-conversion-gate01/85/KE-BD-14-001-EN-N-16-320.jpg)
![15
Job creation, productivity and more equality for sustained growth
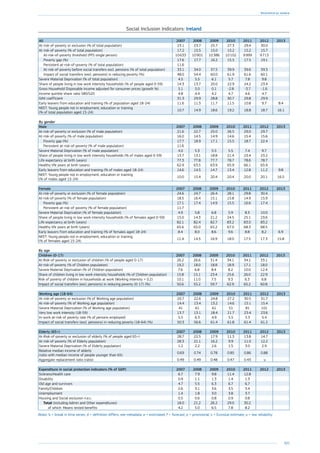
persistence of an economic downturn as
well as the adjustment capacity of any
given economy (7
).
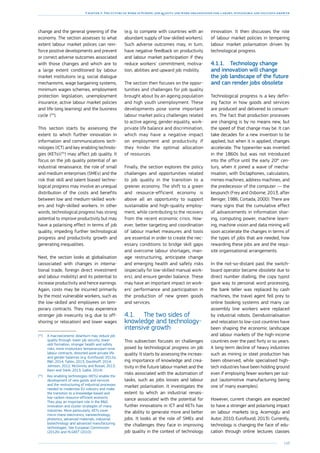
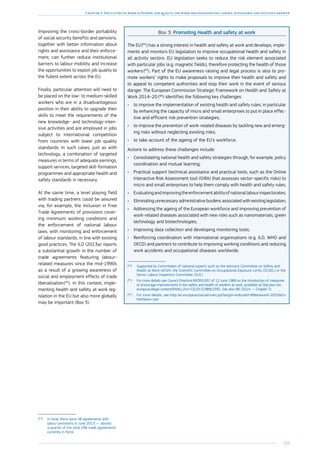
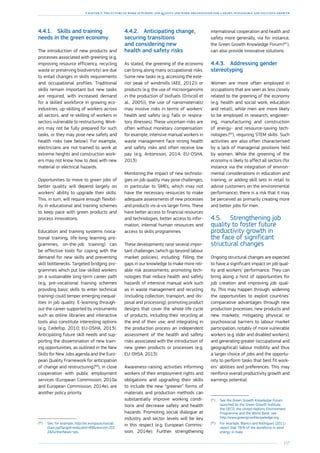
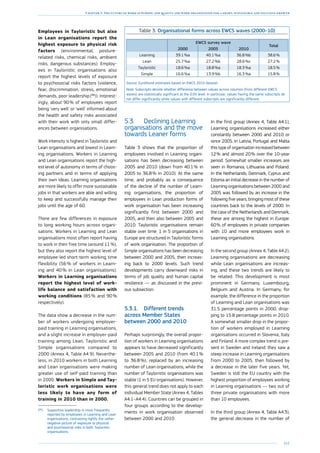
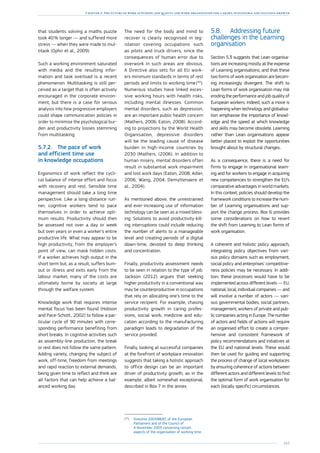
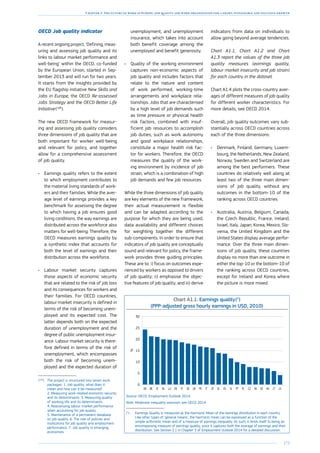
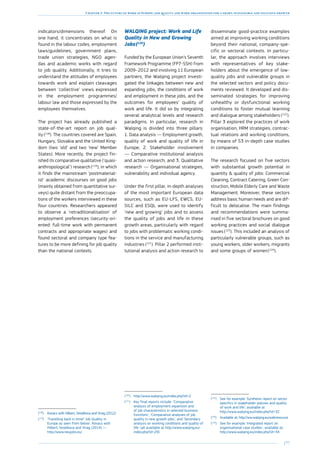
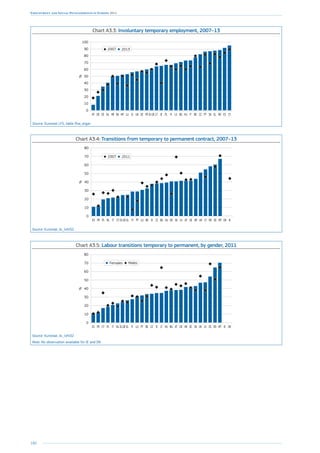
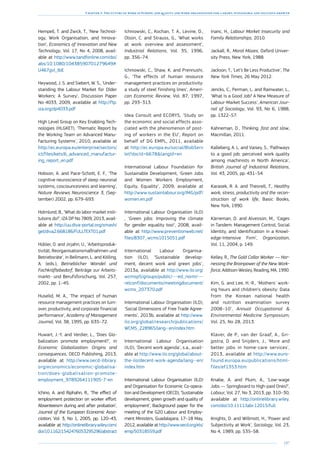
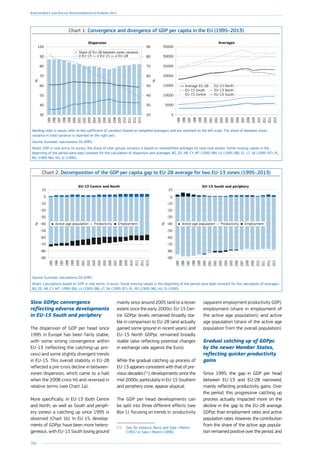
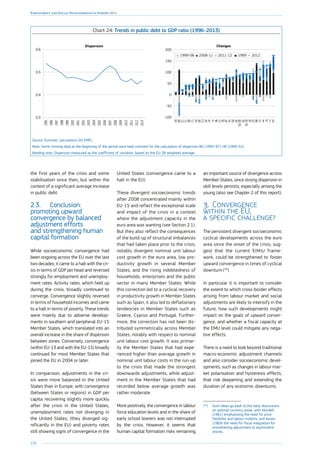
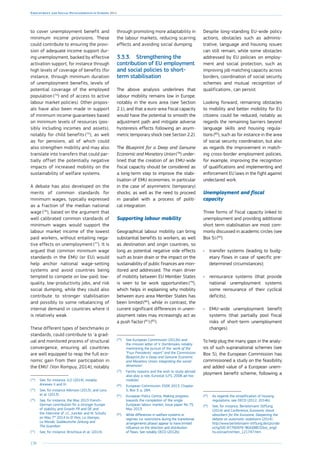
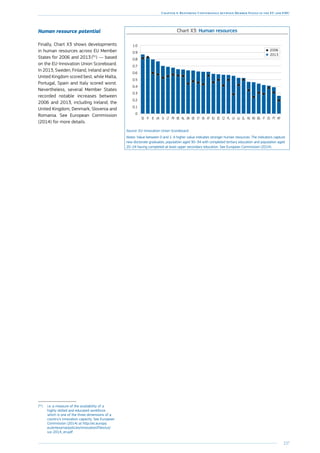
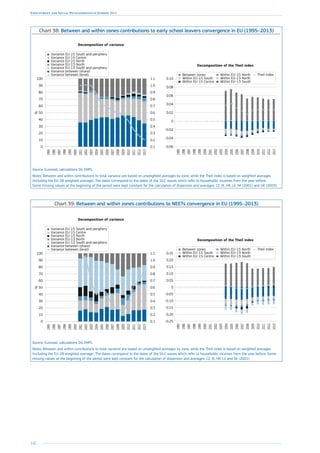
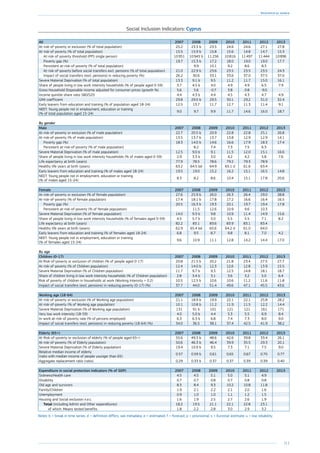
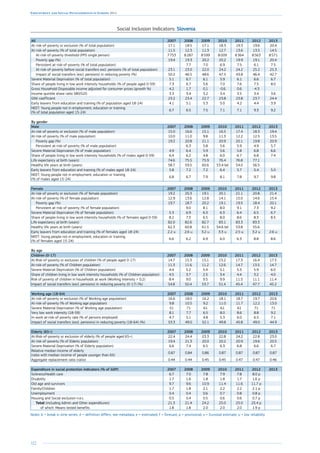
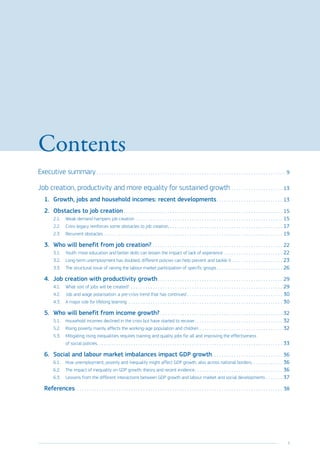
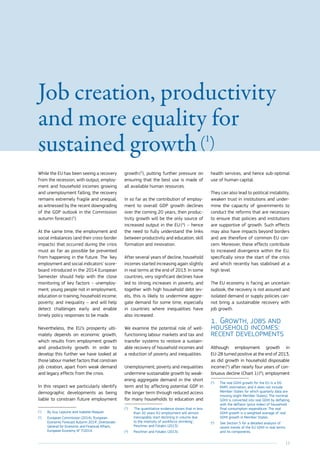
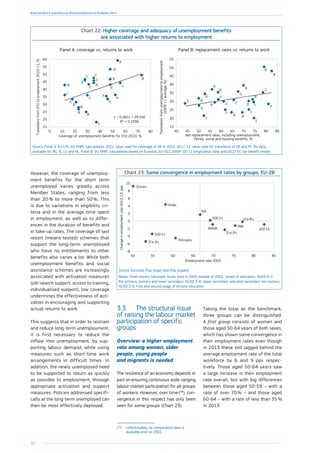
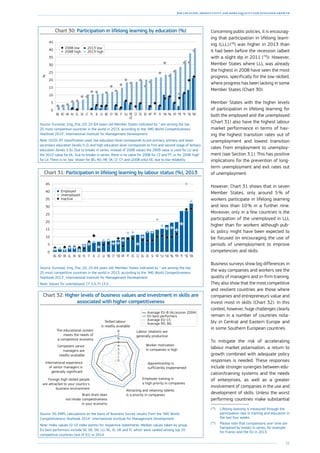
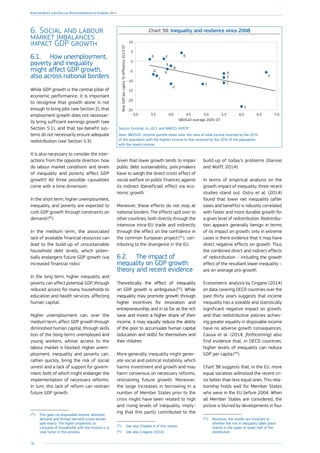
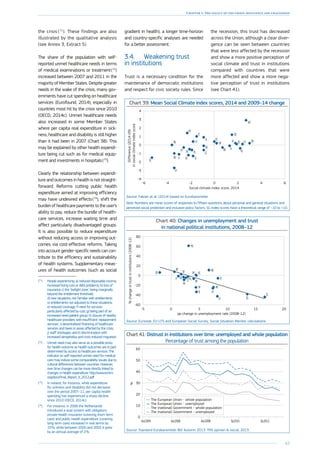
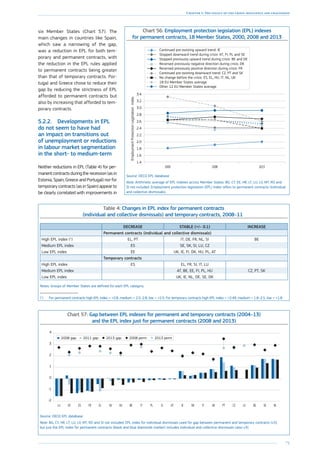
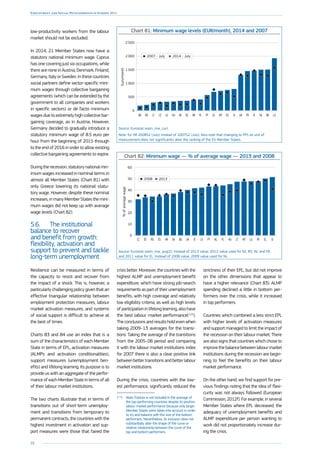
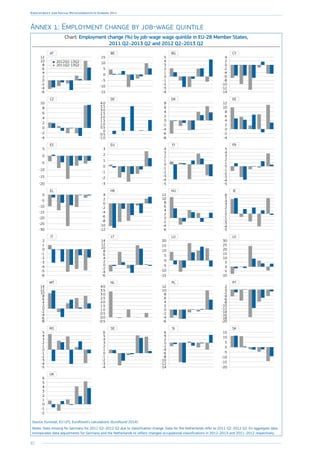
The situation of young people and the
long-term unemployed is of particular
concern. In almost two thirds of Mem-
ber States, youth unemployment rates in
July 2014 were still close to their historic
highs – EU average of 21.7 % compared
to about 15 % in the first half of 2008 –
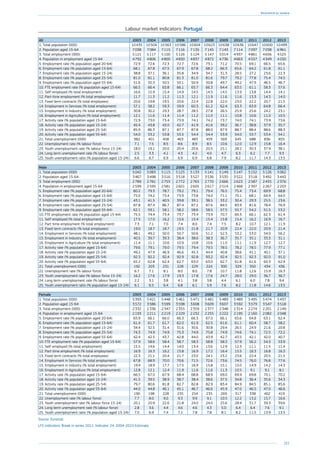
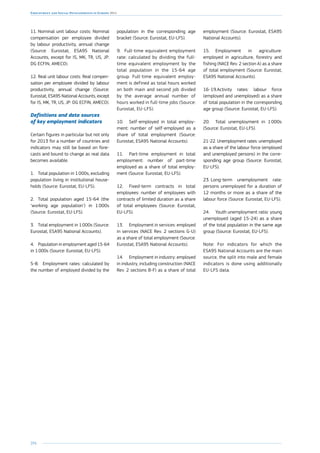
(Chart 3) while the proportion of young
people not in education or employment
(NEET) reached 13 % in 2011 against
11 % in 2008 (Chart 4). Again, however,
it varies considerably between Mem-
ber States while remaining higher than
before the downturn.
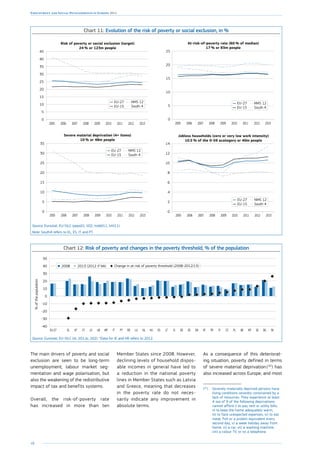
Such severe labour market deterioration
has had inevitable social consequences
with the number of people at risk of pov-
erty and social exclusion rising by more
than 6 million since 2008, reaching some
123 million in 2013, and taking us fur-
ther from the Europe 2020 target of hav-
ing at least 20 million fewer people in or
at risk of poverty and social exclusion.
Poverty and social exclusion among
those of working age (18-64 years)
has increased significantly in two thirds
of the Member States as a combined
result of rising levels of jobless and low
work intensity households, and in-work
poverty. In Greece, Ireland, Spain, Italy
and Hungary, poverty, social exclusion
and inequalities have increased signifi-
cantly from already high levels prior to
the crisis.
(7
) See also Chapter 4 of this review.
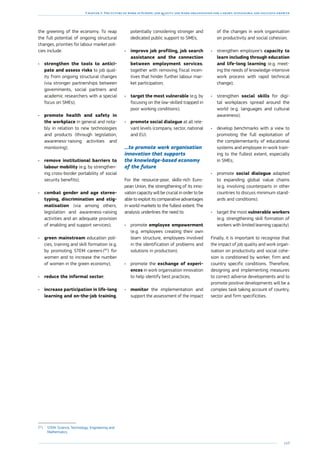
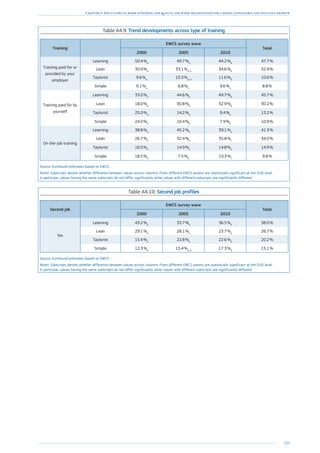
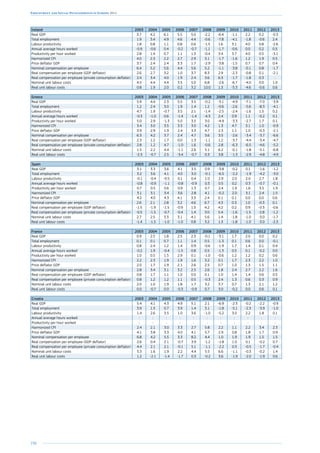
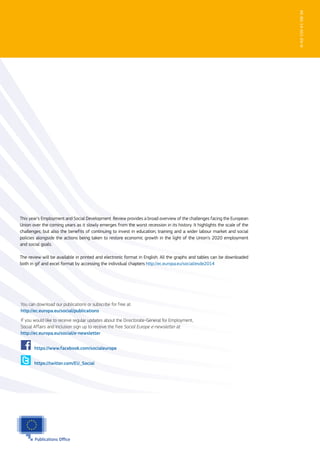
Chart 4: NEET rate for the EU, EA and Member States in 2013
and the highest and lowest rates since 2008
0
5
10
15
20
25
ITBGELCYESHRROIEHUPTSKUKLV
EU-28
EA-18
BEPLEEFRLTMTFISICZSEATDEDKNLLU
2013
Highest rate since 2008
Lowest rate since 2008
%ofpopulation15-24
Source: Eurostat, EU-LFS data [edat_lfse_20].
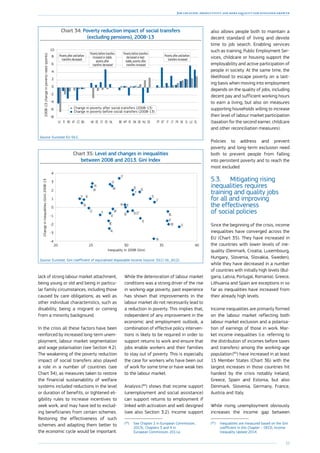
Chart 5: Evolution of the risk-of-poverty or social exclusion,
2008 and 2013
0
5
10
15
20
25
30
35
40
45
50
BGELHULTIEITCYESMTLUDKLVHRPTUKEU-28EEEA-18SISENLBEDEFRROPLSKATFICZ
2008 2012/2013
%ofpopulation
Decrease Stable Increase Strongincrease
Source: Eurostat, EU SILC [ilc_peps01], income year 2007, 2012.
Notes: ES 2013 break in series (classified as strong increase based on 2008-2012 change), AT and UK
2012 break in series, HR 2010 instead of 2008 and 2012 instead of 2013, IE 2012 instead of 2013,
EU-27 instead of EU-28 in 2008.
Chart 6: Inequality of income distribution (income quintile share ratio
S80/S20), 2008 and 2013
Ratio
Decrease Stable Increase Strongincrease
0
1
2
3
4
5
6
7
8
ELESITEEHRCYLUDKHULTIESESKSIBGPT
EA-18
EU-28
FRATCZROLVPLDEUKMTBEFINL
2008 2013
Source: Eurostat, EU SILC [ilc_di11], income year 2007, 2012.
Notes: ES 2013 break in series, AT and UK 2012 break in series, HR 2010 instead of 2008, IE 2012
instead of 2013, EU-27 instead of EU-28 in 2008.
2. Obstacles to job
creation
The legacy of the crisis poses significant
obstacles to job creation now, which add
to many of the obstacles that were pre-
sent before the crisis and are still in place.
2.1. Weak demand
hampers job creation
Weak demand is a major obstacle to
job creation. While EU GDP growth was
1.2 % year-on-year in the second quar-
ter of 2014, potential growth estimates
suggest little room for further accelera-
tion from there under ‘no policy change’
assumptions. Commission estimates put
potential growth in the EU at 1.0 % in
2015, accelerating slightly to 1.4 % in](https://image.slidesharecdn.com/fd1af655-5d67-4954-a059-19619f458af7-150123121918-conversion-gate01/85/KE-BD-14-001-EN-N-17-320.jpg)
![32
Employment and Social Developments in Europe 2014
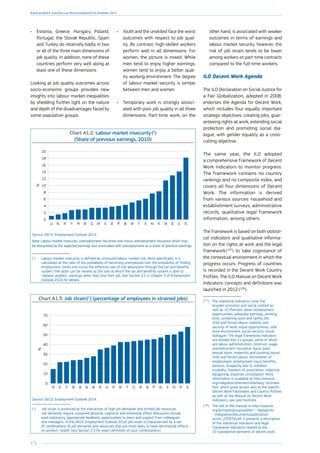
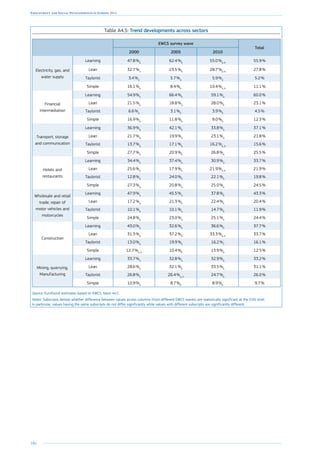
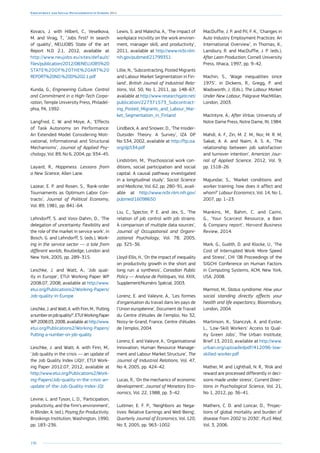
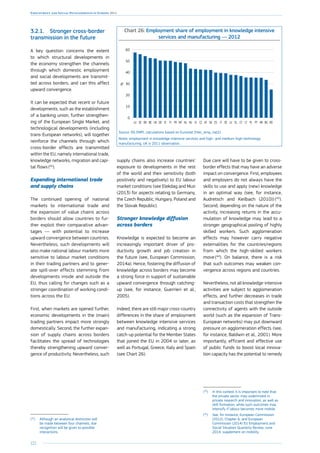
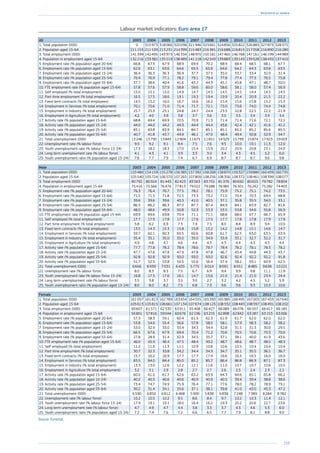
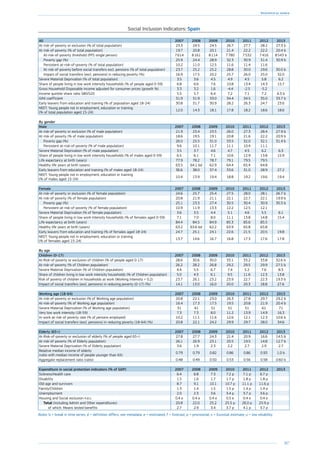
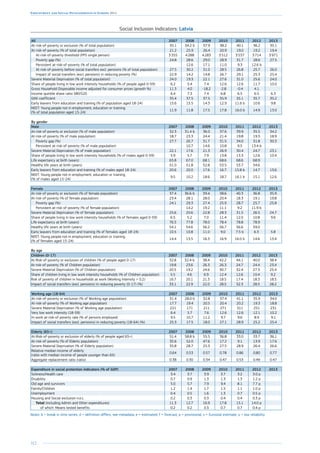
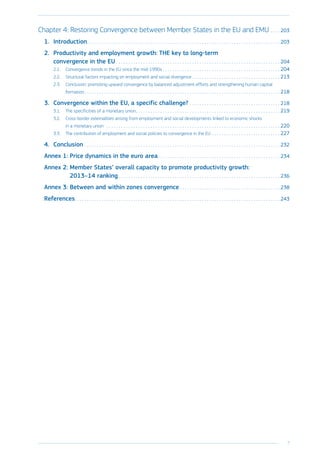
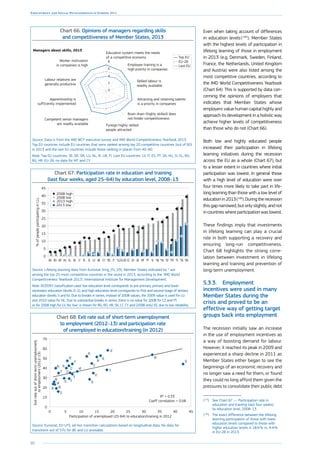
improvements in in-firm training, and
this requires a big change of attitude by
companies, skills and productivity will
continue to languish.
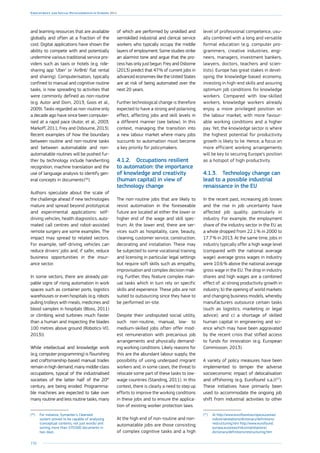
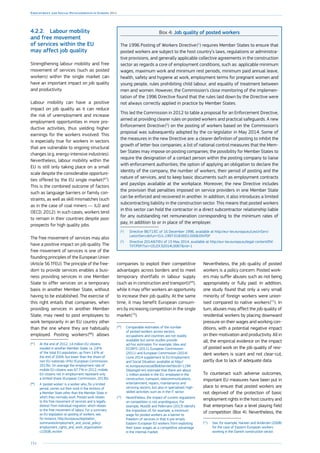
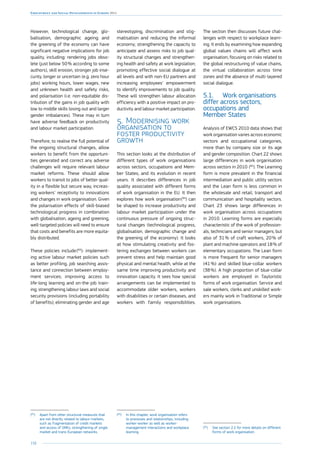
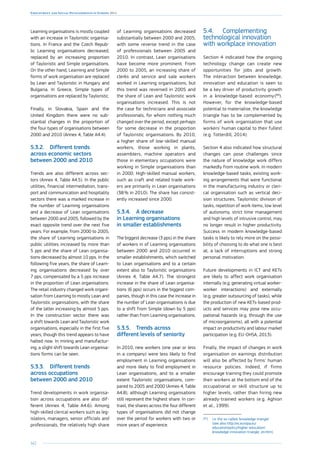
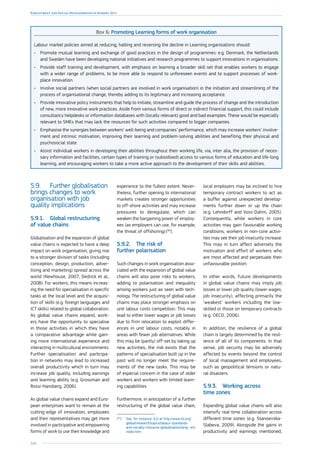
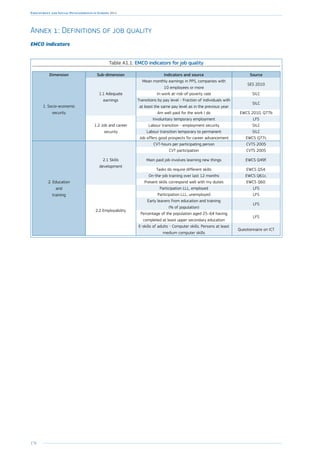
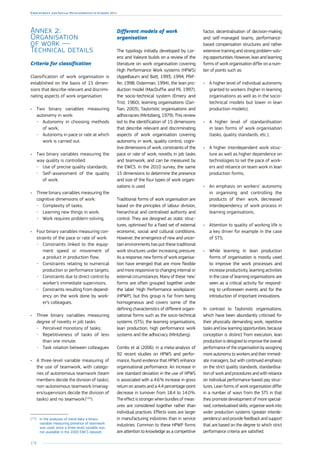
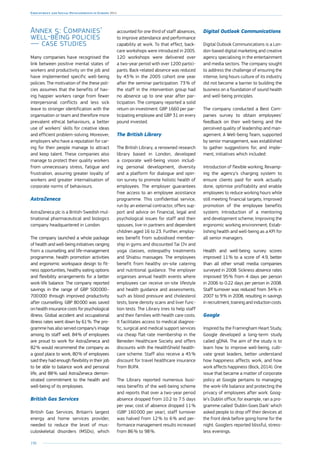
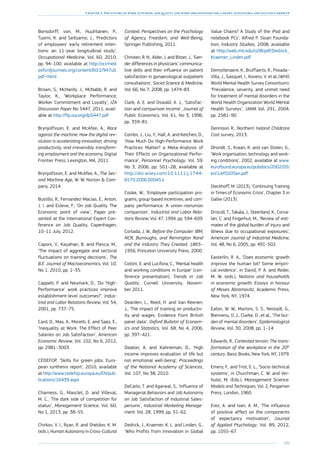
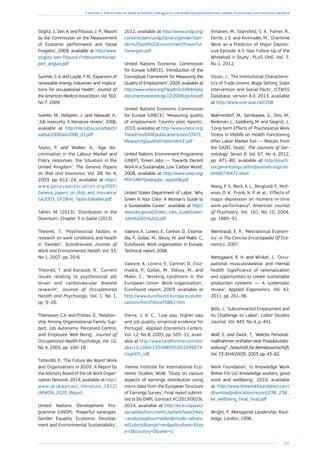
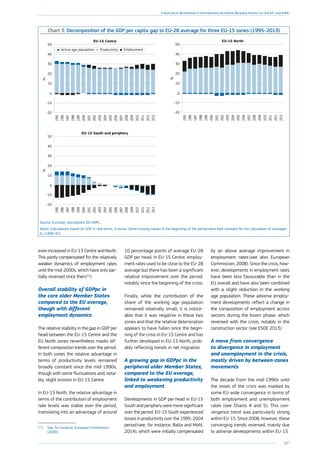
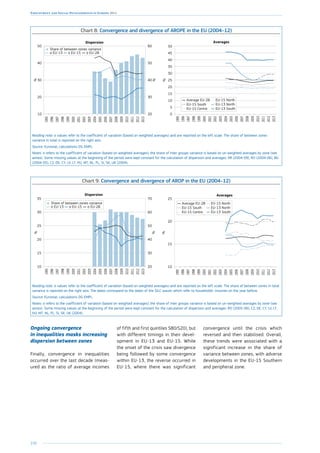
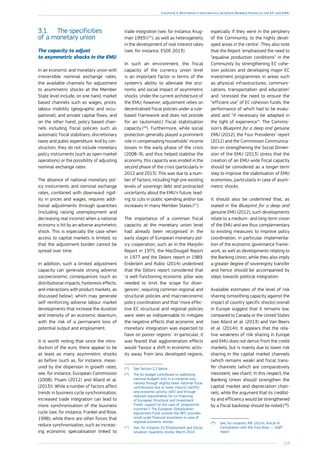
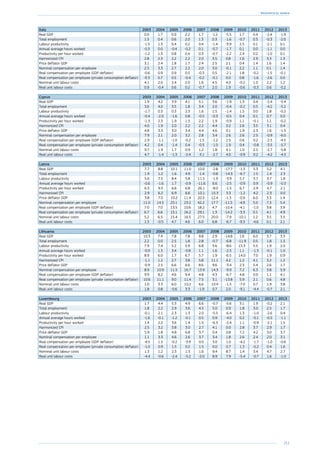
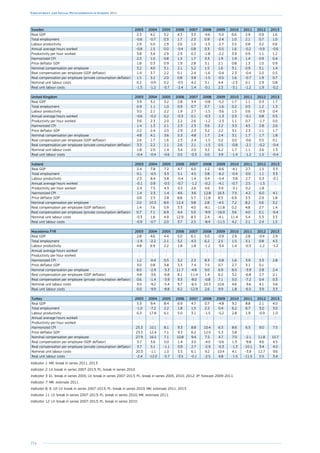
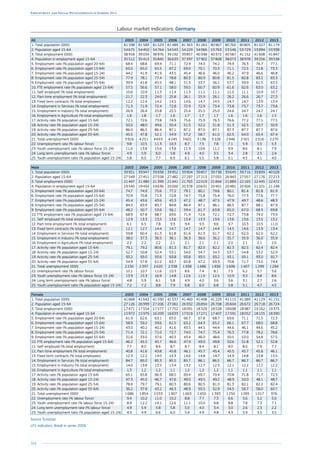
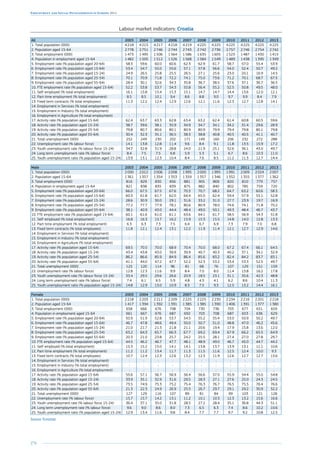
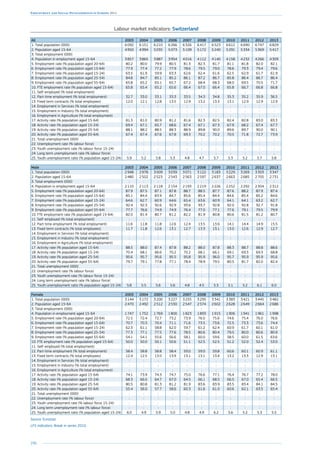
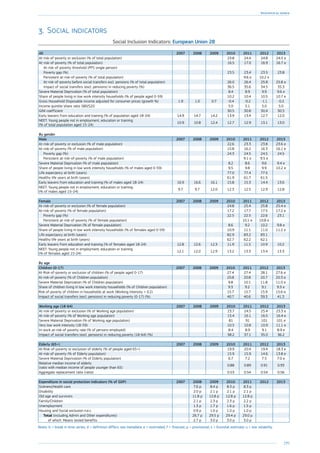
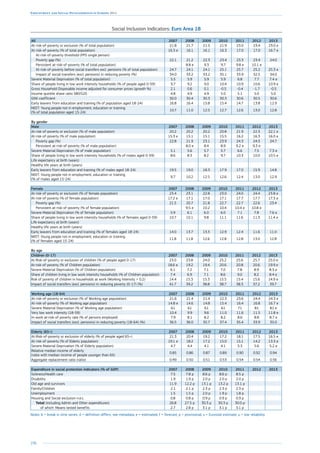
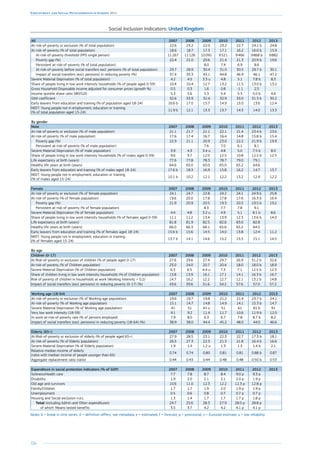
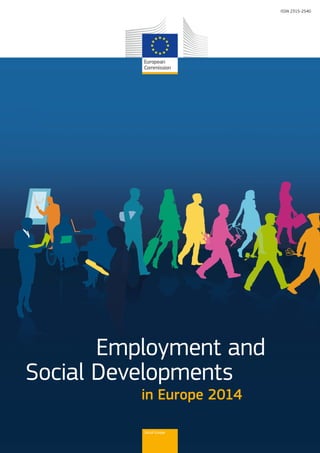
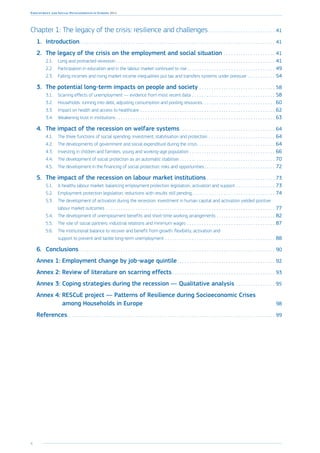
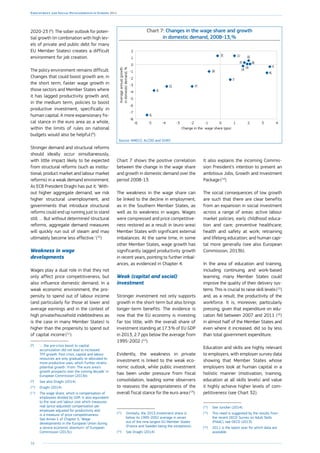
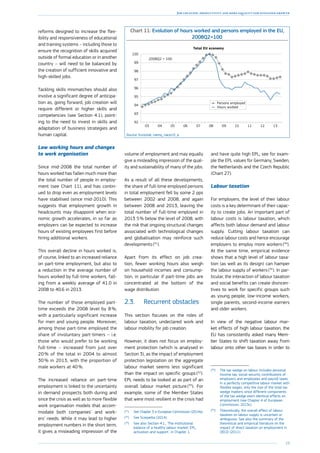
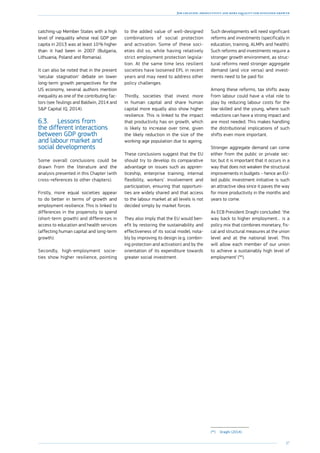
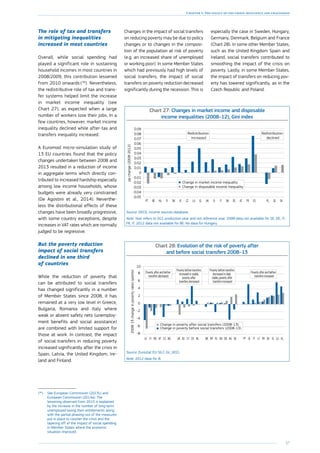
Chart 33: Real change in Gross Disposable Household Income by component in the EU
(year on year; 2005Q1 – 2014Q2)%changeonpreviousyear
-6
-4
-2
0
2
4
6
Q2Q1Q4Q3Q2Q1Q4Q3Q2Q1Q4Q3Q2Q1Q4Q3Q2Q1Q4Q3Q2Q1Q4Q3Q2Q1Q4Q3Q2Q1Q4Q3Q2Q1Q4Q3Q2Q1
2005 2006 2007 2008 2009 2010 2011 2012 2013 2014
Compensation of employees
Compensation of self-employed
Net property income
Net social benefits
Net social contributions
Net other current transfers
Taxes on income, wealth (negative)
Real GDHI
Real GDP
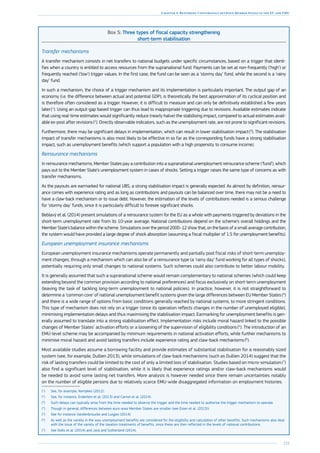
Source: Eurostat, National Accounts, data non-seasonally adjusted [namq_gdp_k, nasq_nf_tr and namq_fcs_p] (DG EMPL calculations).
Note: GDHI EU aggregate for Member States for which data are available, GDP for EU-28.
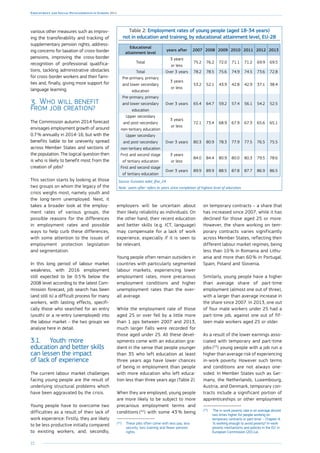
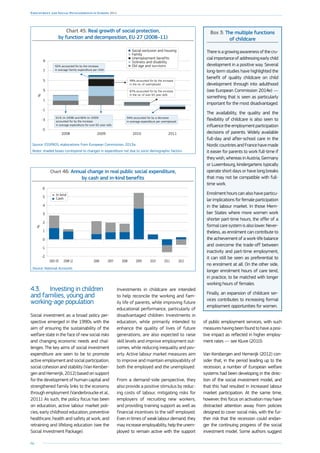
5. Who will benefit
from income growth?
5.1. Household incomes
declined in the crisis but
have started to recover
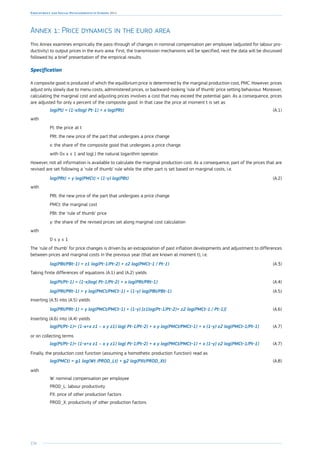
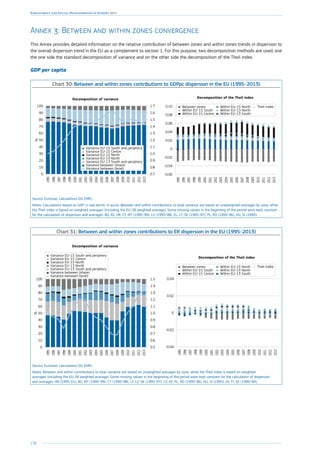
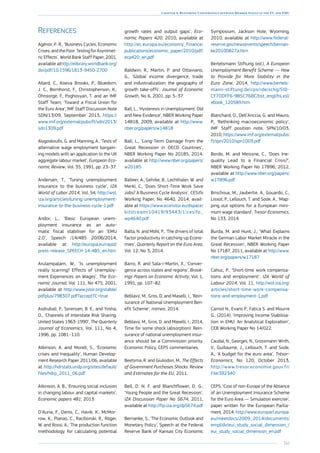
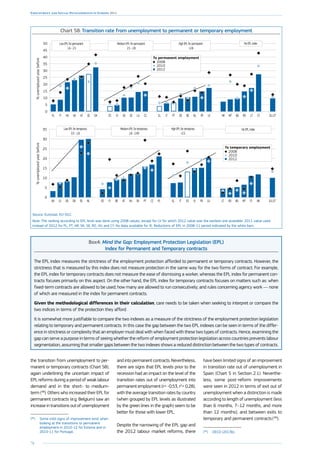
After nearly four years of continuous
declines, gross disposable household
income in the EU (80
) increased in real
terms in the last quarter of 2013, as
result of the general economic recov-
ery and the associated improvements
in labour market conditions. The overall
decline in household incomes had mainly
been driven by job losses, reduced work-
ing hours and wage compression in some
Member States.
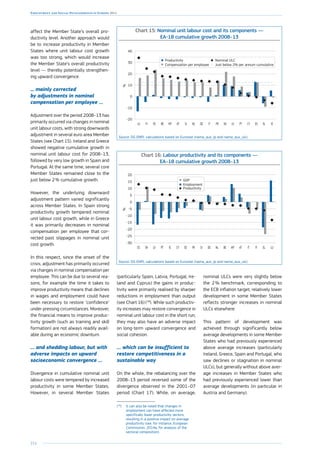
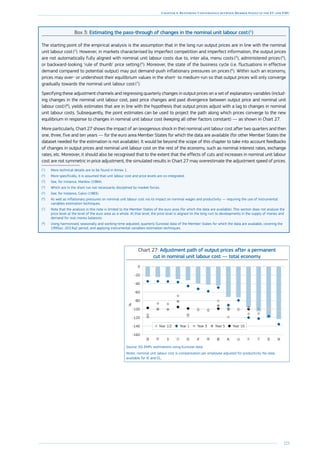
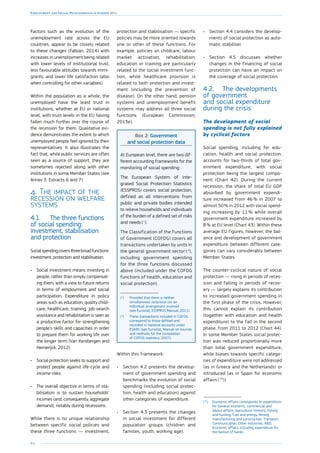
In the first years of the crisis, unemploy-
ment benefit systems played an impor-
tant role in stabilising income, while other
items of social expenditure (notably
pensions and health) also helped main-
tain aggregate demand (see Chart 33).
Since 2011, however, the stabilisation
impact of tax and benefit systems has
weakened over the prolonged recession.
This was due to various factors includ-
ing the increasing number of long-term
unemployed losing their entitlements,
the partial phasing-out of the stimulus
measures taken to counter the crisis,
and cuts in social expenditure under
(80
) Estimate based on data for
20 Member States.
pressure of budgetary consolidation.
According to a recent EUROMOD analy-
sis (81
), between 2008 and 2013 the
total impact of changes in the tax and
benefit systems on household dispos-
able income was particularly strong in
Ireland (-17 pps), Greece (-14 pps), Por-
tugal, Spain and Lithuania.
It is to be expected that the redistributive
impact of taxes and transfers increases
with unchanged policy settings when
unemployment increases significantly.
However, policy changes implemented
during the crisis also had an impact on
the income distribution. The analysis
based on EUROMOD (82
) shows that, in
many countries, the measures taken dur-
ing the crisis had either neutral or pro-
gressive impacts on income distribution,
with a few notable exceptions (Germany,
Estonia and Lithuania). It also shows that
similar types of tools can have different
distributional impacts depending on their
design, and independent of the size of
the adjustments.
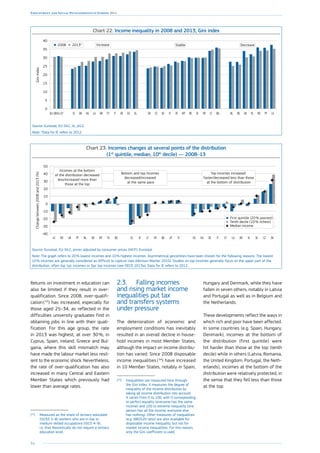
5.2. Rising poverty
mainly affects the working-
age population and children
As could be expected, poverty and social
exclusion in the EU worsened during
(81
) De Agostini P., Paulus A., Sutherland H.
and Tasseva I. (2014), ‘The effect of tax-
benefit changes on income distribution in
EU countries since the beginning of the
economic crisis’, EUROMOD Working Paper
Series EM9/14 – 02 May 2014.
(82
) De Agostini P., Paulus A., Sutherland H.
and Tasseva I. (2014), ‘The effect of tax-
benefit changes on income distribution in
EU countries since the beginning of the
economic crisis’, EUROMOD Working Paper
Series EM9/14 – 02 May 2014.
the crisis and has shown little sign of
improvement up to 2013, especially in
Member States where economic condi-
tions continue to worsen. The deterio-
ration of labour market conditions has
significantly increased the number of
people on low income or living in jobless
households, with the overall reduction in
household incomes resulting in increased
hardship among the poorest segments
of the population, resulting in a rise in
material deprivation.
The working-age population has been
most affected, mainly due to rising levels
of jobless or low work-intensity house-
holds and increased in-work poverty. In
more than 20 Member States, the risk
of poverty or social exclusion for chil-
dren has risen since 2008, along with
a worsening situation for their (mostly
working-age) parents, with single-par-
ent households facing the highest risks.
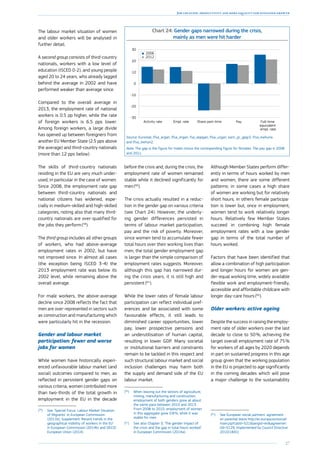
Older people (65+) have been relatively
sheltered as pensions have remained
largely unaffected, while income levels
for the working-age population have
stagnated or fallen. In most countries,
women are still more affected by old-age
poverty than men.
The likelihood of entering into and exit-
ing from poverty varies greatly across
Member States and between population
groups (83
). In some countries a significant
proportion of the population is trapped in
persistent poverty, while in others they
may exit poverty for a time but neverthe-
less return. The key risk factors include
(83
) See Chapter 2 in European Commission,
2013c, Chapters 3 and 4 in
European Commission, 2011a.](https://image.slidesharecdn.com/fd1af655-5d67-4954-a059-19619f458af7-150123121918-conversion-gate01/85/KE-BD-14-001-EN-N-34-320.jpg)

![42
Employment and Social Developments in Europe 2014
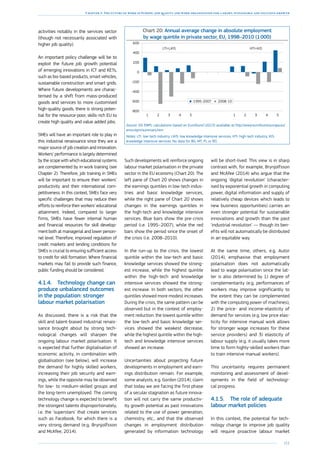
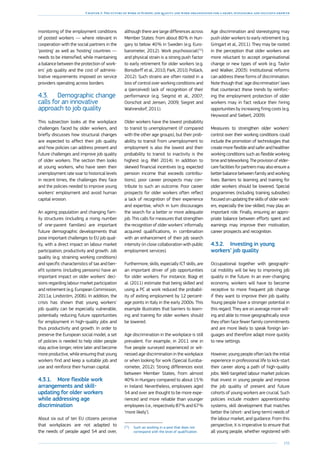
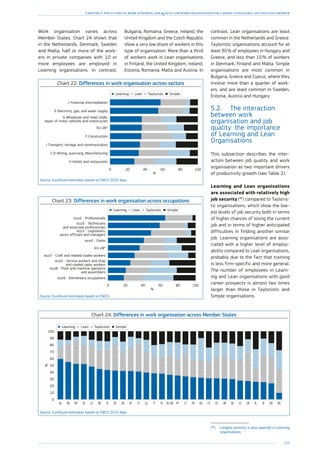
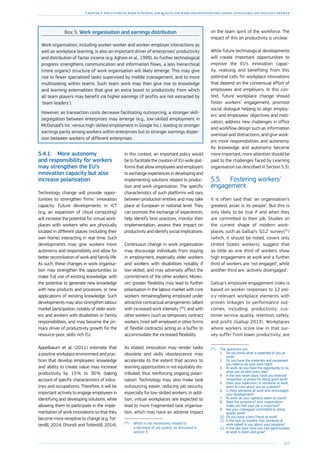
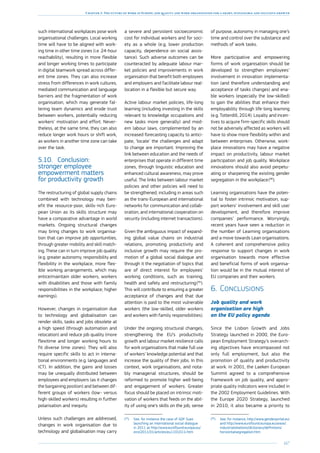
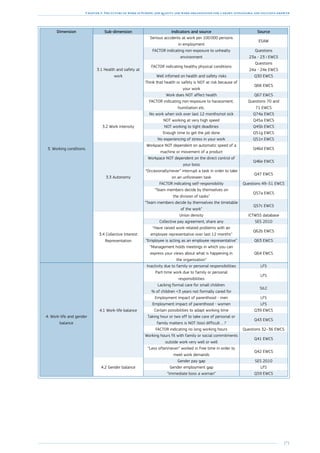
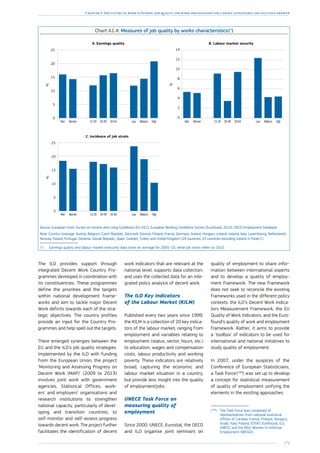
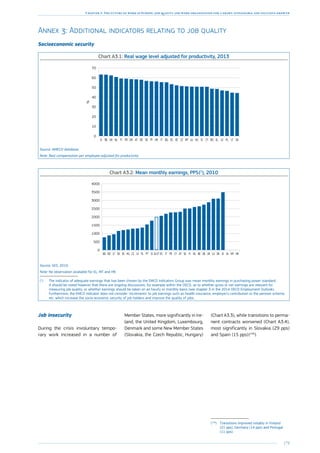
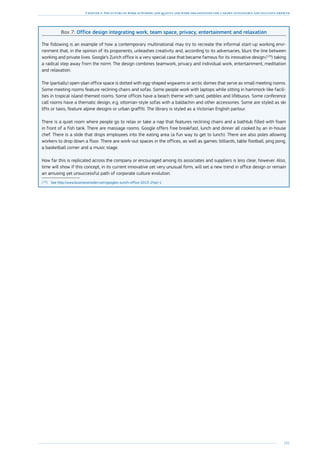
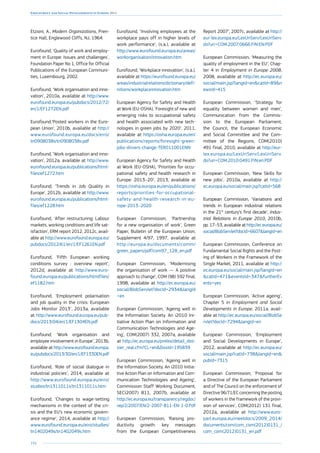
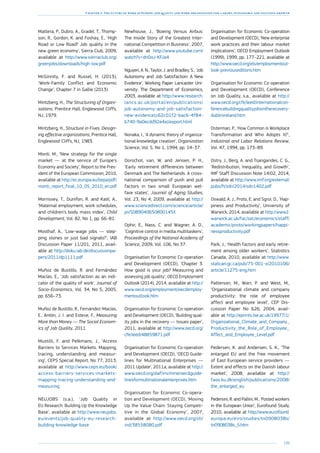
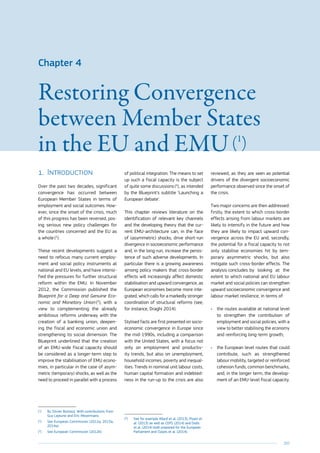
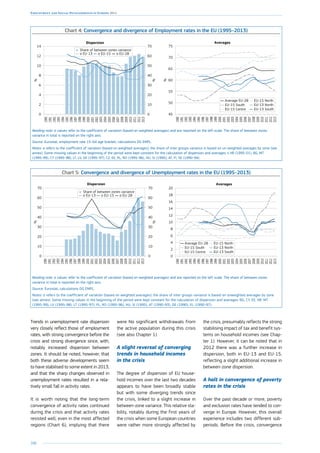
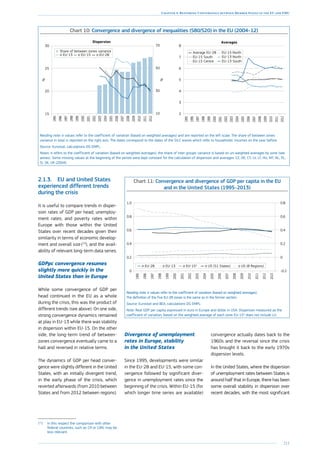
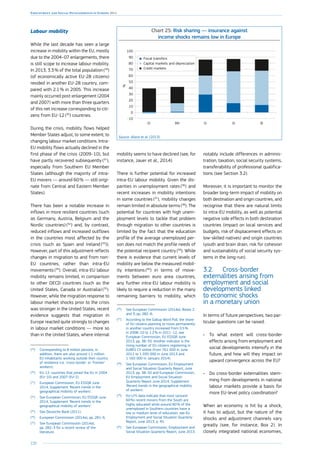
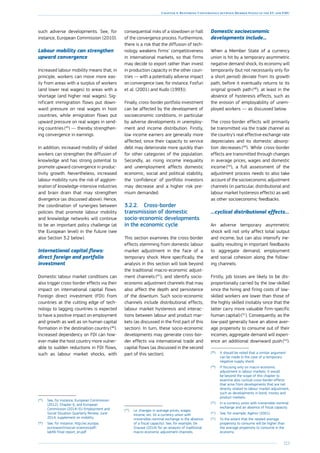
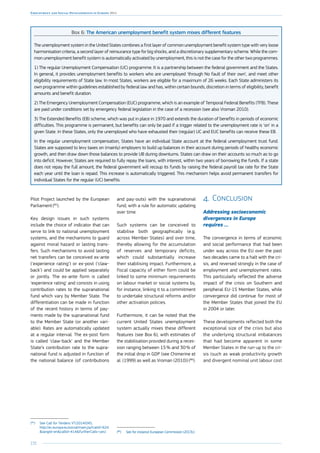
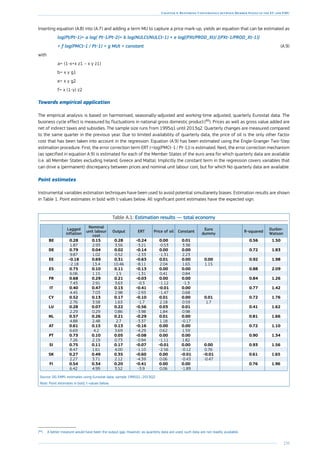
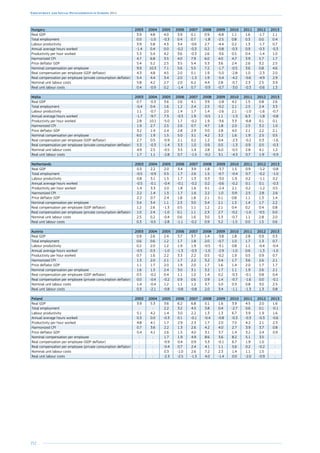
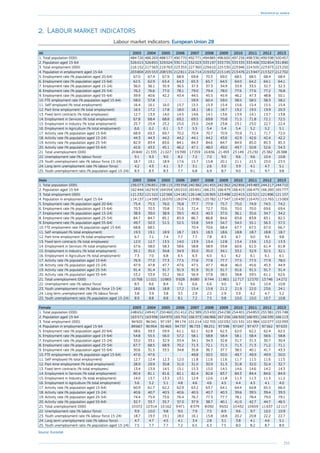
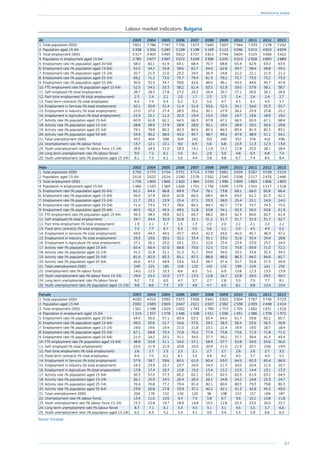
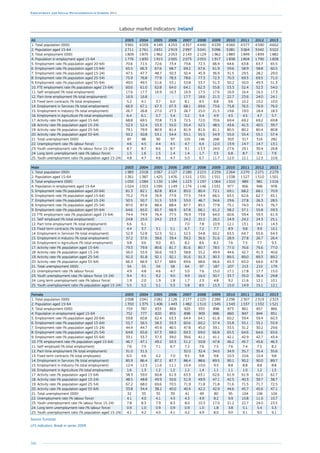
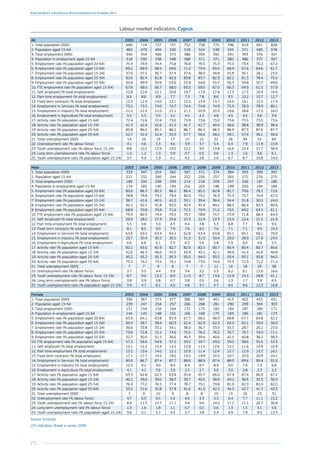
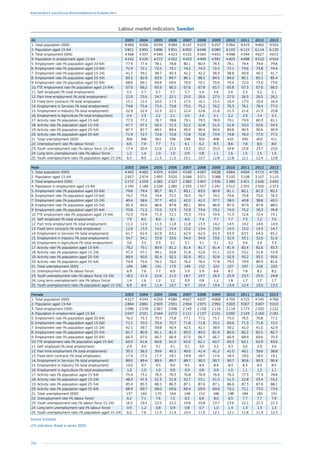
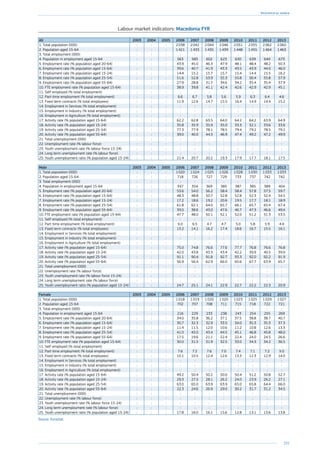
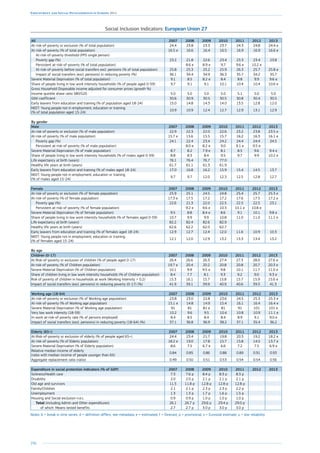
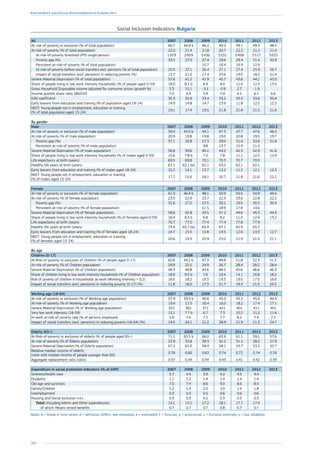
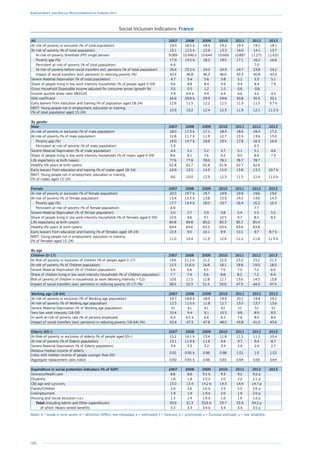
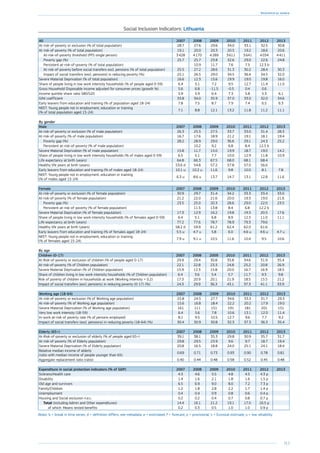
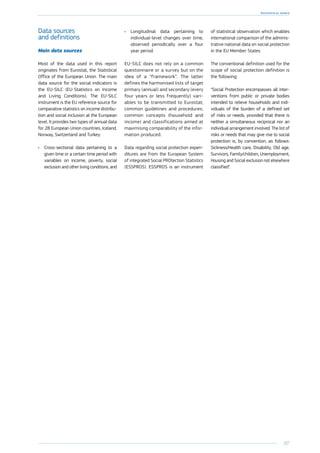
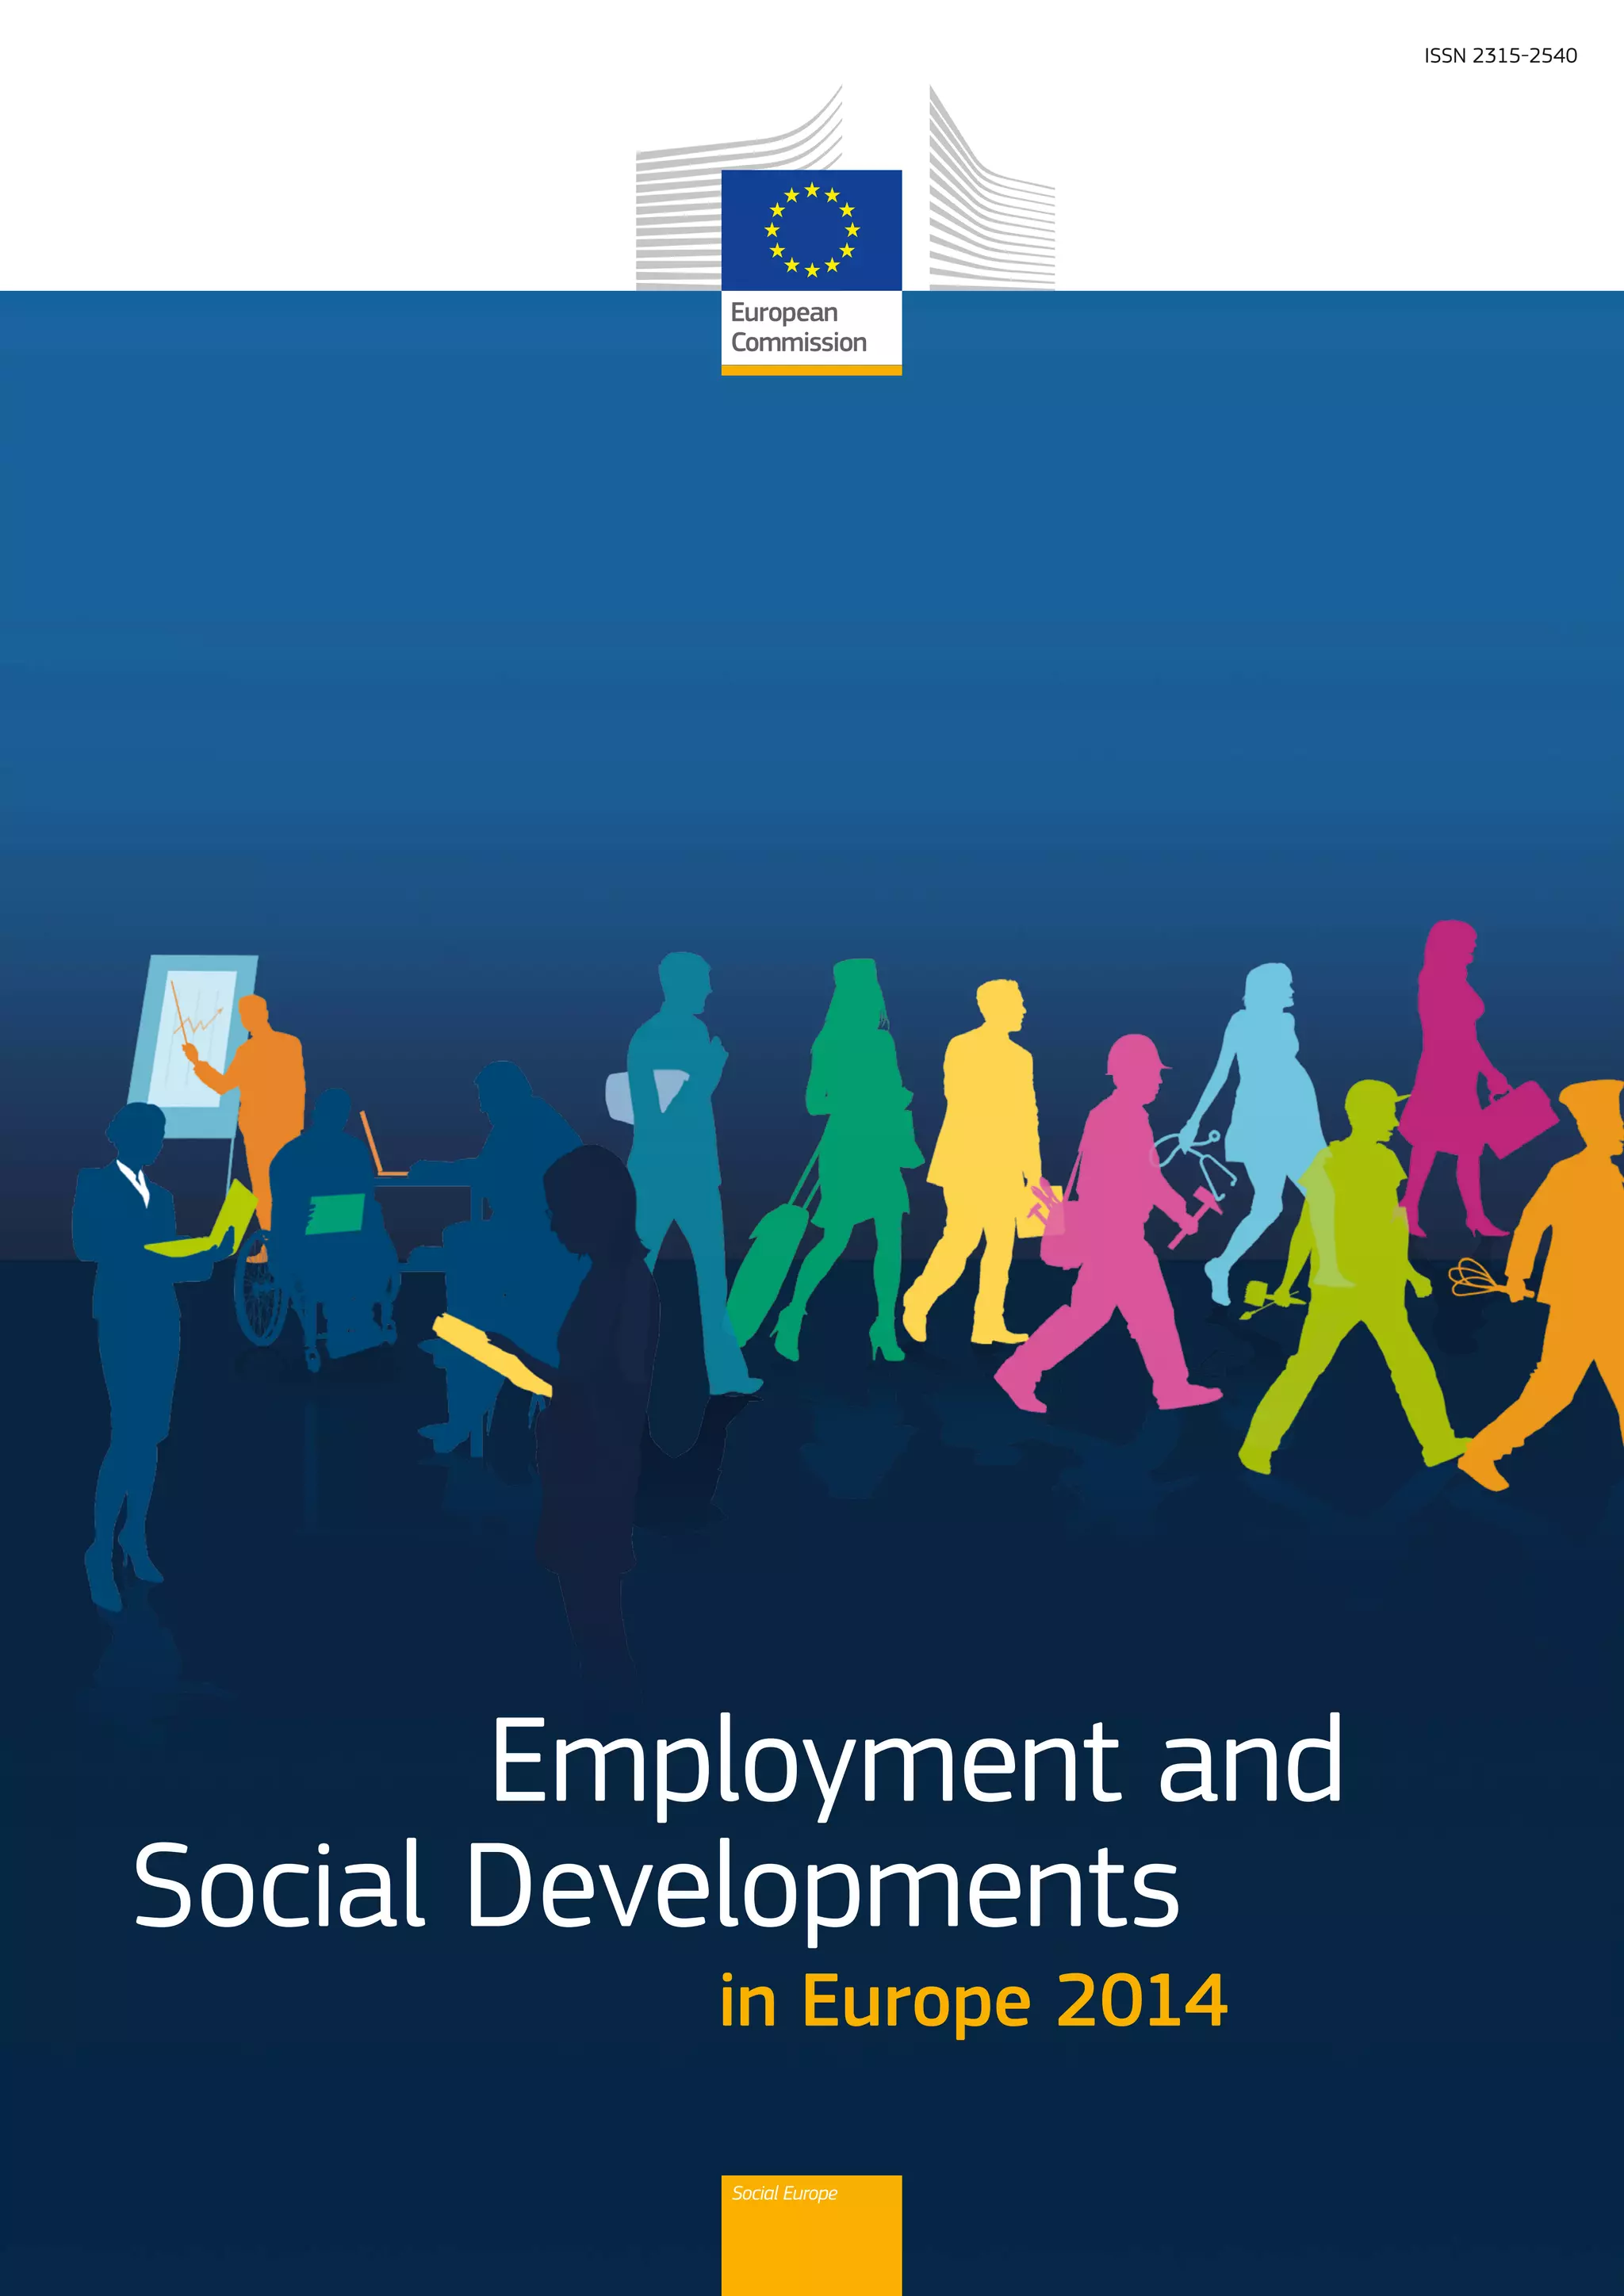
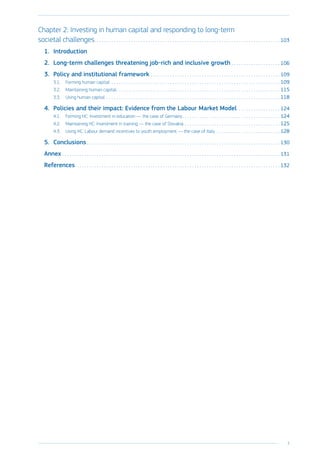
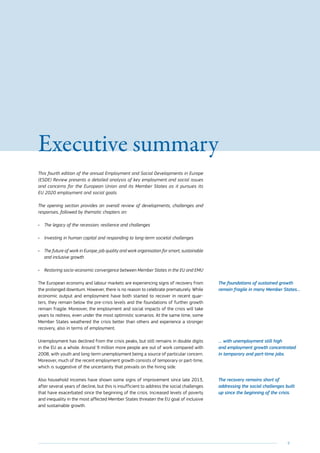
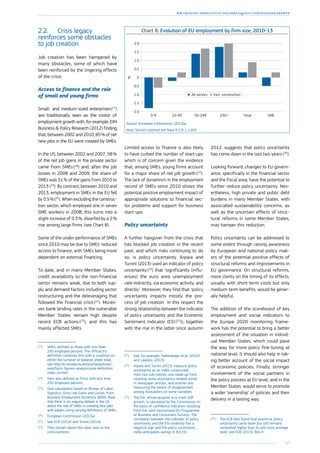
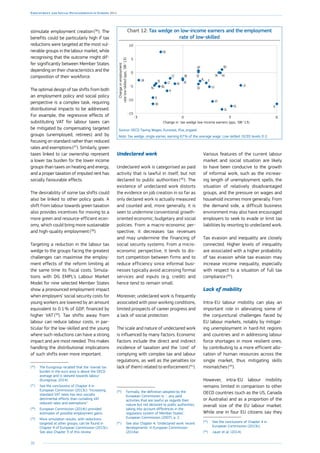
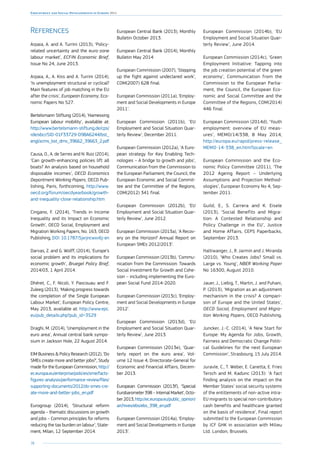
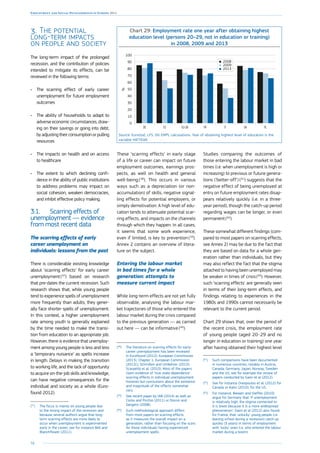
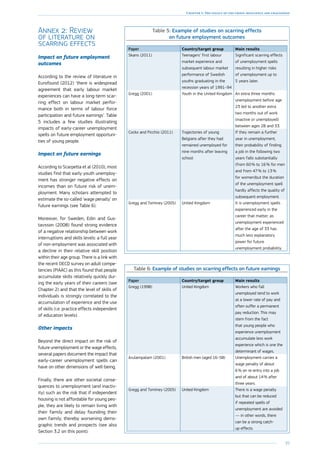
Chart 1: Real GDP in the EU, euro area and United States (left),
and percentage changes over the previous quarter (right)
80
85
90
95
100
105
110
Q1Q4Q3Q2Q1Q4Q3Q2Q1Q4Q3Q2Q1Q4Q3Q2Q1Q4Q3Q2Q1Q4Q3Q2Q1Q4Q3Q2Q1
-4
-3
-2
-1
0
1
2
3
4
5
6
EU-28 EU-28
USUS
Index 2007=100
2007 2008 2009 2010 2011 2012 2013 2014
Source: Eurostat, National Accounts, data seasonally adjusted [namq_gdp_k].
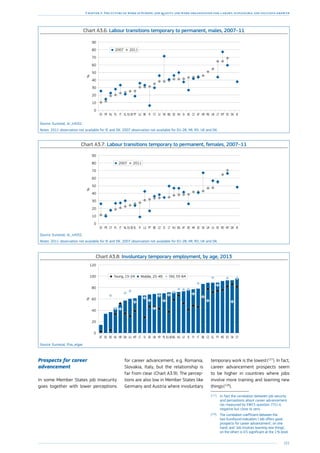
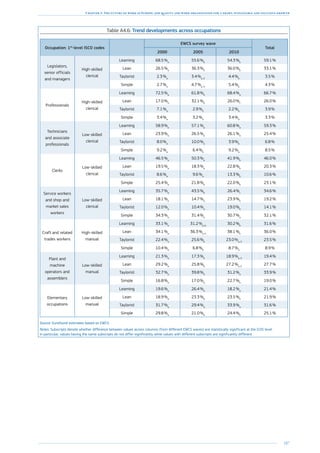
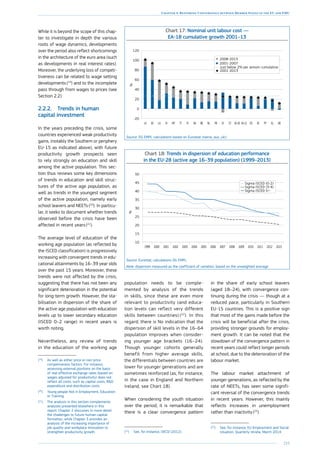
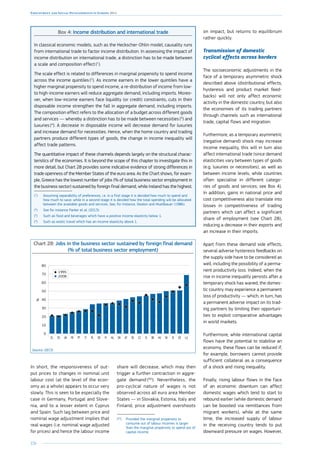
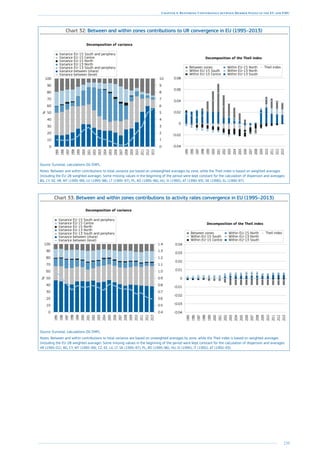
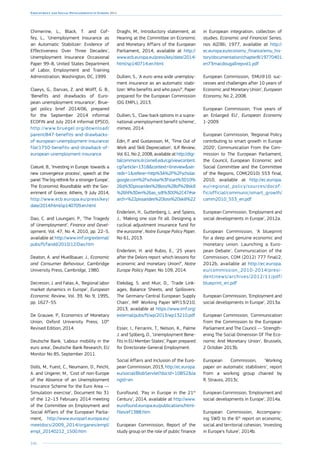
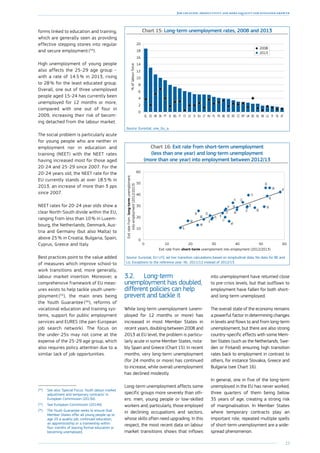
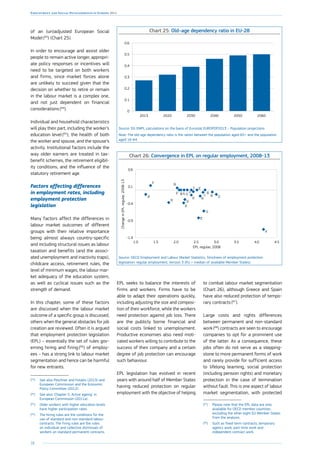
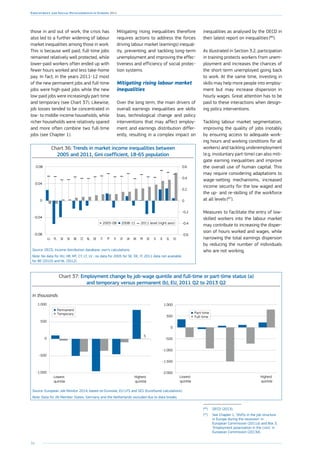
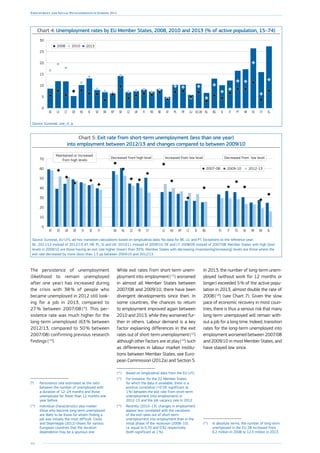
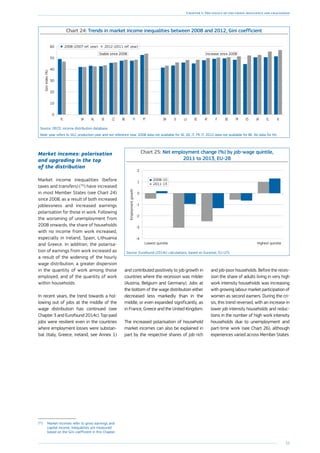
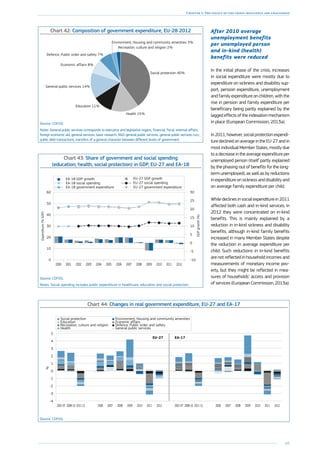
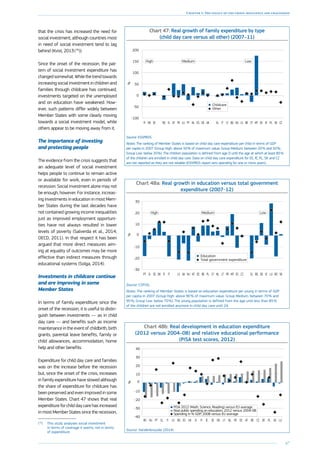
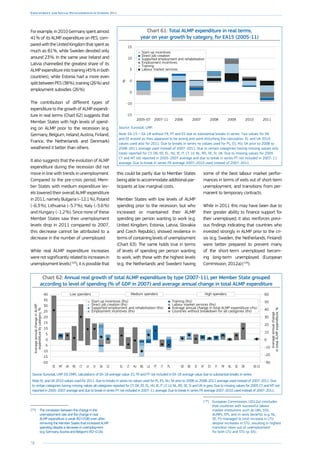
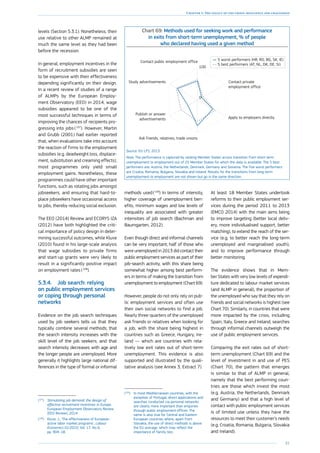
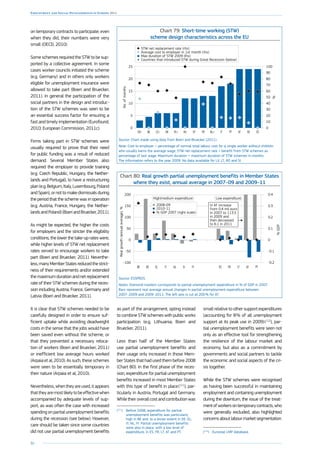
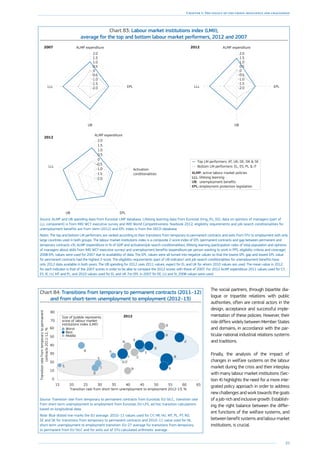
In the first phase of the crisis (2008–10)
the fall in employment in most EU Mem-
ber States was significantly less than the
decline in economic activity especially
when compared with the United States ( 4
).
However the decline in economic activity
had a much greater impact on employ-
ment in some Member States ( 5
) see
Chart 2. Some of this can be explained
by structural factors. In Spain, for
example, the disproportionate impact
on employment (almost twice as large
as the economic shock) ( 6
), reflected the
relative importance of the construction
sector and the country’s highly seg-
mented labour market ( 7
). In contrast,
the strong decline in GDP in Germany
was absorbed through a reduction of
working time (as well as productivity)
rather than a reduction of employment,
notably due to the widespread use of
short-time working arrangements (as
also used in Austria and Belgium) ( 8
).
Finally, it should also be noted that the
more or less large transmission in terms
of employment and income impacted
later on GDP through the channel of
aggregate demand.
Variations in the stabilising impact of
national welfare systems also explain
some of the differences in the impacts
of job losses and reduced working
time on household disposable income
across different countries (GDHI, see
Chart 3). For instance, in Italy, the
decline in employment resulted quickly
in a disproportionate drop in house-
hold incomes while the sharp decline
in employment in 2009 in Spain and
Ireland did not result in any immediate
(4
) European Commission (2010a), Employment
in Europe.
(5
) By contrast, in Germany the manufacturing
sector was badly hit by plummeting
exports but high productivity levels led to
a comparatively small fall in employment
relative to that in GDP.
(6
) i.e. employment volume declining by almost
7 % in the year to 2009 Q3, compared to a
decline of the GDP by around 4 %.
(7
) In Poland the high share of temporary
workers also explains the decline in
employment that occurred despite a rather
favourable change in terms of GDP (decline
in growth but no recession).
(8
) The cost of adjustment was spread
across the workforce instead of, in case
of extensive reliance on layoffs, being
concentrated on a relatively small number
of workers suffering large losses of income
(Cahuc and Carcillo (2011)).
fall in income due to the effects of a
fiscal stimulus and automatic stabilis-
ers (though income levels did drop later
as benefit payments ran out). In the
United Kingdom, the moderate impact
on employment was nevertheless fol-
lowed by a drop in household incomes,
while in Sweden and France the declines
in employment levels did not translate
into reduced income levels.
Chart 2: Change in GDP and employment
between 2008 and 2013, EU Member States, in %
-30
-25
-20
-15
-10
-5
0
5
10
15
20
PLSEMTSKDEATBELUEEFRUKEU-28ROLTBGCZDKNLHUFIIELVESPTITCYSIHREL
Employment
GDP
Source: Eurostat, nama_gdp_k and nama_aux_pem.](https://image.slidesharecdn.com/fd1af655-5d67-4954-a059-19619f458af7-150123121918-conversion-gate01/85/KE-BD-14-001-EN-N-44-320.jpg)
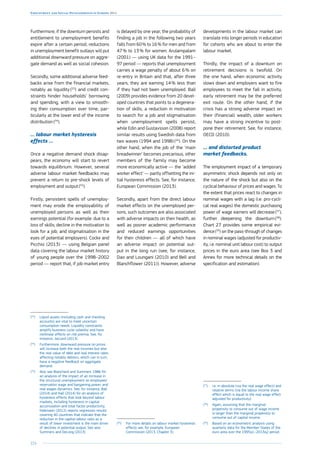
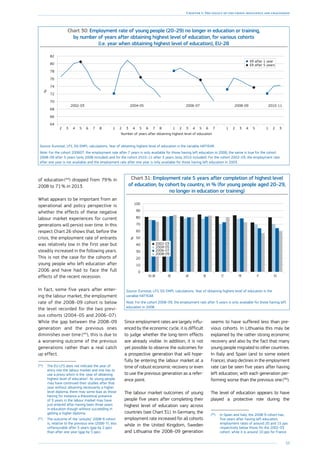
![43
Chapter 1: The legacy of the crisis: resilience and challenges
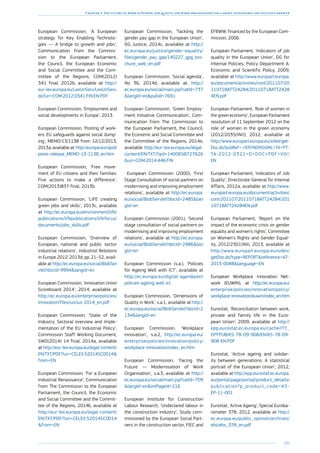
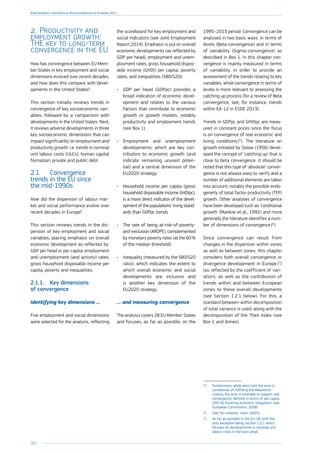
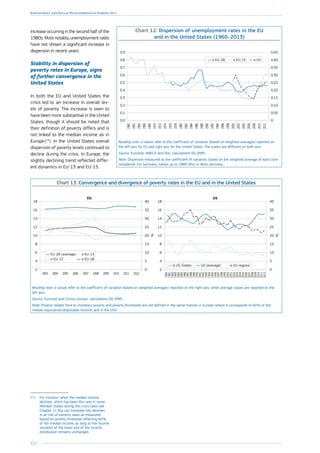
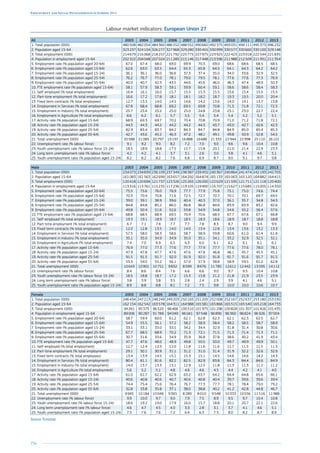
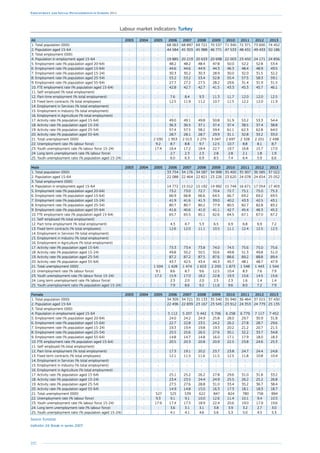
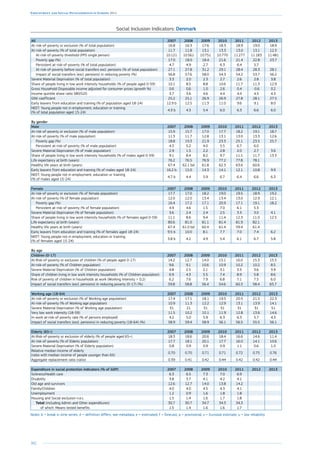
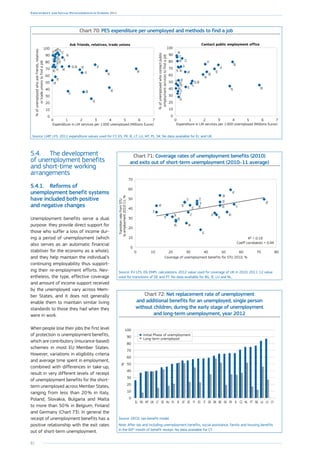
Chart 3: Real GDP growth, real Gross Disposable Household Income (GDHI) growth
and employment growth (No of persons employed), year-on-year change
-8
-6
-4
-2
0
2
4
6
8
10
Q1Q4Q3Q2Q1Q4Q3Q2Q1Q4Q3Q2Q1Q4Q3Q2Q1Q4Q3Q2Q1Q4Q3Q2Q1Q4Q3Q2Q1
EU-28
2007 2008 2009 2010 2011 2012 2013 2014
%changeonpreviousyear
GDHI
GDP
Employment
-8
-6
-4
-2
0
2
4
6
8
10
Q1Q4Q3Q2Q1Q4Q3Q2Q1Q4Q3Q2Q1Q4Q3Q2Q1Q4Q3Q2Q1Q4Q3Q2Q1Q4Q3Q2Q1
EA-17
2007 2008 2009 2010 2011 2012 2013 2014
%changeonpreviousyear
GDHI
GDP
Employment
-8
-6
-4
-2
0
2
4
6
8
10
Q1Q4Q3Q2Q1Q4Q3Q2Q1Q4Q3Q2Q1Q4Q3Q2Q1Q4Q3Q2Q1Q4Q3Q2Q1Q4Q3Q2Q1
DE
2007 2008 2009 2010 2011 2012 2013 2014
%changeonpreviousyear
GDHI
GDP
Employment
-8
-6
-4
-2
0
2
4
6
8
10
Q1Q4Q3Q2Q1Q4Q3Q2Q1Q4Q3Q2Q1Q4Q3Q2Q1Q4Q3Q2Q1Q4Q3Q2Q1Q4Q3Q2Q1
ES
2007 2008 2009 2010 2011 2012 2013 2014
%changeonpreviousyear
GDHI
GDP
Employment
-8
-6
-4
-2
0
2
4
6
8
10
Q1Q4Q3Q2Q1Q4Q3Q2Q1Q4Q3Q2Q1Q4Q3Q2Q1Q4Q3Q2Q1Q4Q3Q2Q1Q4Q3Q2Q1
FR
2007 2008 2009 2010 2011 2012 2013 2014
%changeonpreviousyear
GDHI
GDP
Employment
-8
-6
-4
-2
0
2
4
6
8
10
Q1Q4Q3Q2Q1Q4Q3Q2Q1Q4Q3Q2Q1Q4Q3Q2Q1Q4Q3Q2Q1Q4Q3Q2Q1Q4Q3Q2Q1
GDHI
GDP
Employment
IT
2007 2008 2009 2010 2011 2012 2013 2014
%changeonpreviousyear
Source: Eurostat, National Accounts [namq_gdp_k, namq_aux_pem, nasq_nf_tr and namq_fcs_p] (DG EMPL calculations).
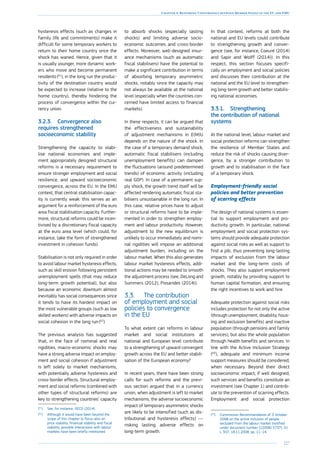
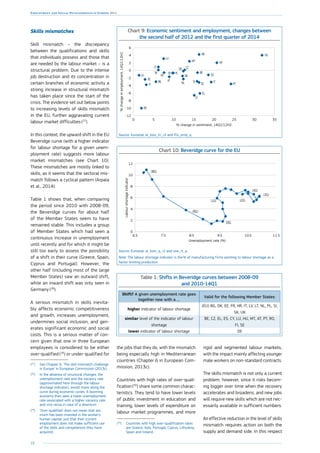
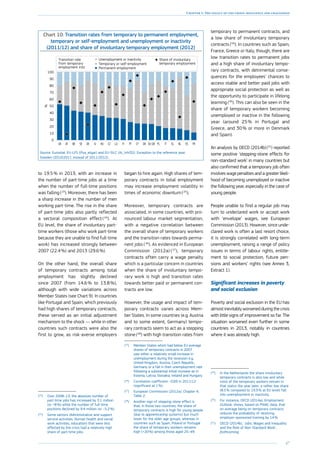
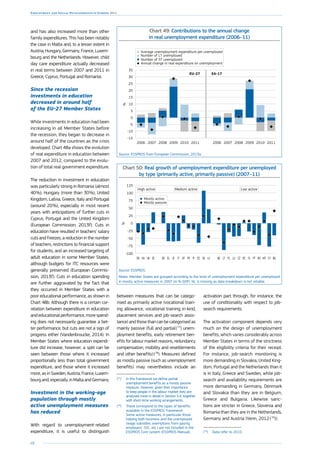
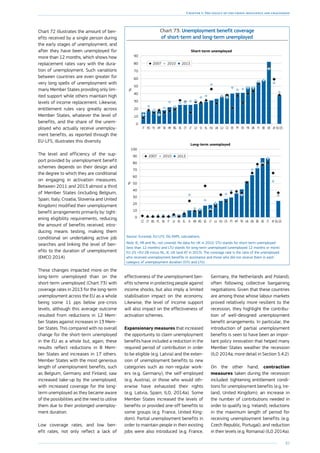
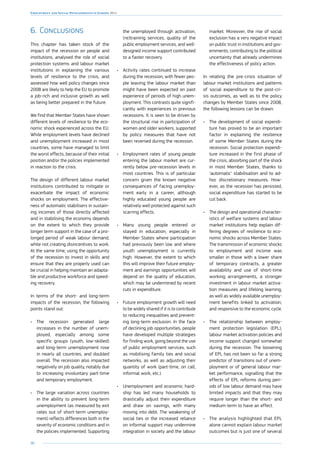
A strong and uneven impact
on unemployment
For the EU as a whole, the unemploy-
ment rate rose from 7.0 % in 2008
to 9.6 % in 2010, reaching 10.8 %
in 2013. Chart 4 shows that, in two-
thirds of EU countries, unemployment
increased mainly in the period up
to 2010 but that in those countries
that experienced a double recession,
unemployment rose substantially after
2011. The impact was strongest (in
terms of percentage points) for the
young, the low-skilled and non-EU
foreign workers — groups that already
faced higher risks of joblessness
before the recession.](https://image.slidesharecdn.com/fd1af655-5d67-4954-a059-19619f458af7-150123121918-conversion-gate01/85/KE-BD-14-001-EN-N-45-320.jpg)
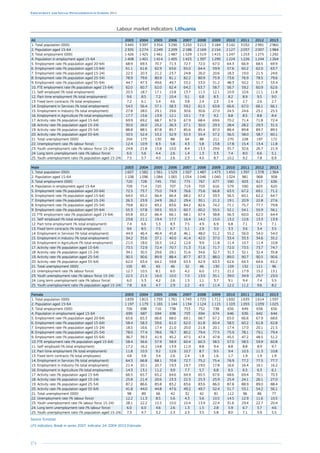
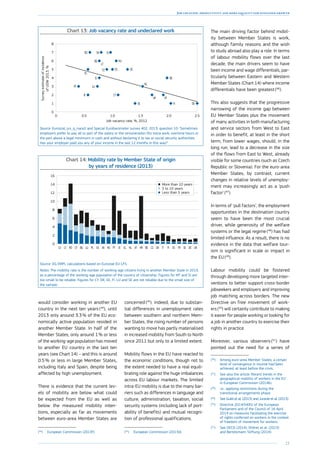
![45
Chapter 1: The legacy of the crisis: resilience and challenges
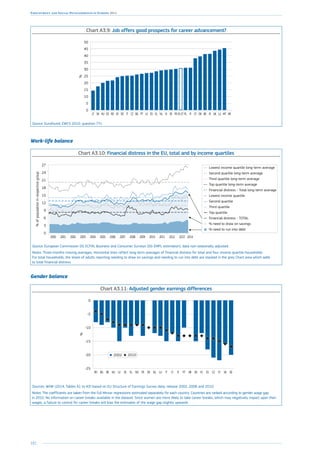
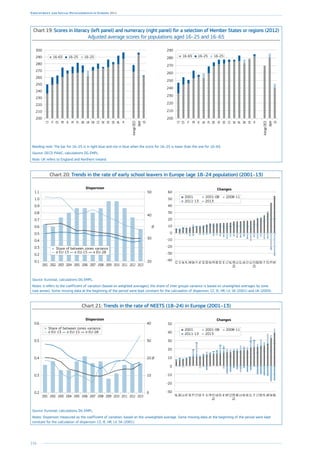
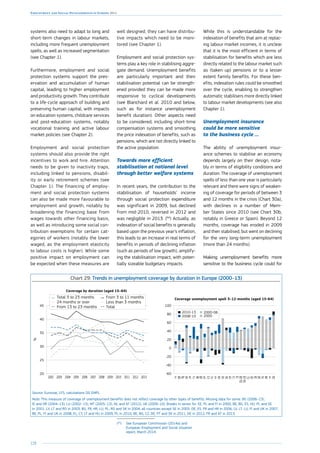
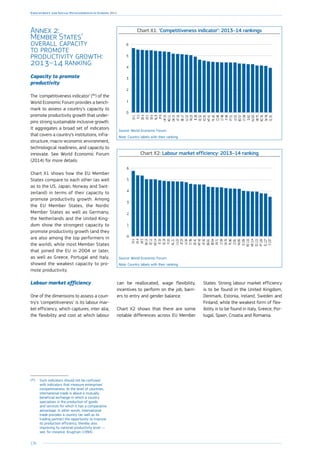
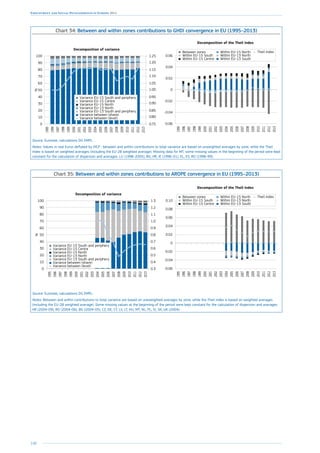
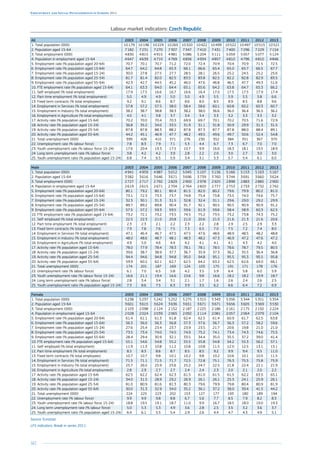
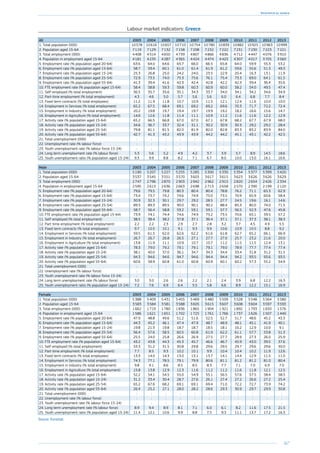
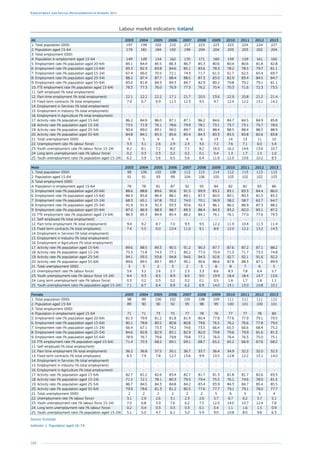
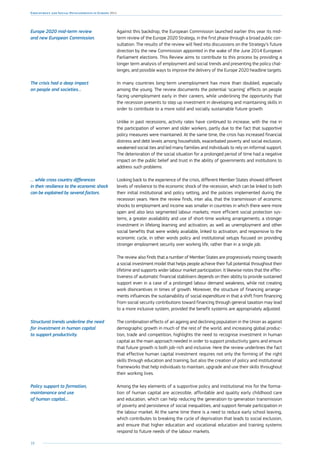
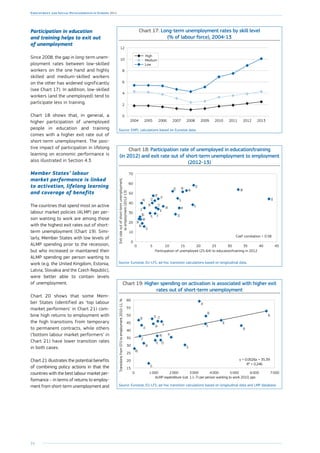
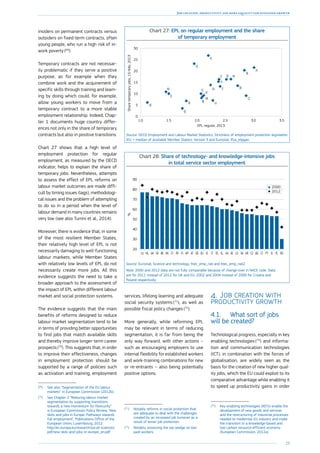
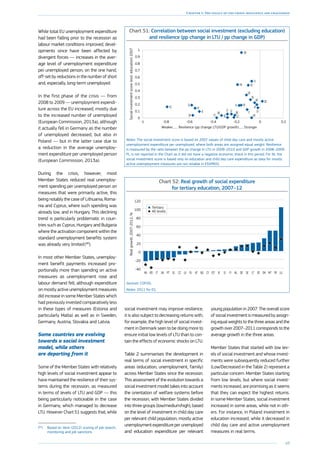
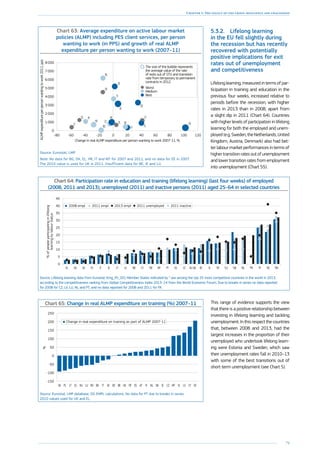
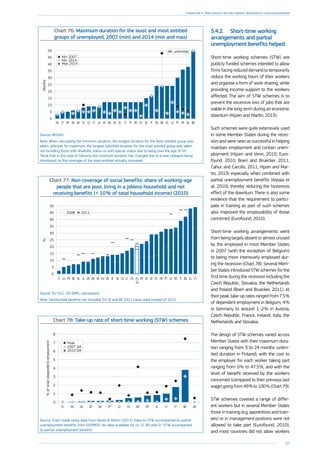
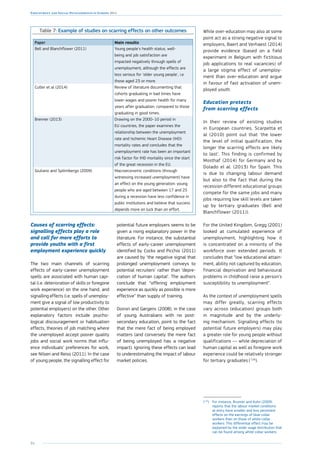
While most countries with high exit rates
from short-term unemployment also
have high exit rates for the long-term
unemployed, a few countries (such as
Germany and the United Kingdom) that
manage to ensure rapid rates returns to
employment for the short-term unem-
ployed, have nevertheless relatively
low exit rates for the long-term unem-
ployed ( 15
), see Chart 6. In these countries,
a limited proportion of the unemployed
become long-term unemployed but when
they do, they have difficulties returning
to employment.
(15
) The gap between the exit rates for short
versus long-term unemployed is much
higher in the UK and Germany (respectively
22 and 19 pps) than the EU average
(11 pps, with rates of 38 % and 27 %). On
the contrary Denmark and Estonia manage
to maintain high exit rates into employment
also for the long-term unemployed and have
relative low gaps between the two rates
(respectively 8 and 6 pps).
Chart 6: Exit rate from short-term unemployment
(less than one year) and long-term unemployment
(more than 1 year) into employment between 2012/13Exitratefromlong-termunemployment
intoemployment(2012/2013)
Exit rate from short-term unemployment into employment (2012/2013)
0 10 20 30 40 50 60
0
10
20
30
40
50
60
UK
MT
DE
AT
SE
LT
LV
NL
HU
FR
IT
IE
HR
PL
CZ
PT
DK
CY
BG
ES
EE
FI
SI
EL
RO
SK
Source: Eurostat, EU-LFS, ad-hoc transition calculations based on longitudinal data. No data for BE
and LU. Exceptions to the reference year: NL: 2011/12 instead of 2012/13.
Exit rates out of long-term unemployment
seem less sensitive to changes in the eco-
nomic cycle ( 16
) than they are for the short-
term unemployed, which suggests that an
economic recovery may not bring back into
employment many of those who are cur-
rently long-term unemployed. This is likely
to have lasting negative consequences, such
as the depreciation of human capital, nega-
tive signalling effects for potential employ-
ers and demotivation for those concerned,
with further risks in terms of benefits
dependency, poverty and social exclusion.
It should also be noted that 20 % of the
long-term unemployed in 2013 have never
worked before and are likely to need vari-
ous forms of support in order to find a first
job. This raises concerns regarding access
to benefits and the risk of social and eco-
nomic marginalisation.
(16
) For instance, the coefficient of correlation with
changes in employment over 2008–10 is much
stronger for the exit rates out of short-term
unemployment into employment (0.92, significant
at 1 %) than with the exit rates out of long-term
unemployment (0.53, significant at 5 %).
Chart 7: Long-term unemployment in % of active population for EU Member States (2002–2008–2013)
0
2
4
6
8
10
12
14
16
18
20
ELESHRSKPTIEBGITCYLVSIEU-28LTHUPLFRBEEEROCZMTUKNLDELUDKFISEAT
20132002 2008
Source: Eurostat, EU-LFS [une_ltu_a].
Young people tend to experience shorter
spells of unemployment and higher transi-
tion rates into employment than other age
groups, but this is less true now than it was
in the past ( 17
), with an increase in the share
of long-term unemployed among the young
unemployed, especially for the age group
25–34 ( 18
). Significantly, however, having
a tertiary degree appears to be a form of
protection against long-term unemploy-
ment, albeit probably at the expense of
less qualified young people competing for
the same jobs.
(17
) According to longitudinal data of the EU-LFS
(European Commission (2012a), Chapter 1),
even if young people continued to have
better exit rates out of unemployment than
older workers, their situation worsened since
2008. In 2010-11, they had a much higher
chance of losing their job (8 %) compared
to prime-age (3 %) and older (2 %) workers.
In addition their transition rate back into
employment had sharply diminished, from
40 to 30 %. These findings are confirmed by
analysis of RWI (2014) drawing on micro-
data from the EU-SILC.
(18
) Strictly speaking the group of young people
is defined as those aged 15–24; however for
many indicators analysis of the age group
25–34 is also meaningful as this age group
has also been strongly affected by the crisis.](https://image.slidesharecdn.com/fd1af655-5d67-4954-a059-19619f458af7-150123121918-conversion-gate01/85/KE-BD-14-001-EN-N-47-320.jpg)
![46
Employment and Social Developments in Europe 2014
Chart 8: Youth unemployment in % of active population (aged 15–24)
0
10
20
30
40
50
60
70
ELESHRITCYPTSKBGPLHUIEFRBEROSEEU-28LVLTSIUKFICZEELUMTDKNLATDE
20132008
Source: Eurostat, EU-LFS [lfsa_urgan].
Chart 9: Temporary employment as percentage of the total number of employees
20132007
0
5
10
15
20
25
30
35
ESPLPTSINLSEFIFRDEEU-28CYITHRELDKATBECZIEHULUUKBGSKMTLVLTEERO
Source: Eurostat, EU-LFS [lfsa_etpgan].
Levels of unemployment among youth
tend to vary more than total unemploy-
ment because their job prospects are
more sensitive to the business cycle ( 19
)
and because of the variety of policies
and institutions supporting school to
work transitions (education and train-
ing systems, contractual arrangements,
minimum wage, etc.) ( 20
). In this respect,
the apprenticeship systems in Germany
and Austria are commonly highlighted
as being mechanisms that overcome
many of the obstacles and, in particu-
lar, ensure high transition rates from
(19
) According to IMF (2014), the business cycle
‘explains up to 70 % of changes in the youth
(15–24) unemployment rates in stressed
euro area countries’. It estimates that
an additional percentage point of annual
growth could lower the unemployment rate
from 0.8 pp in Greece and Portugal
to 1.9 pps in Spain.
(20
) Another factor explaining the wide variation
of the youth unemployment rate across
Member States is the very diverse level of
participation of young people in the labour
market while still being in education.
temporary to permanent contracts
(Eichhorst et al, 2012).
In 2013 the proportion of young people
aged 15–24 in the EU who were nei-
ther in employment, education or train-
ing (commonly called NEETs) was 13 %
in 2013 (compared to 10.8 % in 2008),
and exceeding 20 % in Greece, Bulgaria
and Italy ( 21
). In most countries, how-
ever, the increase in the NEET rate since
2008 has been mainly the result of an
increase in unemployment, rather than
inactivity ( 22
), which implies that most
(21
) In Bulgaria, Romania and Italy the majority
of young NEET were inactive, in Greece,
Spain or Croatia most of them (around 70 %)
were unemployed (i.e. looking for a job).
(22
) At EU level, the share of unemployed in the
whole age class 15–24 has risen by 2.6 pps
(from 6.6 % to 9.2 %) while the number of
inactive (not in education or training) only
slightly changed (by 0.3 pp, from 7.4 to
7.7 %).
‘newly’ NEET young people are actually
looking for work.
Changes affecting
those in work: non-
standard employment,
job quality and informality
Since the recession, not only has the
quantity of jobs been affected but also
their quality as reflected by various indi-
cators (see also Chapter 3). In this regard
the share of part-time jobs in overall
employment rose from 17.5 % in 2008](https://image.slidesharecdn.com/fd1af655-5d67-4954-a059-19619f458af7-150123121918-conversion-gate01/85/KE-BD-14-001-EN-N-48-320.jpg)
![49
Chapter 1: The legacy of the crisis: resilience and challenges
strongly in those Member States most
affected by the crisis (Spain, Italy, Ire-
land, Malta, United Kingdom). In some
Eastern/Southern countries where dep-
rivation had been improving before the
crisis, the trend reversed and material
deprivation increased dramatically after
the crisis (Lithuania, Latvia, Estonia,
Cyprus, Greece, Hungary and to a lesser
extent Bulgaria).
Working age adults have been especially
affected, reflecting the deterioration of
labour market conditions, with the worst
hit countries being Spain, Italy, Greece,
the Baltic States, but also the United
Kingdom ( 33
). Moreover, since many such
working age adults live in households
with children, child poverty has also risen
across Europe as a whole. In contrast, the
risk-of-poverty indicator for older people
showed a significant decline in most
Member States between 2008 and 2013
reflecting the fact that pensions have, to
a large extent, remain unchanged during
the crisis.
(33
) See European Commission (2014a).
Chart 13: Activity rate across EU Member States,
2003, 2008 and 2013, in % of population aged 15–64
55
60
65
70
75
80
85
SENLDKDEUKATFIEEESLVCYPTCZLTEU-28FRSILUSKIEBGELBEPLHUMTROITHR
20132003 2008
Source: Eurostat, EU-LFS [lfsi_act_a].
Chart 14: Activity rate (15–64) compared to 1990 and 2007 levels, for selected countries, in pps
-7
-6
-5
-4
-3
-2
-1
0
1
2
19981997199619951994199319921991
France US Italy
FinlandUKSweden
-4
-3
-2
-1
0
1
2
3
201320122011201020092008
Spain Germany Sweden
FinlandUK IrelandUS
Source: OECD. Source: Eurostat, EU-LFS and OECD data for the US.
Due to the combination of life expectancy,
lower participation in the labour market
and household composition (single parent
families), women are at higher risk of
poverty or social exclusion than men in
all Member States, with the exception of
Spain and Portugal.
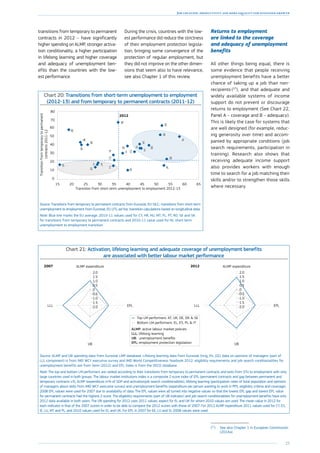
2.2. Participation
in education and in the labour
market continued to rise
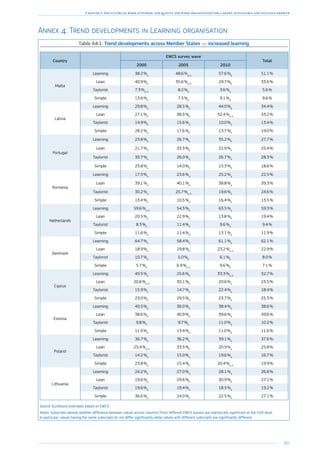
Economic participation, as measured by
the activity rate indicator ( 34
), has con-
tinued to increase since 2008 in most
Member States, in contrast to the experi-
ence in past recessions. While the employ-
ment rate declined from 65.7 % in 2008
to 64.1 % in 2013 for the EU as a whole, the
activity rate increased from 70.7 % in 2008
to 71.9 % in 2013. It implies that the drop
in the number of jobs mainly translated
into a rising number of unemployed and,
only to a limited extent, a rising number of
‘discouraged workers’ (see Section below).
This EU experience also contrasts with the
decline in activity rate witnessed in the
United States since 2008 ( 35
).
Reductions in activity rates in previous
crises are attributed to a higher share
of working-age persons withdrawing
(34
) The activity rate measures the share, among
the working-age population, of those being
economically active, i.e. either in employment
or unemployed, according to the ILO
definitions. While this indicator counts the
total number of people in employment and
unemployment and country-comparisons may
be influenced by differences in institutional
factors (such as incentives to be registered
as unemployed), the analysis of changes of
activity rate over time remains meaningful,
in particular to analyse behavioural changes
compared to previous recessions.
(35
) Note that for the US, several papers (e.g. Barnes
et al (2013)) show that the decline in
participation since 2008 reflects, to a great
extent, long-term demographic and behavioural
changes rather than cyclical developments.](https://image.slidesharecdn.com/fd1af655-5d67-4954-a059-19619f458af7-150123121918-conversion-gate01/85/KE-BD-14-001-EN-N-51-320.jpg)
![50
Employment and Social Developments in Europe 2014
from the labour market, resulting in their
decline between 1990 and 1994 and a
very slow return to previous levels, sub-
stantially so for Sweden and Finland,
while increasing slightly in France (and the
United States), see Chart 14. By contrast,
since 2007, activity rates have continued
to increase in many EU countries, even
those strongly affected by the recession.
Increase in activity continued
to be driven by women and older
workers
The increase in the activity rate since
2008 has mainly been driven by the
rising participation of women and older
workers throughout the recession see
Chart 15. This is seen to be due to a
number of factors: structural increases
in their activity rate due to cohort
effects and rising levels of education;
policy measures designed to encour-
age increased female and older workers
participation( 36
); and the fact that the
initial labour market shock did not hit
women and older workers as strongly as
prime-age males.
Chart 17 shows that the decline in activ-
ity rate for prime-age men was lim-
ited (–0.8 pp) compared to the decline in
(36
) The increase in older workers participation
over the last decades was also driven by
an overall improvement in their health
status, see European Commission (2011a),
Chapter 5.
their employment rate (–4.8 pps), indicat-
ing that they were the group least likely to
fall into inactivity if they lost their job. LFS
data for 2013 also shows that, if prime-
age men become unemployed, they are
more likely to receive unemployment ben-
efits (43 %) than young people (18 %) or
prime-age women (36 %), notably due
to their more favourable employment
histories. This is one of the factors that
promote continuation of job search rather
than ‘discouragement’ and inactivity.
Chart 15: Activity rate by group (age and sex), EU-28, 2002–13 (in %)
30
40
50
60
70
80
90
100
201320122011201020092008200720062005200420032002
Men 15-24 Men 25-49 Men 50-64
Women 25-49Women 15-24 Women 50-64
75.7
92.6
48.3
64.3
40.9
43.4
44.9
92.0
72.1
39.3
79.7
56.9
Source: Eurostat, EU-LFS, [lfsi_agan].
Chart 16: Change in the activity rate by group
(age and sex) in EU-28, 2008–13 compared
to 2002–08, in percentage points
-4
-2
0
2
4
6
8
2002-08 2008-13
15-24 25-49 50-64
WomenMenWomenMenWomenMen
7.2
6.3
3.3
4.5
-1.4
-0.2
-0.8
0.2
1.4
2.6
-2.8
-0.6
Source: Eurostat, EU-LFS, [lfsa_argan].
Chart 17: Change in the employment and activity
rates by group (age and sex) in EU-28, 2008–13,
in percentage points
-8
-6
-4
-2
0
2
4
6
8
WomenMenWomenMenWomenMen
15-24 25-49 50-64
Changes in ER (pps) Changes in AR (pps)
4.9
6.3
3.3
0.9
-1.4
-3.9
-0.8
-4.8
1.4
-1.6
-2.8
-6.1
Source: Eurostat, EU-LFS, [lfsa_argan] and [lfsa_ergan].
Since 2008, the activity rates of older
workers (55–64) increased substan-
tially in most countries even in the
most affected countries ( 37
) while they
had been decreasing during the 1990s
recession ( 38
). Several changes explain
this difference.
• Older workers have been (in com-
parison to the 1990s) less affected
by job losses (see Chart 18) nota-
bly because their educational levels
(37
) In Spain, Portugal and Ireland, decreases
for men were more than offset by increases
for women.
(38
) For instance: in the UK (–1.6 pps over
1990–95), Italy (–4.2 pps over 1991–95)
and Germany (–2.9 pps over 1992–96)
with more pronounced drops for men
(respectively –5.8 pps, –7.3 pps and 4.9 pps).](https://image.slidesharecdn.com/fd1af655-5d67-4954-a059-19619f458af7-150123121918-conversion-gate01/85/KE-BD-14-001-EN-N-52-320.jpg)
![51
Chapter 1: The legacy of the crisis: resilience and challenges
have improved ( 39
) and the sectors
in which they are employed have
changed. Moreover, employers are
often reluctant to lay off their most
experienced workers, who also often
benefit from a better protection
(higher severance pay) than younger
workers due to longer employment
histories ( 40
).
• If they become unemployed, older
workers are less likely than before
to withdraw from the labour market
not least because of policies intro-
duced over the last two decades
to extend working lives, such as
reforms in pension schemes (general
increase in the statutory retirement
age), and early retirement schemes.
Moreover, alternative options such
as disability schemes have been
closed or made less accessible ( 41
).
The continued increase in female activity
rates also results from a combination
of factors.
• Women tend to work in sectors that
are less hit by the recession ( 42
) (see
also European Commission (2013),
Chapter 3). This seems to explain
most of the better performance of
women’s employment during the
crisis, while the ‘added-workers’
effects may also have played a part
(see Box 1).
• There has been a structural increase in
the participation of women, mainly due
(39
) Between 1992 and 2008, the overall level of
education of older workers increased more
quickly than for prime-age workers, even
when excluding the effects of the rising level
of education among women. EU-LFS data
for EU-15 countries shows that the share
of low-educated among male older workers
dropped sharply, from 53.9 % in 1992 to
32.3 % in 2008 (–21.6 pp) compared to
prime age workers (from 40.2 % to 28.2 %
or –12.0 pps). The share of tertiary educated
persons among older men increased more
sharply than among prime-age workers.
(40
) The share of older workers under involuntary
temporary contract is also much lower
(4.4 % among those aged 55–64 compared
to 8.1 % for prime-age and 14.7 % for young
workers, i.e. EU-LFS data for EU-28 in 2013).
(41
) European Commission (2011), Chapter 5.
(42
) Female employment was less affected by
the recession than male (respectively –0.6 %
over 2008–13 against –4.7 %). While the
two male-dominated sectors (manufacturing
and construction) were strongly affected by
the crisis, the two main female-dominated
sectors (education and human health and
social work) resisted well.
to rising levels of education of women
over time ( 43
). This has brought the
behaviour of women in the labour mar-
ket much closer to that of men with a
rising share of dual-earner households.
• Measures supporting female par-
ticipation such as flexible working
arrangements, the removal of finan-
cial disincentives for second earners,
childcare and elderly care facilities
have also played a role, together
with measures to retain older women
longer in the labour market ( 44
).
Until 2013, there were no signs of
a reversal in the policies supporting
female participation (see Section 4)
(43
) For instance, among women aged 25–49
(50–64) the share of those with not more
than lower secondary education decreased
from 41 to 22 % (64 to 38 %) between 1995
and 2013, or –19 pps (–26 pps), to the profit
of the medium and high educational groups
(based on EU-LFS data on EU-15).
(44
) Analysis by age and education confirms that
the overall increase in female activity rate
is not only due to change in the composition
(i.e. increase in average level of education)
and affected most sub-groups of women.
although this may no longer be the
case in some countries that have
applied major fiscal consolidation
measures ( 45
). Moreover, women
tend to be over-represented in public
and non-market service sectors that
are now becoming more adversely
affected by fiscal consolidation in
many Member States ( 46
).
Moreover, recent trends have not led to
a substantial decrease in the large gen-
der inequalities in the labour market that
persist in many EU Member States to
the disadvantage of women, in terms of
activity and employment rates as well as
in terms of part-time work and earnings.
(45
) European Commission (2012b).
(46
) European Parliament (2014).
Chart 18: Older workers less affected by job losses since 2008
than in the 1990s: changes in employment rates for prime-age
(25–54) and older (55–64) age groups in 1992–96 and 2008–13,
in percentage points, selected Member States
-15
-10
-5
0
5
10
15
2008-13
1992-96
2008-13
1992-96
2008-13
1992-96
2008-13
1992-96
2008-13
1992-96
2008-13
1992-96
2008-13
1992-96
2008-13
1992-96
25-54 55-64
EU-15 DE ES FR IT FI SE UK
Source: Eurostat, EU-LFS, [lfsi_emp_a].](https://image.slidesharecdn.com/fd1af655-5d67-4954-a059-19619f458af7-150123121918-conversion-gate01/85/KE-BD-14-001-EN-N-53-320.jpg)
![52
Employment and Social Developments in Europe 2014
Box 1: Some mixed evidence about ‘added-worker
effects’ during the recession
A recession can impact on labour market participation of ‘partnered’ women in two
ways: (a) it can discourage women from looking for a job or postpone their decision
(discouragement effect) or (b) it can foster participation in order to compensate for
the job loss of the partner (added-worker effect). It is hard to determine whether
the increase in female participation was due partly to the latter — or whether it
was entirely caused by other structural factors due to education and cohort effects.
Several reports support the added worker hypothesis without being totally conclusive:
• European Commission (2011b) shows that the activity rate of married women
with children was more reactive to male unemployment and that it has increased
faster since 2008 than for other women*.
• OECD (2012a) shows that in many countries partnered women were more likely
to have increased their working hours during the crisis than single women.
• European Commission (2012b) points out that over 2007–09, dual-earner
couples had lost ground mainly to the benefit of female breadwinner couples.
• European Commission (2013) shows that over 2007–11, the share of working
women with a non-working male partner increased in most Member States.
• Bredtmann et al (2014) found that women whose partner becomes unemployed
have a higher chances of entering the labour market and changing from part-
time to full-time employment than women whose partner remains employed.
The added worker effect varies over both the business cycle and the different
welfare regimes within Europe**.
• EU-SILC*** data do not show such added-worker effect, as women’s transitions
from inactivity to employment and from part-time to full-time employment do
not increase between 2007 and 2012.
While there is no robust evidence of an added-worker effect during the crisis, the
stronger share of women in employment, hours worked and earnings and the
increasing share of dual-earner households has helped to cushion the impact of
the recession on household incomes (OECD (2014c)).
Notes: * However, this is not true for all countries and may be due to other effects — for instance
the increase in investment in childcare facilities. ** For instance, for the UK, Bryan and Longhi (2013)
found an increase in job searches but only among single earner couples —which does not translate
into more success in finding work (consistent with declining job-finding rate), at least in the short-
term. *** Eurostat, EU-SILC, [ilc_lvhl30]. Note that these indicators are not available for different
groups of women (partnered or not, with or without children).
Limited increase in discouraged
workers during the recession
The number of persons available and want-
ing to work but not looking for a job ( 47
) (the
‘discouraged workers’) increased from 7.4
million in 2008 to 9.3 million in 2013 (or
from 3.1 % to 3.8 % of the labour force).
This increase was much lower than the
increase in unemployment and long-term
(47
) These are jobless persons (neither employed
nor unemployed) who do not qualify for
recording as unemployed (from the ILO
definition) because they are not actively
looking for a job (anymore), despite the fact
that they want to work and are available
for work. According to Eurostat, they include
‘discouraged workers but also persons
prevented from job seeking due to personal
or family circumstances’. However, for
convenience, this Section uses the term
‘discouraged workers’ to refer to all the
inactive persons wanting to work but not
looking for a job.
unemployment ( 48
) and can be viewed as
a positive sign insofar as it means that
unemployed persons continue to look for a
job and can potentially benefit from activa-
tion or (re)training.
Institutional factors can contribute to
limiting the number of discouraged
workers. For instance, countries where
the share of discouraged workers is the
(48
) Since 2008, the number of unemployed
increased from 16.8 million to 26.4 million
in 2013, and the number of long-term
unemployed almost doubled in the same
period (from 6.2 million to 12.3 million).
highest tend to be those with relatively
limited support for the unemployed or
the long-term unemployed ( 49
). Gener-
ally speaking, the countries that recorded
increases in discouraged workers since
2008 ( 50
) were those that combined a
strong labour market impact of the crisis
and relatively weak support services to
the unemployed ( 51
), whether in terms of
spending on active labour market policies
or income support.
There can also be other explanatory fac-
tors such as the extent to which there
are, or are not, incentives to register
as unemployed, the link to social assis-
tance schemes, or the actual probability
of finding a job. The availability of care
services for children or dependents may
also affect the labour supply given that
36 % of ‘discouraged workers’ in 2013
were women of prime-age (25–54),
a group more likely to be affected by
issues related to the combination of work
and family life. This share was highest
in Spain (41 %), Italy (47 %) and Greece
(49 %), all countries recognised as being
poor performers in terms of supporting
improved work-life balance ( 52
).
Remaining in education
Since 2008, an increasing number
of young people have remained in, or
have returned to, education, notably
within the younger age group (18–24)
and especially in Member States where
youth unemployment was especially high
(Spain, Ireland and Portugal) and where
the share of young people in education
had been below the EU average in 2004.
In some countries however, participation
in education has either stalled (Greece,
Italy, Romania, the Czech Republic and
Slovakia), or even declined (Poland and
Hungary).
(49
) In 2013, a very low share of long-term
unemployed were receiving unemployment
benefits (or assistance) in Italy (2 %),
Croatia (10 %), Bulgaria (1 %), Latvia (3 %)
or Estonia (4 %), all characterised by a
higher than average share of discouraged
workers –while the receipt rate of benefits
was rather high in some of the countries
displaying a low share of ‘discouraged
workers’ such as France, Germany, Malta,
Belgium and Denmark.
(50
) Croatia and Cyprus (strong increase) and
Finland, Romania, Spain, Italy, Hungary,
Greece and Slovenia (significant increase).
(51
) According to typology presented in Stovicek
and Turrini (2012)
(52
) They display high gender employment gaps,
high incidence of inactivity due to family
obligations as well as relatively insufficient
provision of child and/or dependent care
facilities (see European Commission (2013),
Chapter 3).](https://image.slidesharecdn.com/fd1af655-5d67-4954-a059-19619f458af7-150123121918-conversion-gate01/85/KE-BD-14-001-EN-N-54-320.jpg)
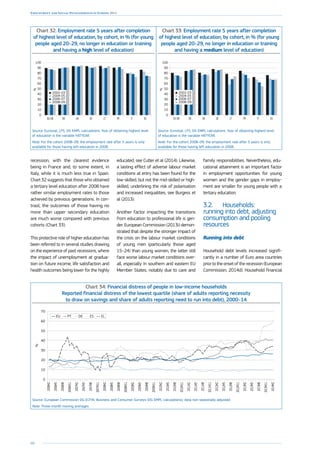
![53
Chapter 1: The legacy of the crisis: resilience and challenges
Chart 19: Proportion of young people in education or training, 18–24, % of age group
-20
-15
-10
-5
0
5
10
15
20
-80
-60
-40
-20
0
20
40
60
80
EU-28SILUDKNLDEPLLTCZEESKKRBEELLVFIESHUFRPTBGIEITROATSEMTCYUK
2004-08 change (pps)
2008-13 change (pps)
% of young people in education (2013), rhs
Source: EU-LFS, Social Situation Monitor calculations.
Notes: Only young people in education or training not economically active are measured. Countries are sorted by 2013 levels.
Chart 20: Share of 20-24 having completed upper secondary education in 2008 in %
and changes over 2004-08 and 2008-13 in percentage points
-20
-15
-10
-5
0
5
10
15
20
-100
-80
-60
-40
-20
0
20
40
60
80
100
HRSKCZPLSILTIESEFICYATFRBGHUBEELEELVEU-28ROUKITNLDELUDKMTESPT
2004-08 change (pps)
2008-13 change (pps)
% of 20-24 having completed upper secondary education in 2008 (rhs, %)
Source: Eurostat, EU-LFS [edat_lfse_08]; sorted by 2008 level.
Chart 21: Over-qualification rate: share of tertiary-educated workers working in low or medium-skilled
occupations (in %), age group 25–34, 2008 and 2013
0
5
10
15
20
25
30
35
40
45
CYESIEELBGPLITUKEEEU-28FRSKLVROHRATBESESILTHUCZFINLPTDEDKMTLU
20132008
Source: Eurostat, EU-LFS and DG EMPL calculations.
Notes: tertiary-educated is defined as workers having the highest level of qualification equal or above ISCED 5–6; low and medium-skilled occupations are
defined as occupational groups ISCO 4 to 9.
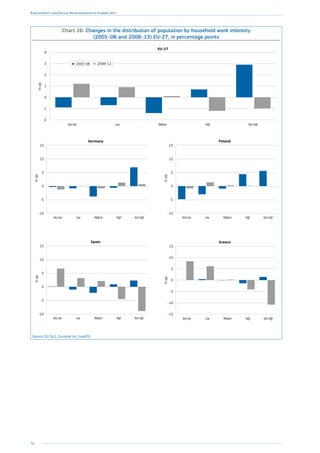
Overall, educational outcomes have
improved in most Member States (see
Chart 20) but especially so in those
countries where they were less favour-
able ten years ago and the share of
early school leavers from education
and training decreased. Delaying labour
market entry by remaining in educa-
tion is a rational response in times of
recession, but it is not yet clear whether
this will result in better labour market
outcomes in terms of human capi-
tal and skills development. The long-
term impact of increased educational
level will notably depend on the qual-
ity of education, on whether the skills
acquired are adapted to labour market
needs, as well as on whether cuts in
spending affect the quality of educa-
tion in the short to medium term (see
Section 4.3).](https://image.slidesharecdn.com/fd1af655-5d67-4954-a059-19619f458af7-150123121918-conversion-gate01/85/KE-BD-14-001-EN-N-55-320.jpg)
![62
Employment and Social Developments in Europe 2014
Across the EU as a whole, there is little
evidence that the recession as such led to
any major change as regards young peo-
ple living with their parents (see Chart 36)
although there have been substantial
increases (e.g. + 4 percentage points) in
the proportion of young people living with
their parents in Ireland, Spain, and Greece
since 2008. Qualitative research shows
that people sometimes have had no other
choice than to rely on family solidarity
(see Annex 3, Extract 4).
3.3. Impact on health
and access to healthcare
The potential long-term impact of the
crisis on health determinants (i.e., unem-
ployment, quality of work, precarious liv-
ing conditions) is threatening to increase
health inequalities between social groups
and Member States. There is extensive
research documenting the negative
impact of economic hardship on the
health status of individuals, which in a
recession may be further exacerbated by
greater difficulties in accessing or paying
for healthcare.
Many studies report that, during reces-
sions, individuals are more likely to suf-
fer from depression and stress (Cooper,
2011). Otterbach (2014) also reports, on
the basis of long-lasting panel data, that
being unemployed or insecure in one’s
job has a strong negative effect on life
satisfaction and health.
OECD (2014d) also notes evidence of a
possible link between the economic crisis
and obesity. Many families, especially in
the worst hit countries, have been forced
to cut food consumption or to switch to
lower-priced and less healthy foods.
Brenner (2013) identified unemploy-
ment as an important risk factor for
heart disease mortality at the start of the
2008/9 recession. Stuckler et al. 2011,
Reeves et al. 2012 reports a higher sui-
cide rate during recessions. In Italy, the
suicide rate increased by 10 % among
men younger than 65 between 2006 and
2010, with an increase by 25 % within
the 50–54 age group ( 70
).
(70
) Source: Eurostat, Causes of death —
crude death rate per 100 000 inhabitants
[hlth_cd_acdr].
Chart 36: Access to autonomy: changes in the share of young people
living with their parents (2004–13), in percentage points
-10
-8
-6
-4
-2
0
2
4
6
8
10
12
EU-28CYIEESELFRPTHRUKITATLULVNLMTDKSKFIHULTPLEERODESIBECZBGSE
2004-08
2008-13
Recent decrease Recent increase
ppchange(2004-13)
Source: Social Situation Monitor, based on LFS data.
Chart 37: Unmet need for healthcare by employment status
0
5
10
15
20
25
30
LVBGROEEELITPLCYPTDEFRHUSEEU-28BEFISKMTLUHRNLLTATDKUKESCZSIIE
Employed persons
Unemployed persons
%
Source: EU-SILC, Eurostat. Unmet need for healthcare is measured as the share of individuals
renouncing healthcare because of: cost, i.e. the person cannot afford to pay for it (too expensive); the
waiting list; or distance or means of transportation ( 1
).
(1
) This definition also applies to the European Core Health Indicator (ECHI) on Equity of access to
healthcare service (ECHI 80) for total population and by educational level.
Chart 38: Correlation of real expenditure per capita on sickness,
healthcare, disability and unmet healthcare needs, 2007–11
Percentagepointschange(2007-11)
inunmethealthcareneed
Growth (2007-11) in real public expenditure per capita in sickness and disability, %
NL
LV
PT
FI
BG
HU
EE
PLCY
LT
IELU
EL IT
ES
CZ
BE
DK
DE
FR
MT
AT ROSI
SK
SE
UK
-25 -15 -5 5 15 25 35 45 55
-10
-8
-6
-4
-2
0
2
4
Source: ESSPROS for expenditure in sickness, healthcare and disability and EU-SILC, Eurostat for unmet
need for healthcare.
The harmful and hazardous use of
alcohol and other substances are also
key factors in the development of
social and health inequalities in the
EU, influenced by unemployment and
economic downturns (European Com-
mission, 2013, Marmot et al. 2013).
Chart 37 shows that, in many Mem-
ber States, the unmet need for
healthcare is much greater among the
unemployed than among the employed.
Eurofound (2014, forthcoming) also
identified situations in which peo-
ple lost access to healthcare during](https://image.slidesharecdn.com/fd1af655-5d67-4954-a059-19619f458af7-150123121918-conversion-gate01/85/KE-BD-14-001-EN-N-64-320.jpg)
![77
Chapter 1: The legacy of the crisis: resilience and challenges
Large costs and rights differences between
the use of permanent and non-standard
work ( 100
) contracts may encourage compa-
nies to opt for the latter. From an employ-
ee’s point of view, however, these jobs may
be much less effective as stepping-stones
to permanent employment and they may
increase the risk of being excluded from
lifelong learning opportunities as well as
social protection (including pension rights)
and financial compensation in cases of
termination without fault.
Despite the trend towards an overall
reduction in EPL and a narrowing of
the legislative gap between temporary
and permanent contracts, the transition
from one to the other has been stead-
ily decreasing since the onset of the
recession in 2008 (Chart 59), signalling
a reduction of the ‘stepping stone’ poten-
tial of temporary contracts and potential
increase in labour market segmentation.
Even in countries where the EPL gap
reduced substantially during the reces-
sion (Czech Republic, Spain and Portugal,
2008–11) transition rates from tem-
porary to permanent contracts did not
increase. In contrast, countries with the
greatest gaps (such as Sweden and Ger-
many) saw some of the highest transi-
tion rates from temporary to permanent
contracts, suggesting that EPL alone can-
not be used to either explain or address
labour market segmentation concerns,
although the 2012 reform of the Spanish
labour market seems to have produced
some signs of improvement in transi-
tion rates from temporary to permanent
contracts compared to the previous year.
(100
) Such as fixed-term contracts, temporary
agency work, part-time work and
independent contract work.
Chart 59: Transition rate from temporary to permanent contracts for selected Member States, 2008–12
%oftemporaryyearbefore
0
10
20
30
40
50
60
70
80
SEDESIFIPTCYPLNLESFRATBEHULVCZLUDKITELMTEEROUKBGSKLT
2012
2010
2008
Low level of temporary
contracts [0-5%]
Medium level [5-10%] High level [10%]
Source: Eurostat, EU-SILC. Member States grouped by level of temporary contracts in total employment: low = 0–5 %, medium = 5–10 %, high = 10 %. For CY,
PL, PT, LU, HU, SK, SE, LT, RO and MT 2011 values used instead of 2012. No data for UK in 2008. No data for IE and HR. No data for DK prior to 2012 and none
reported for LT and LV due to break in series in 2012. Countries which reduced their EPL gap between 2008 and 2011 indicated by the white bars.
Chart 60: ALMP expenditure per person wanting to work (2010)
and exit rates out of short-term unemployment (2010–11)
ALMP expenditure (cat. 1.1-7) per person wanting to work 2010, pps
TransitionsfromSTUtoemployment2010-11,%
NL
LV
PT
FI
HU
EE
PL
CY
LT
IE
EL
ES
CZ
DE
FR
AT
RO
SI
SK
SEUK
0 1000 2000 3000 4000 5000 6000 7000
0
10
20
30
40
50
60
70
R² = 0.25
Correl coeff = 0.50
Source: EU-LFS, EU-LMP database and DG EMPL calculations. For NL and PT transitions from STU to
employment 2011-12 figures used due to availability of data.
5.3. The development
of activation during
the recession: investment
in human capital and
activation yielded positive
labour market outcomes
5.3.1. ALMP design and
funding have been subject
to many changes across the EU
Active labour market policies (ALMPs) that
provide training and job search assistance
to those out of work as well as incentives
to firms to hire them, are seen to contribute
positively to a well-functioning labour mar-
ket, most notably by speeding their return
to employment ( 101
). This is reflected in the
(101
) Section 4.2 above already touches on spending
on active and passive unemployment measures
in its analysis of social investment during
the crisis. However, its assessment of mostly
active measures does not include several
measures such as supported employment and
rehabilitation measures, direct job creation and
start-up incentives, which are included in the
ALMP calculations here.
findings of a study by Kluve (2010) which
examined the conclusions of 137 pro-
gramme evaluations from 96 academic
studies from 19 countries, and which
found that most ALMP measures (with
the exception of direct public employment
programs and programs targeting young
people) had a modest to high likelihood of
producing a significant positive impact on
employment rates ( 102
). This is echoed by
Chart 60. Empirical findings also note that
active labour market policies are also asso-
ciated with a higher matching efficiency
(European Commission, 2014c).
Across the EU as a whole, most of this
expenditure goes on supply side policies,
with some 59 % being devoted to PES and
training,withtheproportionspentontraining
being on the increase. In terms of type of
activelabourmarketpolicies,agreatdealof
divergence exists between Member States.
(102
) Kluve, J., ‘The effectiveness of European active
labor market programs’, Labour Economics
01/2010, Vol. 17, No 6, pp. 904–18.](https://image.slidesharecdn.com/fd1af655-5d67-4954-a059-19619f458af7-150123121918-conversion-gate01/85/KE-BD-14-001-EN-N-79-320.jpg)
![95
Chapter 1: The legacy of the crisis: resilience and challenges
Annex 3: Coping
strategies during
the recession —
Qualitative analysis
This project ( 117
), which was launched
in July 2013 in DG EMPL, investigates
the coping strategies of individuals and
households hit by the crisis, and that as
a result of this, either lost their job, and
therefore their main source of income,
or did not manage to find a regular job
in the first place. Specifically, it seeks to
understand what happens to family and
social ties in the course of a job loss;
what individuals do to remain active;
(117
) Facing the crisis - The coping strategies
of unemployed people in Europe (2014),
available at : http://ec.europa.eu/social/main.
jsp?catId=738langId=enpubId=7729typ
e=2furtherPubs=yes
and, whether individuals’ trust towards
institutions stays intact.
The project is novel in its approach, as it
goes beyond the use of traditional, quan-
titative methods, which help to describe
the economic and social situation of
individuals but oftentimes lack the abil-
ity to provide insights into the behaviour
response of individuals experiencing
hardship. Therefore, in order to uncover
the coping mechanisms for the impact
of the crisis, the project uses qualitative
research methods in addition to quantita-
tive research methods.
The main part of this qualitative research
forms a study, which consists of over
100 face-to-face interviews, conducted
with the help of national experts and the
coordination efforts of a high-level expert
using a sociological approach in seven EU
Member States (Germany, Greece, Spain,
France, Ireland, Portugal and Romania).
As such, in addition to the novelty lying in
the use of a mixed methods approach, the
project is also unique to its kind because of
its broader coverage, enabling international
comparison in times of crisis. The main
qualitative research component is then
complemented by a focus group study con-
ducted by TNS to enable a deeper insight
into coping mechanisms through group dis-
cussion, a specific quantitative research
component using EU-SILC data to analyse
the deprivation profile of households fac-
ing a severe economic shock, and a range
of EU-wide surveys (Eurobarometer, EQLS,
LFS and SHARE) to illustrate trends in dif-
ferent socioeconomic indicators.
Extracts below illustrate different aspects
of the trends reported in the core of
the chapter:
Extract 1: Informal work
Interviews with people having experienced long-term unemployment show that working in the informal economy is a matter of surviving:
‘Yeah, that’s right, if you have no choice, you have no choice... I wasn’t even receiving the RSA [earned income supplement], due to an
incomprehensible administrative hold-up, I had zero income, I mean zero, … I was doing computer repairs out of my house, undeclared,
and I was doing undeclared odd jobs, like mowing lawns, hanging wallpaper, parqueting floors.’ No 52. FR, M, 45 years
Also show that informal economy puts people into fragile situations. A women living in Athens explains how she was working in the
informal sector and was injured:
‘I’m working without insurance and they’re always late in paying me.’ No 21. EL, F, 43 years
‘Last month I had an accident at work...… After 25 days, I’d reached the point where the doctor told me I could walk again, so I returned
to work, …They said, “You better come back to work soon or else we’ll find someone else.”’ No 21. EL, F, 43 years
Extract 2: Running into debt
Interviews with people having experienced long-term unemployment illustrate that people hit by economic hardship face
difficulties in accessing credit and find low support from banks.
Family and friends are a frequent source of loans. Respondents prefer these informal routes to formalised loan agreements,
although such loans are not always emotionally stress free. However, such solutions remain limited as sometimes friends
and family members also experience financial difficulties.
‘Sometimes I have needed to ask a pal for €20 if my money hasn’t lasted over the last few days of the month. That’s normal,
that’s okay, even though it’s not great.’ (DE)
Loans were taken out for two main reasons: A one-off expense, either unexpected (such as a medical expense) or more pre-
dictable (such as a loan to pay one’s taxes); and to help cover daily expenses such as paying utility bills or paying for food.
‘I borrow €50 from a friend of mine at the beginning of each month. I use the money to pay the supermarket. I give back the
money at the end of the month only to borrow it again at the beginning of the next month. I do not seem able to break from
this pattern no matter what.’ (EL, Group 3)
Respondents were generally reluctant to approach banks for loans. Some respondents also mentioned struggling with loans
that they had incurred before the crisis. There was some, but limited mention of using overdraft facilities. Banks are also not
looked upon favourably as they are seen as part of the cause of the financial crisis.
‘I went to the bank to see whether I could delay payments on my mortgage and they told me I couldn’t, I would have to find
a way to take out a loan, they didn’t make it easy for me.’ (ES, Group 3)
Such situations are often reported to generate stress.
‘When someone lends you money your first reaction is relief, but later it’s just one more problem.’ (FR, Group 3)](https://image.slidesharecdn.com/fd1af655-5d67-4954-a059-19619f458af7-150123121918-conversion-gate01/85/KE-BD-14-001-EN-N-97-320.jpg)
![96
Employment and Social Developments in Europe 2014
Extract 3: Adjusting consumption
Interviews with people having experienced long-term unemployment show that people hit by economic hardship first cut expendi-
ture related to holidays and leisure activities, and this is the case whatever the country.
‘We’ve had no holidays in three or four years, maybe four or five.’
However, in countries most strongly hit by the crisis, restrictions are going much further. Restrictions in food and clothes expenditure
are reported. While in France or Germany, food deprivation is not considered an issue, this is not the case in other Member States,
where some cases of food restriction were reported in other Member States.
‘Well, it was quite tough. I mean myself and my wife might not eat for a day or two just to make sure the kids have food, that
kind of thing. […] We’ve just cut everything back as much as we could. We don’t put the lights on until necessary and the same
with the heating and all that kind of stuff.’ No 73. IE, M, 47 years
Energy bills are also a leverage to limit expenditures, and many individuals reported restrictions in this areas.
‘I get, when it’s really cold, I turn the heat up a little and I immediately turn it off and I wear, woollen jumpers, I wear warm
clothes, blankets, and I watch TV. So, I have no problem.’ No 38. ES, F, 53 years
Lastly, keeping a car means a lot to keep employability and efforts are generally being made to keep a car in the household,
but its use is also strongly limited.
‘It is a change in a way because they were never things we had to worry about, there were never things like, you know, putting
€10 or €5 of petrol in the car. This was something I never did, I just filled it up, you know what I mean. […] you’re conscious of
what journey you’re going to make. My daughter lives in Bray which is the other side of Dublin, so you’re sort of thinking, you
decide to go over to see her you’ve got to pay two tolls and petrol.’ No 68. IE, M 51 years
Extract 4: Pooling resources — family solidarities
The coping strategies during the great recession project illustrates that, despite the cultural differences in perceiving the role of intra-
family financial support, people have sometimes no other choice than relying on family solidarity. Among the seven Member States
investigated during the project, support from family was not perceived to a comparable extend in France or Germany compared to
southern Europe Member States. The norm of autonomy varies. Nevertheless, even in Member States where cultural norms would
tend to strengthen family solidarity, adults relying on their parents report that they do so because they have no other income support.
They also clearly say that they are living with their parents because they have no financial means to live independently.
‘I’m only 62 years old, […] I’m not entitled to anything: neither retirement nor unemployment benefit, not even the Social Integration
Income. I am supposed to live off what?! […] Every morning I have to expect… my mother to give me a euro (that’s the truth!) for a
coffee. Then, when I’m out of cigarettes, I don’t drink the coffee, and I say to my mother… “Mother, I need 2€ to buy something…”’
No 89. PT, F, 62 years
‘They’re struggling now themselves because my mam only works three days a week, so she doesn’t get much money at all, and
my dad’s pay got cut as well, recently, so they really have no money to be going out spare; they’re struggling themselves…. So, they
would really like, they are always at me to get a job but, look, I have been trying my hardest lately and there’s nothing coming up for
me.’ No 65. IE, Woman, 22 years
Extract 5: Impact on health and access to healthcare
People hit by economic shock and unemployment often report deterioration in their health status.
In addition to increased medical needs related to economic adverse circumstances, many interviewees report difficulties in meeting
health-related expenses.
‘I am missing many teeth and I cannot make it. In fact, I have several broken teeth, (...) because doing root canals, that’s worth a lot
of money that I do not possess. And, for me, man, I understand that the mouth is essential for food and for all that but I still have a
few teeth and with those I am still managing.’ No 46. ES, M, 43 years
‘I have cholesterol […] if I take pills... if I take the pill my wife and daughters end up not eating and no, I’d rather stay without it than...
all I have is for them.’ No 44. ES, M, 49 years
This adds up to greater difficulties in accessing healthcare, which might be itself reduced subsequently to cuts in expenditure.
‘There is too much discrimination in the healthcare system. Forget it if you want to go to the dentist. You need a thousand euros for
your teeth. If you need an emergency X-ray, you’ll wait a month and a half. Even if you have very advanced cancer, without money,
you can’t get treatment.’ No 17. EL, F, 51 years,
However, there are large national variations in reporting such difficulties. In France and Germany very few interviewees report dif-
ficulties in paying for health-related expenses, despite many of them mentioning greater needs linked to their economic distress. In
other Member States such as Greece, Spain, Portugal or Romania, the situation is however much more frequent.](https://image.slidesharecdn.com/fd1af655-5d67-4954-a059-19619f458af7-150123121918-conversion-gate01/85/KE-BD-14-001-EN-N-98-320.jpg)
![97
Chapter 1: The legacy of the crisis: resilience and challenges
Extract 6: Losing trust in institutions
Qualitative analysis (see Box 1) highlights that, the distrust in institutions expressed by persons unemployed for at least one
year ranges from a balanced criticism to an overall rejection.
‘We are paying for things that have nothing to do with us.’ No 75.
Generally speaking, unemployed interviewees are feeling ignored by their representatives. They also share the feeling that
they pay disproportionately for economic recovery. Europe is especially seen as a major player in this feeling, together with
banks and firms:
‘I think an awful lot went wrong with this country when the government decided that they needed to look good in Europe
rather than look good to their own population I suppose.’ No 71
Nevertheless, public services continue to be seen as a tool towards better lives. Cuts in public expenditure severely affect
their lives.
‘We don’t trust the politicians anymore, because they have been a total disappointment. We can’t believe a thing they say
anymore. [....] There is also this downgrading of education by the government and it forces us to dig our hands into our pockets
to pay for extra classes, you know, but meanwhile we pay our taxes and are supposed to have an education system, but this
current downgrading of education is very disappointing… The State has even become our predator.’ No 34. EL, M., 55 years
In some countries strongly affected by the great recession, however, the feeling of distrust toward institutions is much more
pronounced —sometimes even violent, and embeds all types of institutions.
‘I’ve stopped watching the news. … I’ve stopped worrying about politics. It just tells me that it’s every man for himself in life.
Let everyone tend their own garden, that’s how it is, and I’ve put on blinkers and just say keep on going forward because I
have a child to raise.’ No 21, F, EL
‘My country simply died. My country, if it continues to be ruled by these people, by the idea of the people who are now govern-
ing, my country will die soon.’ No 93, PT
Extract 7: Losing trust in the public employment services
Interviews with people having experienced long-term unemployment show that trust in public employment service is varying
across Member States. There is a general feeling ranging from mistrust to defiance.
‘I get very down. There’s days I’ll just be sick of it.[…] I’ve sent out about 500 or 600 CVs […] I got a few interviews, but you
go to the interviews and it’s just like I’ve done interview techniques so it’s not a case of I don’t know what I’m doing when
I’m in there, it’s just the case that you go for the job […] and then they tell you and then OK and then it’s the whole jumping
through hoops that just gets you really down.’ No 72. IE, M, 38 years](https://image.slidesharecdn.com/fd1af655-5d67-4954-a059-19619f458af7-150123121918-conversion-gate01/85/KE-BD-14-001-EN-N-99-320.jpg)
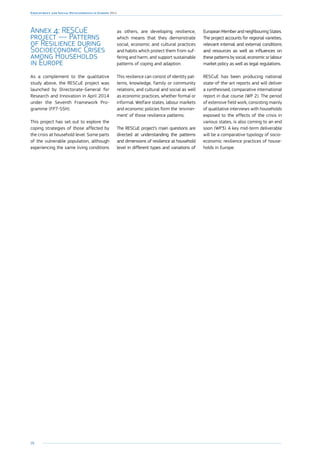
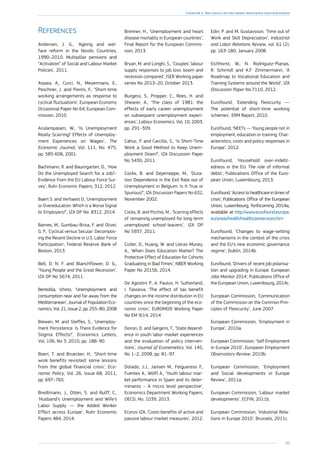
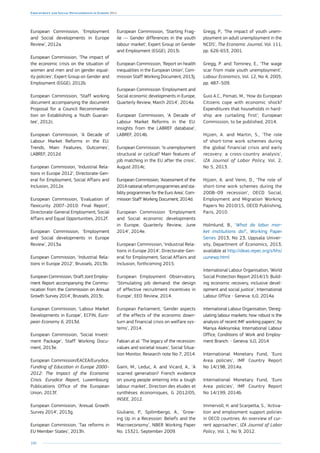
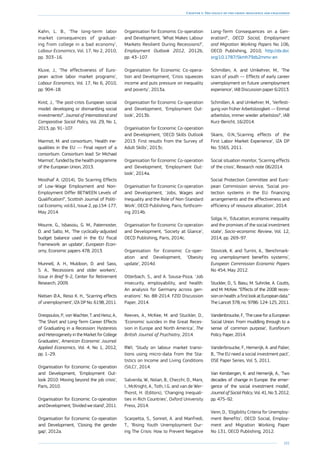

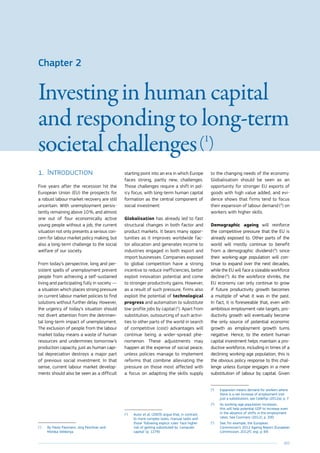
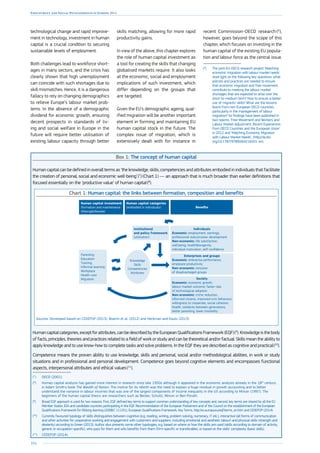
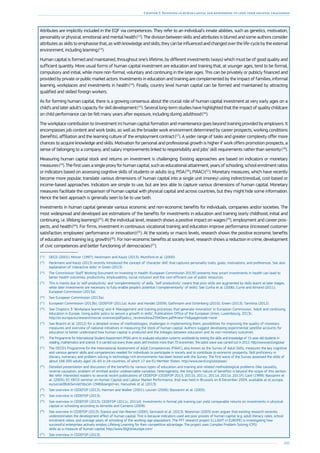
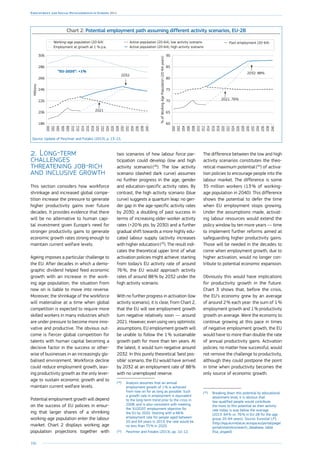
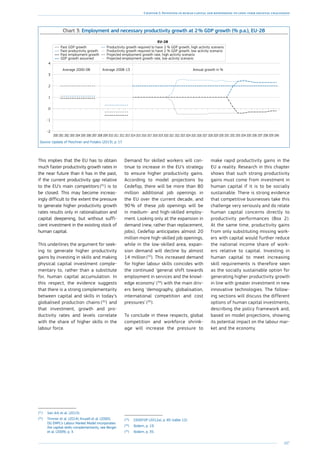
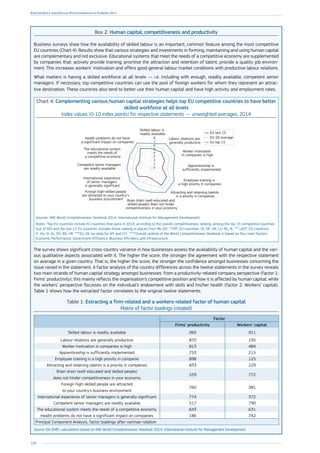
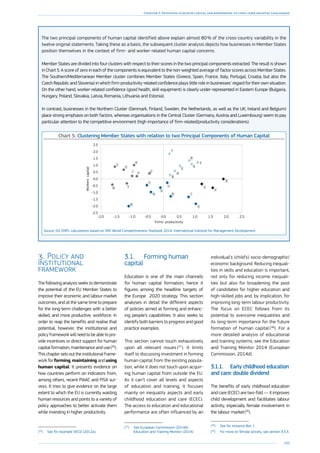
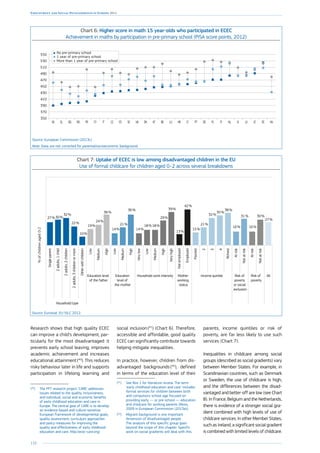
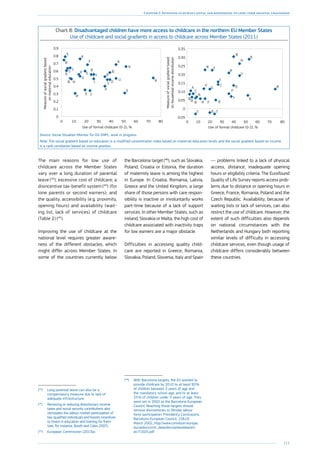
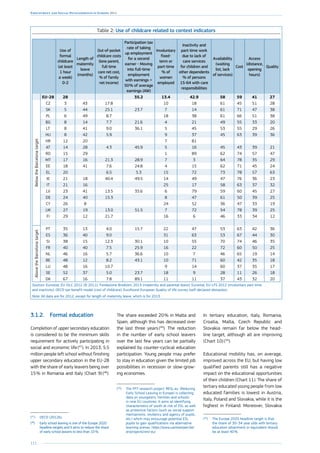
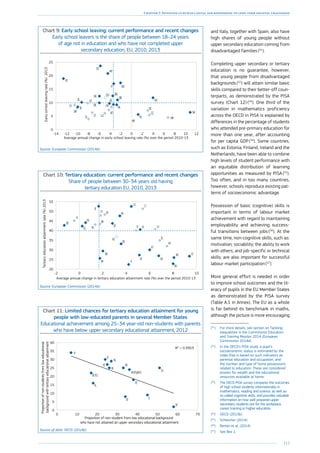
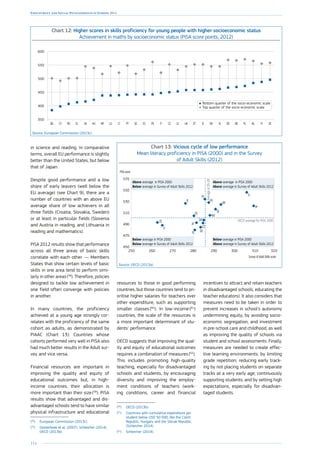
![115
Chapter 2: Investing in human capital and responding to long-term societal challenges
3.2. Maintaining human
capital
The dynamic character of human capi-
tal accumulation implies that the skills
acquired at one stage form the basis
from which further steps can be made
throughout the life-cycle (63
), with the
possibility for further accumulation or
depreciation at every stage.
Higher participation rates in education can
have a positive effect on human capital
formation, but they do not ensure that
skills obtained during education are main-
tained and used throughout the working
life. Traditional measures of human capi-
tal, as used in macroeconomic analyses,
focus essentially on length and level of
formal education, but a comprehensive
analysis of human capital needs to move
beyond this. Lifelong learning and training,
in particular, play critical roles in maintain-
ing human capital once formal education
has been completed. (64
)
3.2.1. Lifelong learning and
training: complementary roles
of public and private sectors
The most competitive countries in the EU
seem to be those which invest a higher
share of GDP in education and which have
high participation in formal and non-for-
mal education and training (Chart 14) (65
).
In these countries, the private sector
seems more likely to train employees,
who then show a higher propensity to
(63
) So called ‘self-productivity’ and
‘complementarity’ upon skills
(Cunha et al. 2006).
(64
) Beblavy and Maselli (2014) argue that the
number of low-skilled workers shouldn’t be
considered only as a stock, but also as a
flow variable, as one can become low-skilled
during working life. Kurekova et al (2013)
point to structural and institutional barriers
that can draw people into low-skillness such
as technological change, growing service
sector or educational expansion.
(65
) In assessing the importance of training,
several measures have proved useful. They
have materialised in different indicators that
measure the efforts of public finances, private
enterprises and individuals in forming and
maintaining human capital. In particular, we
consider: total general government expenditure
on education, as a share of GDP; overall
participation rate in education and training of
the population; the percentage of employees
taking part in continuous vocational training
courses; the share of enterprises providing
training for their employees; the rate of young
people (aged 15–29) neither in employment
nor in education and training (NEET rate);
the employment rate in the country. By
normalising these indicators, with a max-min
method, in a 0–1 scale, we can compare
them directly in Chart 14. In particular, we can
compare them with the aggregates of Member
States used previously according to their level
of competitiveness as stated in the IMD World
Competitiveness Yearbook 2014 (see Box 2).
participate in continuous vocational train-
ing. Unsurprisingly, these countries also
have significantly lower NEET rates and
higher employment rates. The differences
between the most competitive and least
competitive countries can be observed.
On the input side, the biggest gaps are
in terms of participation rates and of the
percentage of private sector enterprises
investing in employee training. On the out-
come side, NEET rates and employment
rates differ greatly.
The role of the private sector in maintain-
ing human capital, by investing in voca-
tional training of employees, is particularly
relevant not only from a public finance
perspective, but also in terms of effective-
ness of the investment, as enterprises can
fine-tune and adapt training programmes
to their specific needs.
In general, training provided by the public
and private sectors can be seen as both
necessary and complementary. Chart 15
shows that countries that spend more on
education, as a share of GDP, are also
those whose firms are more engaged in
providing employee training. Moreover,
this positive relationship has been rather
stable over time, as shown by the trend
line through 1999, 2005 and 2010 (66
).
(66
) See chapter 5 ‘Markets and systems of
adult education and CVET: the governance
challenge’ in European Commission, 2013b.
Chart 14: More competitive countries are those more able to maintain
human capital
EU last 15
EU top 15
EU-28 average
Employment
rate [LFS]
2011
NEETs rate
15-29
(inverse scale)
[LFS]
2011
Percentage of employees (all enterprises)
participating in CVT courses [CVT] 2010
Training enterprises
as % of all
enterprises [CVT] 2010
Participation rate
in education
and training [AES]
Formal non-formal
2011
Total general government expenditures
in education, in % of GDP [COFOG] 2011
0.2
0
0.4
0.6
0.8
1.0
Source: Eurostat (COFOG, AES, CVTS, LFS), DG EMPL elaborations.
Notes: *Top EU countries include EU countries that were in 2014, according to the overall competitiveness
ranking, among the top 15 competitive countries (out of 60) and the last 15 EU countries includes those
ranking in places from 46–60. **TOP_EU countries: SE, DE, DK, LU, NL, IE. *** LAST_EU countries: IT, HU, SI, EL,
RO, BG, HR. ****Overall ranking of the World Competitiveness Yearbook is based on four main factors: Economic
Performance; Government Efficiency; Business Efficiency and Infrastructure. The scale 0 to 1 for the different
indicators is calculated by normalising their values with a standard MAX/MIN normalisation formula.
Chart 15: Public and private sector investments in human capital are
complementary and mutually reinforcing
General government expenditure on education (X-axis), as a share of GDP, and
share of enterprises providing training (Y-axis) (years 1999, 2005 and 2010)
1999
Linear (1999)
Linear (2005)
Linear (2010)
2005
2010
2.5 3.5 4.5 5.5 6.5 7.5 8.5
0
10
20
30
40
50
60
70
80
90
100
Sources: COFOG and CVTS, DG EMPL elaborations.](https://image.slidesharecdn.com/fd1af655-5d67-4954-a059-19619f458af7-150123121918-conversion-gate01/85/KE-BD-14-001-EN-N-117-320.jpg)
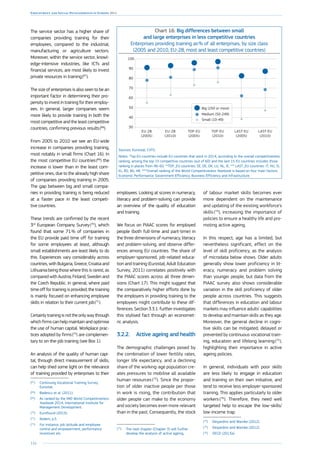
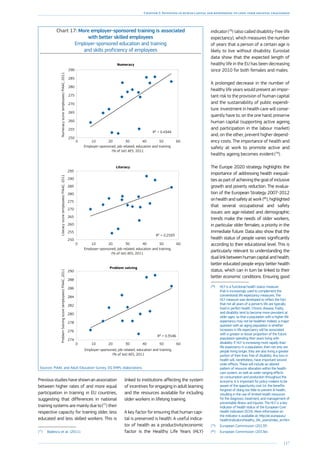
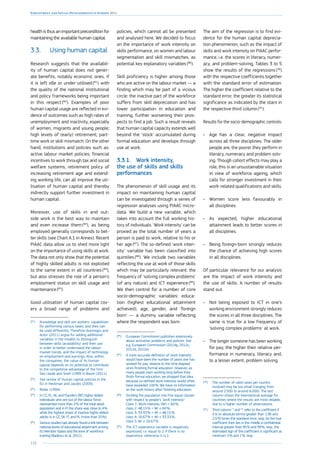
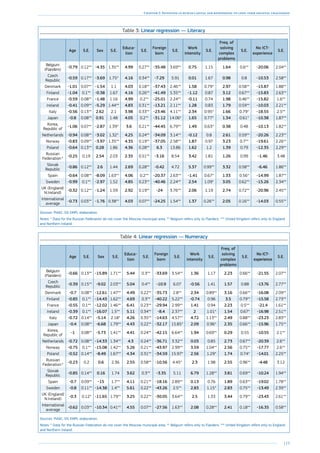
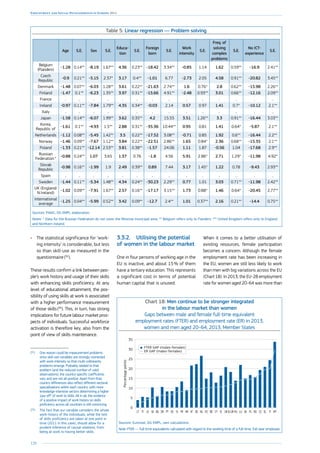
![121
Chapter 2: Investing in human capital and responding to long-term societal challenges
12 percentage points lower than that of
men (62.5 % vs 74.2 %) — yet this is a sig-
nificant improvement on the 17 percentage
points gap in 2002 (58.1 % vs 75.4 %) (94
).
Not only are women less likely to work
than men, those who do are, on aver-
age, likely to work fewer hours than
men. When employment is measured in
full-time equivalents, the largest gaps
are in Member States where the female
employment rate is relatively high (e.g.
Austria, Belgium, The Netherlands, Ireland,
Germany and the United Kingdom)
(Chart 18). In other words, part of higher
female employment rates is a result of
greater participation in part-time work
and, to that extent, reflects less, not more,
exposure to work-related skill usage and
strong under-employment.
(94
) Over the last two decades, the employment
rate of women in the EU-15 increased by more
than ten percentage points, from 52.8 % in
1995 to 63.7 % in 2013. [lfsa_ergan].
Chart 19: High educated women — more in population, less in employment
Employment rate gender gap in percentage points (male — female); share of female/male
with high educational attainment (% of respective population), 2013, 25–64 years
0
5
10
15
20
25
30
35
40
45
50
ROITMTATHRCZSKPTHUDEELEU-28PLBGNLSIFRESLVBELUDKUKCYLTSEIEEEFI
0
5
10
15
20
25
30
35
40
45
Percentagepoints(males-females)
%oftotalmale/femalepopulation
Female (rhs)
Male (rhs)
ER gender gap (lhs)
Sources: Eurostat, DG EMPL, own calculations.
Notes: *Countries are ranked according to the decreasing share of women with high educational attainment. ** High educational attainments means short-cycle
tertiary, bachelor or equivalent, master or equivalent and doctoral or equivalent (levels 5–8).
Chart 20: Some policy mixes are better for women’s labour market integration
FTER gap (percentage points) and female employment rate (%) in the EU Member States in 2013
Femaleemploymentrate
Full-time equivalent employment rate gender gap
High female employment
- shorter hours
Relative good utilisation
of female labour force
Relative worse utilisation
of female labour force
Low female employment
- longer hours
0 5 10 15 20 25 30 35 40
40
45
50
55
60
65
70
75
80
BE
BG
CZ
DK DE
EE
IE
EL
ES
FR
HR IT
CY
LV
LT
LU
HU
MT
NL
AT
PL
PT
RO
SI
SK
FI
SE
UK
Sources: Eurostat, DG EMPL, own calculations.
Note: FTER — full-time equivalents calculated with regard to the working time of a full-time, full-year employee.
The gender employment gap is strongly
linked to family and care activities,
with prime age women being most likely
to work fewer hours or be inactive due
to family and care-related activities, and
this is only changing slowly (95
).
Indeed, the stock of female human capi-
tal is not used effectively. As for men,
for women too the likelihood of work-
ing increases with higher educational
attainment, but the employment rate
gender gap remains significant even at
the highest levels of educational attain-
ment (Chart 19). In all but four countries
(Luxembourg, Germany, Austria and the
Netherlands), a greater share of women
have higher educational attainment than
men, with the biggest differences occur-
ring in Estonia and Latvia (more than
15 pps). Despite this, the employment
rate of men exceeded that of women in
(95
) European Commission (2014f).
all Member States, with the exception of
Croatia, where the rates were the same.
The Commission’s analyses (96
) reveal
that a country’s relative performance in
terms of gender-gap tends to be simi-
lar across all educational levels: e.g. low
gender gaps exist in Bulgaria, Lithuania,
Latvia, Hungary and Slovakia and high
gaps occur in Germany, Belgium, Ireland,
the United Kingdom and the Netherlands.
The analysis in the 2013 Economic and
Social Developments in Europe review
showed some distinct patterns among
Member States regarding the gender
gap in total hours worked. Only a few
Member States, mainly Nordic and Baltic
countries, have so far succeeded in
implementing a policy mix that combines
high female employment rates with a
low gender gap in total hours worked
(Chart 20).
(96
) European Commission (2014f).](https://image.slidesharecdn.com/fd1af655-5d67-4954-a059-19619f458af7-150123121918-conversion-gate01/85/KE-BD-14-001-EN-N-123-320.jpg)
![122
Employment and Social Developments in Europe 2014
Chart 21: Temporary contracts are the main typology of new jobs created in the last quarters
Employees in permanent and temporary work in the EU-28, self-employment and total employment (15–64)Changeonpreviousyear(000'spersons)
2008 2009 2010 2011 2012 2013 2014
-6000
-5000
-4000
-3000
-2000
-1000
0
1000
2000
3000
4000
5000
Q1Q4Q3Q2Q1Q4Q3Q2Q1Q4Q3Q2Q1Q4Q3Q2Q1Q4Q3Q2Q1Q4Q3Q2Q1
Permanent employees Temporary employees
Self-employed Overall
Sources: Eurostat, LFS [lfsq_egaps,lfsq_etgaed] Data non-seasonally adjusted.
The policy mix notably includes: avail-
ability of flexible working arrange-
ments and long part-time positions
for parents; incentives to share unpaid
work within the couple; and available,
affordable, quality childcare. Some coun-
tries, such as Germany and the United
Kingdom, have a high share of working
women but with relatively short hours.
Others, such as Spain or Ireland, have a
lower female labour market participation
rate although those women who do work
tend to work longer hours.
OECD analysis reveals that closing the
gender gap reveals some great poten-
tial in terms of economic growth through
activating existing labour resources (97
).
In countries such as Ireland and
Luxembourg, which have low female
activity, a convergence in activity rates
could increase the total labour force by
more than 20 %. Moreover, an increase
in the working time of women would
obviously increase still further the con-
vergence in labour force intensity. The
convergence in intensity contributes
more to the increase in the total size of
the labour force in countries with a high
share of women working part-time.
Furthermore, the OECD estimates that
halving the gender labour-force partici-
pation gap could bring a 6.2 % gain in
GDP across 21 EU members of the OECD
by 2030, plus a further 6.2 % gain for full
convergence. The largest gains from full
convergence are projected in countries
like Italy and Greece with large existing
gender gaps (around 20 %) while the
growth potential is limited in countries
like Finland or Sweden (less than 5 %).
(97
) Thevenon et al. (2012).
3.3.3. Labour market
segmentation and skill
mismatches
Strong labour market segmentation (high
incidence of atypical work) and the per-
sistence of skill mismatches on the labour
market, together with a rising share of long-
term unemployment, point to the increas-
ingly structural nature of the EU’s labour
market problems and are a threat to future
welfare. They create a persistent exclusion
of ‘outsiders’ and force many people into
work that does not match their skills. The
resulting depreciation of skills will inhibit
growth for a long period of time, while at the
same time skills needs are changing, with
an increasing need for highly-skilled work-
ers. In light of the human capital shortages
to be expected, the policy focus must lie on
structural labour market reforms.
In recent years, changes in labour market
conditions and policy changes, like dereg-
ulation of non-standard work forms (98
),
have contributed to the increase in non-
standard forms of contracts and a rise in
part-time work and the use of temporary
contracts. For example, a tendency to make
more extensive use of temporary contract
was already evident before the crisis, par-
ticularly in some countries. However, tem-
porary contracts have become the main
form of new jobs created in recent quarters
(Chart 21) (99
).
(98
) Eichhorst, 2013.
(99
) An employee is considered as having a
temporary job if employer and employee
agree that its end is determined by objective
conditions, such as a specific date, the
completion of an assignment, or the return
of an employee who is temporarily replaced.
Typical cases include: people in seasonal
employment; people engaged by an agency
or employment exchange and hired to a third
party to perform a specific task (unless there is
a written work contract of unlimited duration);
people with specific training contracts (Eurostat).
While the share of temporary contracts
in total employment is higher for women,
more recently the increase has been
faster for men.
Growing levels of atypical employment,
such as part-time work, casual work or
work on temporary contracts reflects
strong labour market segmentation and
is therefore considered to be one of the
main drivers of increasing inequality,
even in the pre-crisis period, despite
employment growth (100
). Recent stud-
ies have also demonstrated that the
increase in non-standard work contracts
has had a negative influence on total
productivity as a result of an underin-
vestment in human capital (101
).
In the vast majority of countries, workers
on temporary contracts are found (102
) to
make less intensive use of their informa-
tion-processing skills and some generic
skills (e.g. task direction, influencing and
self-organising), than those in perma-
nent employment — suggesting that
the tasks carried out by workers hired
under different contractual arrange-
ments vary substantially. Such a usage
gap can potentially reduce future oppor-
tunities for temporary workers and have
a negative impact on labour productivity
of young workers if they are on tempo-
rary contracts for long periods. Moreover,
employers invest less in training of tem-
porary workers.
Therefore, tapping into existing labour
resources requires the promotion of
regular instead of atypical employment,
helping transition to permanent jobs and
(100
) OECD (2014a).
(101
) Franceschi and Mariani (2014); and ISFOL (2014).
(102
) Quintini (2014).](https://image.slidesharecdn.com/fd1af655-5d67-4954-a059-19619f458af7-150123121918-conversion-gate01/85/KE-BD-14-001-EN-N-124-320.jpg)
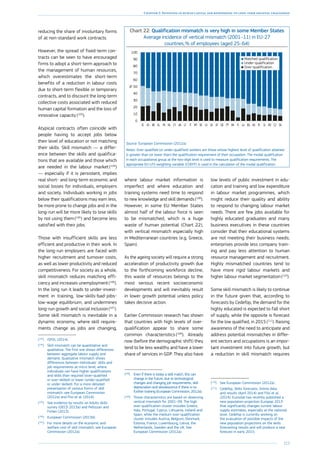
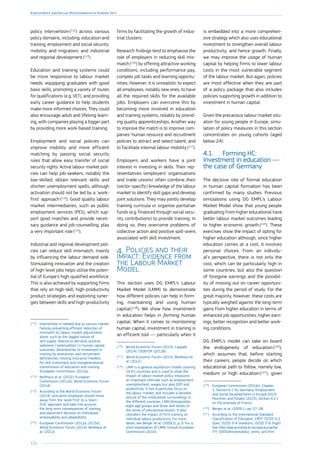
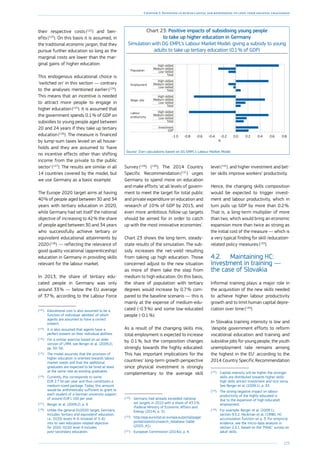
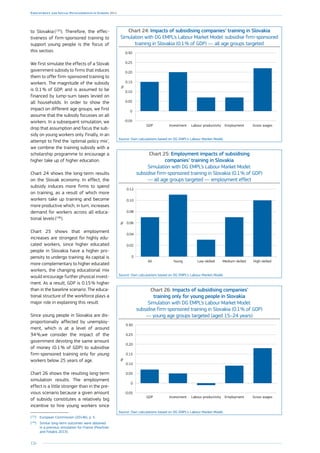
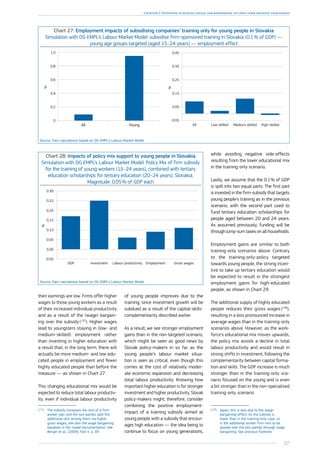
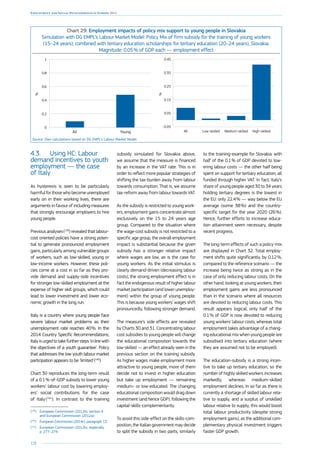
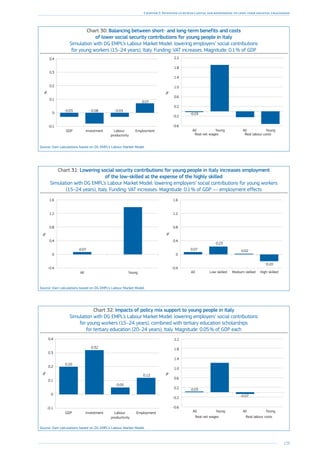
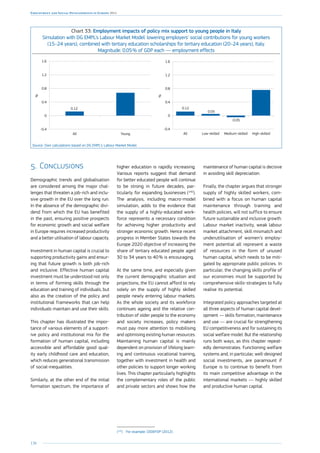
![131
Chapter 2: Investing in human capital and responding to long-term societal challenges
Annex
Table A.1: Share of low achievers among young people too high in several Members States and has even
increased in some
Share of low achievers in reading, maths and science among 15 year olds (PISA), benchmark less than 15 %, 2012,
change 2009–12 in percentage points, EU and EU Member States
2012
Reading
Evolution
2009-12
(% points)
2012
Maths
Evolution
2009-12
(% points)
2012
Science
Evolution
2009-12
(% points)
EU 17.8 -1.9 22.1 -0.2 16.6 -1.2
Belgium 16.1 -1.5 19.0 -0.2 17.7 -0.4
Bulgaria 39.4 -1.6 43.8 -3.3 36.9 -1.9
Czech Republic 16.9 -6.2 21.0 -1.3 13.8 -3.5
Denmark 14.6 -0.6 16.8 -0.3 16.7 0.1
Germany 14.5 -4.0 17.7 -0.9 12.2 -2.6
Estonia 9.1 -4.2 10.5 -2.1 5.0 -3.3
Ireland 9.6 -7.6 16.9 -3.9 11.1 -4.1
Greece 22.6 1.3 35.7 5.4 25.5 0.2
Spain 18.3 -1.3 23.6 -0.1 15.7 -2.5
France 18.9 -0.9 22.4 -0.1 18.7 -0.6
Croatia 18.7 -3.7 29.9 -3.3 17.3 -1.2
Italy 19.5 -1.5 24.7 -0.2 18.7 -1.9
Cyprus 32.8 : 42.0 : 38.0 :
Latvia 17.0 -0.6 19.9 -2.7 12.4 -2.3
Lithuania 21.2 -3.2 26.0 -0.3 16.1 -0.9
Luxembourg 22.2 -3.8 24.3 0.4 22.2 -1.5
Hungary 19.7 2.1 28.1 5.8 18.0 3.9
Malta : : : : : :
Netherlands 14.0 -0.3 14.8 1.4 13.1 -0.1
Austria 19.5 -8.0 18.7 -4.5 15.8 -5.2
Poland 10.6 -4.4 14.4 -6.1 9.0 -4.1
Portugal 18.8 1.2 24.9 1.2 19.0 2.5
Romania 37.3 -3.1 40.8 -6.2 37.3 -4.1
Slovenia 21.1 -0.1 20.1 -0.2 12.9 -1.9
Slovakia 28.2 6.0 27.5 6.5 26.9 7.6
Finland 11.3 3.2 12.3 4.5 7.7 1.7
Sweden 22.7 5.3 27.1 6.0 22.2 3.1
UK 16.6 -1.8 21.8 1.6 15.0 0.0
Japan 9.8 -3.8 11.1 -1.4 8.5 0.0
USA 16.6 -1.0 25.8 2.5 18.1 -2.2
Source: EC Press release, http://europa.eu/rapid/press-release_IP-13-1198_en.htm.
Note: [1] The PISA 2012 scores are divided into six proficiency levels ranging from the lowest, level 1, to the highest, level 6. Low achievement is defined as
performance below level 2: reading (score 407.47), mathematics (score 420.07) and science (score409.54).
Chart A.1: Being employed generally corresponds to better skills
Average literacy scores by labour status
230
240
250
260
270
280
290
300
ITESPLCYATIEDECZDKUKEESKBESENLFI
Inactive
Employed
Unemployed
Source: PIAAC, DG EMPL elaboration.](https://image.slidesharecdn.com/fd1af655-5d67-4954-a059-19619f458af7-150123121918-conversion-gate01/85/KE-BD-14-001-EN-N-133-320.jpg)
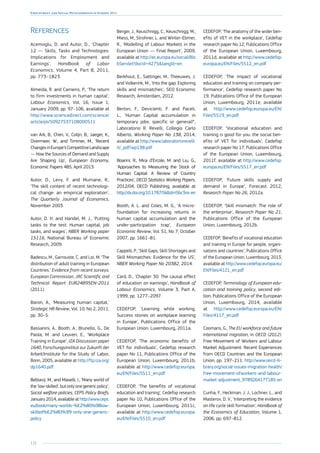
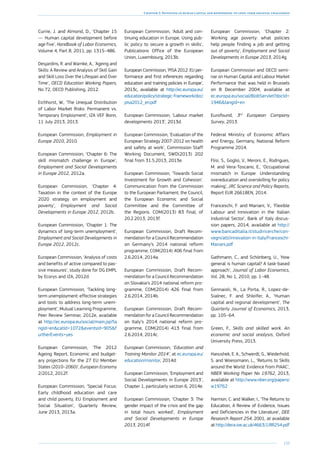
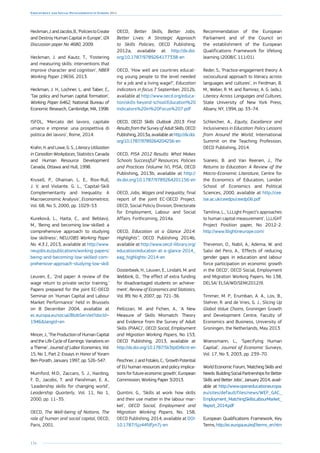
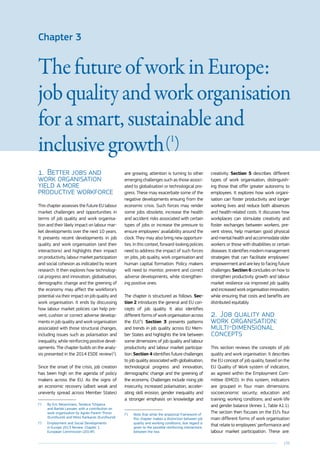
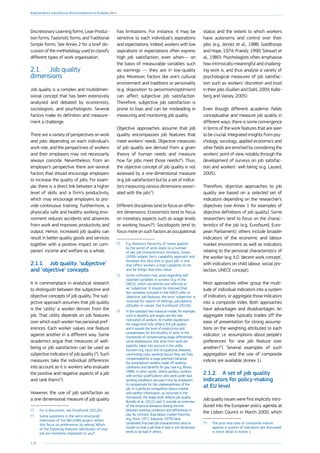
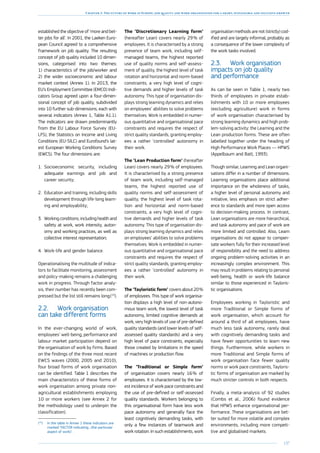
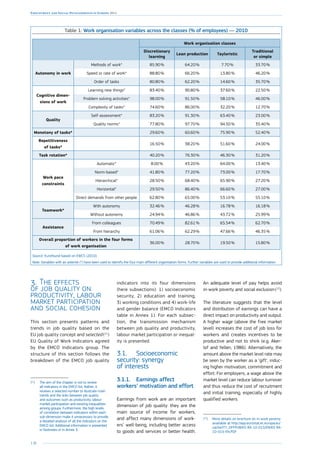
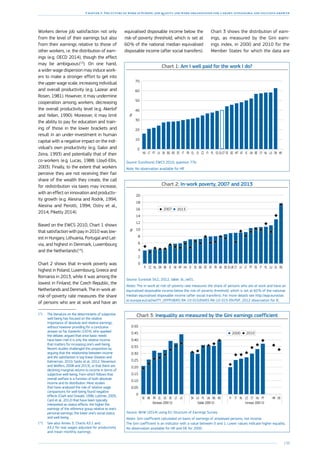
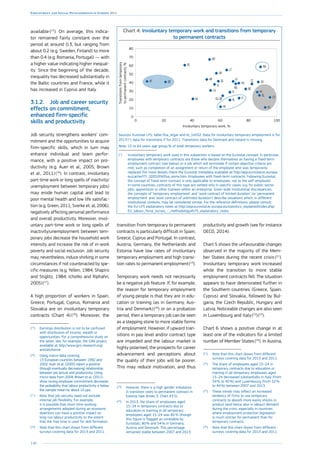
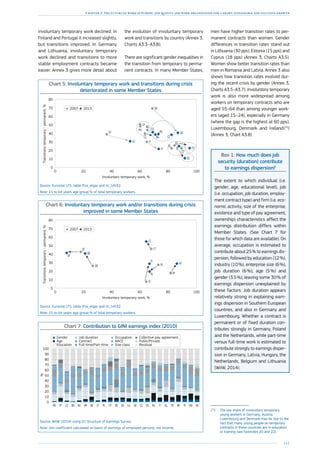
![142
Employment and Social Developments in Europe 2014
Chart 8: Participation rates in life-long learning (LLL), 2007–13
DKSEFIFRNLUKLUATEESIESEU-28PTCZDEMTIECYBELVITLTPLHUSKELHRROBG
0
5
10
15
20
25
30
35
20132007
%
Source: Eurostat table trng_lfse_02
Note: Break in series for CZ, FR, LU, LV, NL, PT and SE.
Chart 9: On-the-job training, 2010
0
10
20
30
40
50
60
HRFISKSEDKSIUKNLATIEDEBEEU-27EECZLULVPLHUCYMTFRLTESPTROBGITEL
%
Source: Eurofound, EWCS 2010, question 61c.
Note: No observation available for HR.
3.2. Education
and training may
enhance employability
and productivity
The literature (e.g. Lucas, 1988;
Rebelo, 1991; Dearden et al., 2006;
Christen et al., 2008) suggests that
human capital formation is directly
and positively linked to productiv-
ity and labour market participation.
Investment in education and training
leads to individual increasing returns
and generates positive spill-over
effects increasing the productivity of
co-workers
(26
). Strengthening human
capital and its formation may be
(26
) Endogenous growth models illustrate how
human capital accumulation increases the
growth rate (Lucas, 1988; Rebelo, 1991).
Christen et al. (2008) show that differences
in job performance between male and
female physicians were fully accounted for
by differences in their communication skills.
Dearden et al. (2006), using a dynamic
perspective on skills, show that training
which enhances skills is also associated with
higher productivity.
crucial to strengthen European firms’
comparative advantage on interna-
tional markets in the face of increased
global competition and the knowledge
economy, as developed in section 4.
However, investing in human capital
formation through education alone is
not enough. Appropriate skill-devel-
opment and skill-anticipation policies
and working conditions (i.e. ensuring
good skills matching and the best use
of the accumulated human capital)
are crucial.
There is a wide variation between
Member States in terms of their
efforts to strengthen skill develop-
ment. Denmark, Sweden and Fin-
land perform the best across all the
selected indicators (See participation
in life-long learning (Chart 8), on-the-
job training (Chart 9) and new learning
opportunities on the job (Eurofound,
EWCS 2010, question 49f)). The
lowest participation rates on life-
long learning are found in Bulgaria,
Romania, Croatia and Greece. Spain
and Italy perform poorly in terms of
on-the-job training. These countries
also show the poorest outcomes in
other indicators of skills develop-
ment
(27
). Bulgaria, Romania, Cyprus,
and Greece also rank the lowest of all
EU Member States of the OECD in the
latest PISA test (2012)
(28
). Note that
less effective training systems and an
inappropriate skill mix due to weak
training and skill-anticipation policies
can lead to lower productivity and
output and result in persistent labour
market structural problems (fragmen-
tation, polarisation).
The recent crisis has affected participa-
tion in life-long learning in around one
third of the Member States, but in dif-
ferent ways (Chart 8). Sweden, France,
Luxembourg and Portugal saw an
increase, while the United Kingdom and
Slovenia saw the highest declines (29
).
Employers may tend to increase train-
ing during a recession because training
costs, including opportunity costs (lost
productivity is less problematic when
demand is slack), are lower (e.g. Caponi
et al., 2010; Felstead et al., 2011). In
addition, difficult conditions may encour-
age employers to compete on quality
or to diversify their products, both of
which require increased training efforts
(e.g. Felstead et al., 2011). In contrast,
a crisis can make employers reluctant to
provide training if this is seen as a finan-
cial strain with an uncertain return on
(27
) Percentage of early school leavers (highest
shares are in Spain (23.5 %), Malta (21 %),
Portugal (19 %), Romania and Italy (17 %),
Bulgaria (13 %); percentage of population with
at least medium computer skills (lowest shares
are in Romania (21 %), Bulgaria (29 %), Greece
(41 %), and Italy (44 %). Data source: Eurostat,
tables [edat_lfse_14], [edat_lfse_08] and
under the link http://epp.eurostat.ec.europa.eu/
tgm/table.do?tab=tableinit=1plugin=1l
anguage=enpcode=tsdsc460. The data on
early school leavers refers to 2013, while data
on level of computer skills is from 2012, the
latest available at the time of drafting.
(28
) The Member States performing best on
the PISA test in 2012 are the Netherlands,
Finland, Belgium, Germany and two new
Member States (Estonia and Poland).
More information about the PISA results
is available at http://www.oecd.org/pisa/
keyfindings/pisa-2012-results-overview.pdf
(29
) Based on data from the European Social
Survey of 19 countries over the period
2004–10, Dieckhoff (2010) found that
the odds of training in 2010 were 20 %
lower than in 2004, even after controlling
for a range of employee and workplace
characteristics. However, there were country
differences: there was no significant change
in the volume of training in any of the
Nordic countries, there was an increase in
two Continental countries, and there was
a decrease in the UK and Ireland and in
some of the Eastern European countries.](https://image.slidesharecdn.com/fd1af655-5d67-4954-a059-19619f458af7-150123121918-conversion-gate01/85/KE-BD-14-001-EN-N-144-320.jpg)
![143
Chapter 3: The future of work in Europe: job quality and work organisation for a smart, sustainable and inclusive growth
their investment (e.g. Dieckhoff, 2013;
Felstead et al., 2011; Majumdar, 2007).
The low-skilled, who are already dis-
advantaged in terms of obtaining a
job, also receive less life-long learning,
see Chart 10. The difference in partici-
pation rates between highly and lowly
educated people is the highest in Poland,
the Czech Republic, Greece, Cyprus and
Italy. It is the lowest in Denmark, Sweden,
Finland and the Netherlands.
3.3. Good working
conditions can attract
and develop human capital
and improve performance
and output
Good working conditions create the envi-
ronment to attract and develop human
capital and improve the performance of
workers. A physically safe and healthy
working environment leads to fewer
accidents and absences from work and,
hence, to lower costs (European Com-
mission, 2014; OECD, 2014; Cottini and
Lucifora, 2011; Lewis and Malecha,
2011). Furthermore, work-related stress
or negative social relations in the work-
place may lead to employees working
below their full potential, higher distrac-
tion levels or neglect of responsibilities,
and may affect career-related decisions
(Lewis and Malecha, 2011; Mather and
Lighthall, 2012). A working environment
too focussed on competition may also
generate unethical behaviour (Shleifer,
2004; Schwieren and Weichselbaumer,
2010; Gill et al., 2013; Charness et al.,
2013)
(30
).
The EMCO framework distinguishes four
sub-dimensions of working conditions
and organisation: health and safety at
work; work intensity; work autonomy; and
collective interest representation
(31
).
(30
) Work-related psychological disorders
and mental health problems were behind
42 % of all early retirements of white-
collar workers in Austria in 2009 and the
main reason for long-term sick leaves in
the Netherlands (55 days on average) in
2010 (European Commission 2014 — Social
Agenda 02/2014, p. 9). High psychological
job demands, long working hours and poor
physical environment are detrimental to
the mental and physical health of workers
(e.g. increasing obesity) and can influence
the health status of the worker’s family
(Morrissey et al., 2011; Cottini and Lucifora,
2011). Lewis and Malecha (2011) find that
negative social relations in the workplace
have detrimental effects on the productivity
of nurses. Mather and Lighthall (2012),
reviewing the literature on mental stress
and reward processing, find that overly
stressed employees are more likely to be
distracted and may neglect to adjust their
working habits after negative feedback from
their hierarchy. Halko et al. (2014), Shleifer
(2004), Schwieren and Weichselbaumer
(2010), and Gill et al. (2013) suggest that
competitive pressures at the workplace,
notably compensation-related, can lead
to greater risk-taking by men and lower
risk-taking by women (shyness to compete
for promotion and under-representation
in leading positions), and can increase
cheating, sabotage, corruption, excessive
executive pay and corporate earnings
manipulations with no or a negative effect
on productivity.
(31
) For the ‘working conditions’ dimension the
EMCO set of indicators relies mostly on
the EWCS questions. One should note that
while they relate to objective outcomes,
the indicators reflect people’s feelings
and perceptions about their working
environment. However, this adds valuable
information to the comprehensive picture
about the general labour market conditions.
Chart 10: Participation in LLL by educational attainment,
aged 25–64, 2013 — relative difference
0
2
4
6
8
10
12
14
SK*LT*HR*BG*ELPLCYITCZMTSIROATHUPTEEESLVEU-28DEBEFRIEUKLUFINLSEDK
High to medium High to low
%
Source: Eurostat LFS, table [trng_lfs_10].
Notes: Lifelong learning (LLL) measures participation rate in education and training (last 4 weeks).
The Chart shows the relative difference in the life-long learning participation rates between those
with high education and those with medium, respectively low, education. It reflects the situation of the
population (aged 25–64) engaged in formal or non-formal education and training. ‘Low’ stands for pre-
primary, primary and lower secondary education corresponding to levels 0–2 (ISCED 1997); ‘medium’
stands for upper secondary non-tertiary education corresponding to levels 3–4; and ‘high’ corresponds
to levels 5–6. * No data for ‘low’ education for 2013.
3.3.1. Reducing health
and safety risks may increase
overall productivity
Health and safety at work can have
a direct impact on employers’ costs and
employees’ productivity, absenteeism
and job satisfaction. While the incidence
of work accidents has declined in recent
years, significant differences across dif-
ferent groups of workers can be observed.
Chart 11 shows the relative accident rate
of those with medium (alternatively high)
education to those with low education. It
can be seen that the lower the education
level, the higher the accident rate. More
generally, those with lower levels of edu-
cation are more often in jobs that present
greater risks in terms of health and safety
conditions at work
(32
).
Note that important structural changes
will likely bring along new products and
production processes with potentially
unknown health and safety risks which
may need to be borne in mind, as dis-
cussed in section 4.
3.3.2. Combining work
autonomy with work intensity
can increase productivity
Work intensity
(33
) and work autonomy
are two important characteristics of work
organisation that can affect workers’
performance through their impact on the
level of motivation, stress and physical
and mental health. They can also impact
the labour market participation decisions
of particular groups such as older workers,
second earners with children and/or peo-
ple with disabilities. By reinforcing posi-
tive interactions between work intensity
and work autonomy, an organisation can
achieve greater effort from its employees,
thus increasing productivity and output.
(32
) The Chart refers only to accidents rate, while in
many jobs work-related health and safety risks
are much broader, including respiratory diseases,
skin conditions, musculoskeletal disorders, etc.
(33
) Note that in this subsection ‘work intensity’
is used in line with the sociological literature
in the sense of a characteristic of work
organisation, rather than in the most narrow
sense used by Eurostat (the indicator
persons living in households with low
work intensity is defined as the number of
persons living in a household having a work
intensity below a threshold set at 0.20). The
work intensity of a household is the ratio of
the total number of months that all working-
age household members have worked during
the income reference year and the total
number of months the same household
members theoretically could have worked in
the same period. More details at http://epp.
eurostat.ec.europa.eu/statistics_explained/
index.php/Glossary:Persons_living_in_
households_with_low_work_intensity.](https://image.slidesharecdn.com/fd1af655-5d67-4954-a059-19619f458af7-150123121918-conversion-gate01/85/KE-BD-14-001-EN-N-145-320.jpg)
![144
Employment and Social Developments in Europe 2014
Chart 11: Relative rate of accidents at work by skill level
(relative to the low-skilled), in pps
-6
-5
-4
-3
-2
-1
0
1
LUSICYFRATFIMTLVCZPTNLEEBEROITDKESELEU-27SESKIEPLHRUKDELTHUBG
Medium High
Source: Eurostat ESAW 2009, table [hsw_ac1]. ‘Low’ stands for pre-primary, primary and lower
secondary education corresponding to levels 0–2 (ISCED 1997); ’medium’ stands for upper secondary
non-tertiary education corresponding to levels 3–4; and ‘high’ for levels 5–6.
Chart 12: High speed at work and stress based on Eurofound data
0 0.1 0.2 0.3 0.4 0.5 0.6 0.7 0.8
0
0.1
0.2
0.3
0.4
0.5
0.6
Not working at very high speed, q45a
Notexperiencingstressatwork,q51n
AT
BE
BG
CY CZ
DE
DK EE
EL
ES
EU-27
FI
FR
HU
IE
IT
LT
LU
LV
MT
NL PL
PT
RO
SE
SI
SK UK
Correlation = 0.5***
Source: Eurofound, EWCS 2010, question 45a and 51n.
In general, work intensity does not need
to have a negative connotation. Argu-
ments emphasising the negative effects
of work intensity on employees’ well-
being focus on “constrained” work inten-
sity, where employees have little choice
about the effort they put into their work.
Higher work intensity may be a result of
organisational policies, such as man-
agement strategies, supervisory pres-
sures or machine pacing, but may also
reflect individuals’ choice (e.g. Gallie
and Zhou, 2013). Some degree of work
intensity is an inherent part of creative
effort, providing a challenge that ena-
bles people to develop their skills (Gallie
and Zhou, 2013).
Empirical research indicates that
the combination of high work inten-
sity and low job autonomy increases
work stress and can severely impact
employees’ physical and mental health.
Excessive workloads and unclear or
conflicting demands on the job-holder,
combined with the lack of role clarity,
lack of involvement in decision-making,
lack of influence over the job design,
poorly managed organisational change
and job insecurity, lead to psychosocial
risks and physical and mental ill health,
in particular depression, burnout and
cardiovascular diseases, and therefore
lower productivity and output (Kar-
asek and Theorell, 1990; Theorell and
Karasek, 1996; Marmot, 2004; Theorell,
2007; European Commission, 2014d;
OECD, 2014).
As Chart 12 shows, according to the
Eurofound EWCS (2010), in some
Member States (Bulgaria, Poland, Lat-
via and Lithuania) people appear not
to experience stress and do not work
at high speed nor to tight deadlines.
In contrast, in Sweden, Germany, Aus-
tria, Greece and Cyprus people work
at very high speed, to tight deadlines
and under stress. However, the level of
self-responsibility is also much higher in
the Nordic countries. Note, though, that
measuring exposure to stress across the
EU is not straightforward, since workers’
perception of stress may be affected by
cultural differences, their understanding
of the notion of stress or their propen-
sity towards admitting to stress.
Chart 13 links the three dimensions
of working conditions: work intensity,
work autonomy and the level of job
stress. The Chart shows that there are
two groups of countries that are char-
acterised by a low level of stress: one
where job control and work intensity
are low (e.g. Bulgaria and Lithuania);
and one where the ‘demands’ of the
job are high but are compensated
by a high level of self-responsibility
(e.g. the Netherlands and Denmark).
High levels of stress are experienced
in Germany, Cyprus and Austria, where
the ‘demands’ are among the highest
but levels of self-responsibility are
relatively low
(34
). Unsurprisingly, there
are no countries with high autonomy
and low ‘demands’.
(34
) Sweden represents an exception: even
though it is in the yellow circle, stress is
perceived to be high in Sweden regardless of
the high level of job autonomy. However, if
one looks at the separate indicators behind
the composite factor of self-responsibility,
one can see that the control over the
speed of own work (EWCS question 50c)
is remarkably low, the third lowest in the
Union. This may convey the impression of
time pressure and explain the registered
high levels of stress in the country.](https://image.slidesharecdn.com/fd1af655-5d67-4954-a059-19619f458af7-150123121918-conversion-gate01/85/KE-BD-14-001-EN-N-146-320.jpg)
![145
Chapter 3: The future of work in Europe: job quality and work organisation for a smart, sustainable and inclusive growth
Chart 13: Work intensity, autonomy and stress
-2 -1 0 1 2 3
0.20
0.25
0.30
0.35
0.40
0.45
0.50
0.55
0.60
0.65
Factor self-responsibility
Notworkingtotightdeadlines,q45b
AT
BE
BG
CY
CZ
DE
DK
EE
EL
ES
FI
FR
HU
IE
IT
LT
LU
LV
MT
NL
PL
PT
RO
SESI
SK
UK
Correlation = -0.4
L
O
W
W
I
H
I
G
H
Source: DG EMPL calculations based on the Eurofound EWCS 2010, question 45b. For explanation
of the factor “self-responsibility” and the underlying questions from the EWCS, see the source , see the
source of Chart 16. The colours of the circles show the degree of work stress (based on question 51n):
dark blue — low; light blue — high; and gray— about the average.
Box 2: Stress, happiness and productivity
In 2014, stress was the second most-reported work-related health problem in
the EU. A 2013 European opinion poll conducted by EU-OSHA
(35
) found that more
than half of all workers considered work-related stress to be common in their
workplace. The most common causes of work-related stress are job reorganisation
or job insecurity (72 %), hours worked or workload (66 %), being subject to unac-
ceptable behaviour such as bullying or harassment (59 %), lack of support from
colleagues or superiors (57 %), lack of clarity on roles or responsibilities (52 %),
and limited possibility of managing one’s work patterns (46 %) (European Com-
mission, 2014d). In the Enterprise Survey on New and Emerging Risks (2010)
(36
),
around 8 in 10 European managers expressed concern about work-related stress
in their workplaces, though less than 30 % admitted having implemented policies
to deal with its risks. Between 50 % and 60 % of all lost working days are related
to stress and psychosocial risks.
The question of whether happiness makes people more productive occupies
economists, behavioural scientists and policy makers. The well-being of employ-
ees concerns many company managers. For example, “At Google, we know that
health, family and wellbeing are an important aspect of Googlers’ lives. We have
also noticed that employees who are happy demonstrate increased motivation
...[We] ...work to ensure that Google is ...an emotionally healthy place to work”
(Lara Harding, People Programs Manager, Google). Several studies show the link
between positive mood and productivity (Oswald et al., 2014)
(37
), between well-
being and motivation and higher capacity to solve anagrams (Erez and Isen, 2002),
and between job satisfaction and value added per hours worked in manufacturing
(Boeckerman and Ilmakunnas, 2012).
(35
) See reports in figures at https://osha.europa.eu/en/safety-health-in-figures.
(36
) Results and publications available at https://osha.europa.eu/en/esener-enterprise-survey.
(37
) Oswald et al. (2014) set up three short (five-minute) GMAT-style maths experiments on more
than 700 individuals whose mood was measured and then manipulated with video clips, snacks
and drinks. The measurements took into account negative real-life events in the previous five
years (e.g. bereavement and family illness). The study concluded that those made happier
had productivity gains of 12 %, while individuals who suffered a major real-life shock in the
preceding five years showed lower productivity.
3.3.3. Job autonomy
can boost productivity
Job control or autonomy
(38
) is a core fac-
tor in determining the quality of work.
Several studies report that workers who
are free to make choices in the workplace
and are accountable for their decisions
are happier, more committed, put more
effort into their work, and are therefore
more productive and show a lower ten-
dency to quit their job (Chirkov et al.,
2011 for a review; Mahdi et al., 2012;
Gellatly and Irving, 2001; Langfred and
Moye, 2004). This is especially the case
when the work is complex or requires
more creativity, though in a very routine
job, autonomy can still increase satisfac-
tion and reduce turnover (DeCarlo and
Agarwal, 1999; Finn, 2001; Liu et al.,
2005; Nguyen et al., 2003; Thompson
and Prottas, 2005). Job autonomy has
also been seen as an important factor in
moderating the impact of work intensity
(Liu et al., 2005).
Chart 14, Chart 15 and Chart 16, based
on the Eurofound EWCS (2010), show
that job autonomy is the highest in Swe-
den, Denmark, Finland and the Nether-
lands. It is the lowest in Cyprus, Greece,
Portugal and Bulgaria. Germany and Aus-
tria score among the lowest on the per-
ceptions of the level of self-responsibility
(Chart 16)
(39
). Gallie and Zhou (2013),
using European Social Survey data
(40
),
report similar country patterns that are
stable over time. The authors explain this
stability over time with the fact that job
autonomy is embedded in wider institu-
tional structures. In some countries, job
autonomy and control have been embed-
ded for many years at company as well
as national level institutions.
(38
) Job autonomy can take different forms
depending on the country context and the
organisational culture. Organisations may
let employees set their own schedules or
choose how and where to do their work.
(39
) Germany scores low in terms of control over
the speed of own work (EWCS question 50c),
order of tasks (50a), employee consultation
on targets (51c), ability to apply own ideas
(51i) and employee involvement in improving
work organisation (51d). Austria scores
low in terms of control over speed of work,
ability to apply own ideas and involvement
in improvements of work processes.
(40
) There are three items in the ESS that provide
a measure of job control: how much ‘the
management at your work allows you (a) to
decide how your own daily work is organised;
(b) to influence policy decisions about the
activities of the organisation; and (c) to
choose or change your pace of work’. The
items then cover not only immediate control
over the work task (task discretion), but also
people’s perceptions of wider influence over
organisational decisions.](https://image.slidesharecdn.com/fd1af655-5d67-4954-a059-19619f458af7-150123121918-conversion-gate01/85/KE-BD-14-001-EN-N-147-320.jpg)
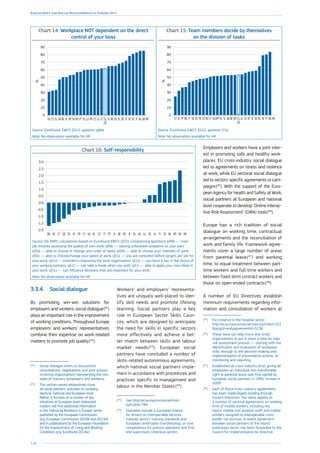
![147
Chapter 3: The future of work in Europe: job quality and work organisation for a smart, sustainable and inclusive growth
company level
(49
). A recent fitness
check of these directives
(50
) found that
information and consultation of work-
ers at company level can contribute
to solving problems at work, engage
workers in changes in work organisa-
tion and work conditions, appease con-
flicts, promote trust and partnership,
increase job satisfaction and commit-
ment, reduce the rate at which workers
leave the company, and improve the
physical health and well-being of work-
ers. It was also found that information
and consultation has a positive impact
on staff performance and on the com-
pany’s competitiveness and reputation.
Finally, setting wages is one of the key
functions of industrial relations systems
in the EU. Despite a tendency for the
company level and individual bargaining
to gain importance, multi-employer bar-
gaining remains important in many Euro-
pean countries. Beyond the main level
of bargaining, it is important to consider
coordination of different processes, both
vertically (between different levels) and
horizontally (between units at a given
level, e.g. between companies).
While the promotion of dialogue
between management and labour is an
objective of the European Union (Article
151 TFEU), there is no single model of
social dialogue in the EU. Across Europe,
there exists a large diversity of national
industrial relations systems, which the
Union has to take into account when
promoting social dialogue at its level
(Article 152 TFEU). Industrial relations
should be considered as complex sys-
tems whose institutions interlock, which
cannot be measured along a single
dimension or in a single statistic. There
are different qualities, each with dif-
ferent effects on the regulation of the
economy and the labour market. In
whichever form, social dialogue makes
an important contribution to job qual-
ity, both directly as a key dimension of
a ‘good job’ and through its positive
impact on working conditions.
(49
) In particular, Directives 98/59/EC
on collective redundancies,
2001/23/EC on transfers of undertakings
and 2002/14/EC on a general framework
relating to information and consultation of
workers.
(50
) The results of the fitness check were
published on 26 July 2013 in a Commission
Staff Working Document available at
http://ec.europa.eu/social/main.jsp?langId=
encatId=707newsId=1942furtherNe
ws=yes
Chart 17: Inactivity due to family responsibilities,
2007–13 (% of total inactive population)
FRMTIECYESUKLUEEATPLITSKELCZBGROEU-28DELVHRHUBEFIPTNLLTSISEDK
0
5
10
15
20
25
30
35
40
45
20132007
%Source: Eurostat LFS, table [lfsa_igar].
Note: No observation available for FR in 2013.
Chart 18: The proportion of children who are not in formal
childcare 3 years old, 2012 (% of the population under 3 years old)
0
20
40
60
80
100
ROPLSKCZBGHULTMTATHRLVELEEIECYDEFIITEU-28UKPTSIBEESLUFRSENLDK
%
Source: Eurostat SILC, table [ilc_caindformal].
3.4. Work-life and gender
balance to strengthen
participation, efficiency
and equity
3.4.1. Work-life balance
Insufficient opportunities
(51
) for com-
bining work with other private and social
responsibilities may lead to higher inac-
tivity rates among certain groups of the
population (e.g. older people, persons
with family responsibilities), with poten-
tial consequences in terms of social
exclusion and greater dependence on
social protection systems.
(51
) For example, availability of easily accessible
and affordable childcare facilities, voluntary
part-time work patterns, parental leave,
adaptations for older workers or workers
with disabilities, etc.
The inactivity rate due to family respon-
sibilities is the highest in Malta, Cyprus,
Spain and Ireland (Chart 17), followed
by Luxembourg and the United King-
dom. It has decreased over time in
Spain, Cyprus, and Greece though. In
the United Kingdom, supply of child-
care facilities is around the EU aver-
age (Chart 18) but childcare costs are
high
(52
). In contrast, Denmark, Sweden,
France, Estonia, the Netherlands and
Portugal have some of the lowest inac-
tivity rates due to family responsibilities
(Chart 17), as well as more readily avail-
able childcare facilities (Chart 18) and
at an affordable cost.
(52
) The 2013 Northern Ireland Childcare
Cost survey (Dennison, 2013) shows that
a full-time childcare place (50 hours) costs
GBP 213 per week in Britain. In Northern
Ireland, childcare costs are also high, and
increased to GBP 158 per week in 2013.
Moreover, 35 % of the nurseries in Ireland
charge the same price or even higher for
a part-time place than for a full-time one.](https://image.slidesharecdn.com/fd1af655-5d67-4954-a059-19619f458af7-150123121918-conversion-gate01/85/KE-BD-14-001-EN-N-149-320.jpg)