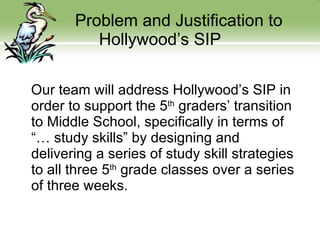
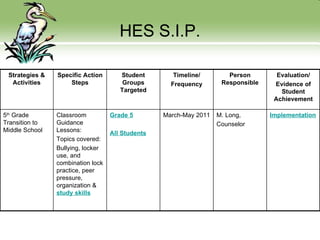
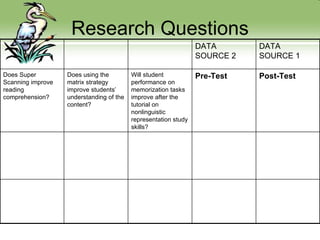
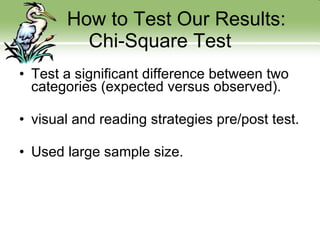
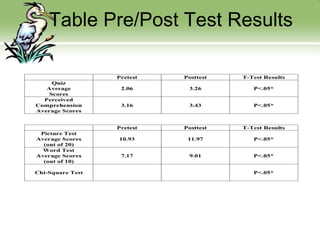
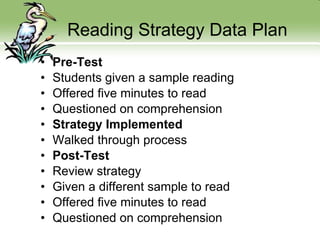
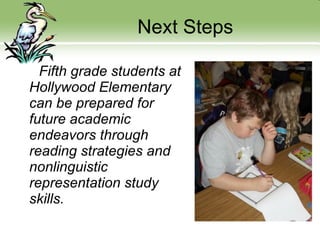
Hollywood Elementary School Collaborative Action Research Project Harmony Biscoe Amanda Kerby Laurel Matthew Donald Redmiles Elizabeth Vicini
Problem and Justification to Hollywood’s SIP Our team will address Hollywood’s SIP in order to support the 5 th  graders’ transition to Middle School, specifically in terms of “… study skills” by designing and delivering a series of study skill strategies to all three 5 th  grade classes over a series of three weeks.
HES S.I.P. Strategies & Activities Specific Action Steps Student Groups Targeted Timeline/ Frequency Person Responsible Evaluation/ Evidence of Student Achievement 5 th  Grade Transition to Middle School Classroom Guidance Lessons: Topics covered: Bullying, locker use, and combination lock practice, peer pressure, organization &  study skills Grade 5 All Students March-May 2011 M. Long,  Counselor Implementation
Research Questions DATA SOURCE 2 DATA SOURCE 1 Does Super Scanning improve reading comprehension? Does using the matrix strategy improve students’ understanding of the content? Will student performance on memorization tasks improve after the tutorial on nonlinguistic representation study skills? Pre-Test Post-Test
How to Test Our Results: Chi-Square Test Test a significant difference between two categories (expected versus observed). visual and reading strategies pre/post test. Used large sample size.
Table Pre/Post Test Results
Reading Strategy Data Plan Pre-Test Students given a sample reading  Offered five minutes to read  Questioned on comprehension Strategy Implemented Walked through process Post-Test Review strategy Given a different sample to read Offered five minutes to read Questioned on comprehension
Reading Strategy “… text comprehension strategies are needed to enhance "reading to learn" skills .” (Reed, Marchand-Martella & Koltz, 2007)  Prepare  Restructure Physical Context Restructure Socially and Emotionally (Zimmerman, 2002) State Super Scan Read  Review (Reed, J., Marchand-Martella, N., Martella, R., & Kolts,R, 2007) (Zimmerman, 2002)
Qualitative Analysis    Methods and Interpretation Students appeared comfortable with the strategy Expressed interest in continuing to utilize the strategy Asked for a copy of the strategy steps to be distributed
Reading Strategies Results Average Scores on Quiz (out of 4) Pretest = 2.06 Posttest = 3.26 T-Test Results = 2.74xE-7 (significant results P<.05 ) Perceived Comprehension Average Scores Pretest = 3.16 Posttest = 3.43 T-Test Results = 0.035791(significant results P<.05)
The Visualization Tutorial Pre-Test (automatically advancing slideshow) Attitude survey Group of 20 pictures Write down as many as possible Repeat for group of 10 words Visualization Skills Lesson 2 techniques explained and demonstrated Tell a Silly Story and Walk Around Your House Repeating to recall Make connections.  Visualization
The Visualization Tutorial Following the lesson, students were given a new group of pictures to practice with. Sharing strategies or stories was provided. Post-Test (administered the following day in a manner identical to Pre-Test, with a different set of 20 pictures and 10 words)
The Visualization Test 10 Words 1) Crust 6) Rocks 2) Plate 7) Core 3) Mantle 8) Syrup 4) Dirt 9) Nickel 5) Fossil 10) Iron  20 Pictures
Qualitative Analysis,    Methods and Interpretation Students appeared attentive and engaged in slideshow Three minutes might have been too long a time period for answering; too much wait time for students to sit through Students were attentive when I demonstrated the silly stories Most students were eager to share their own stories at the end of the lesson If a student didn’t recognize the image, I named it for the whole class; In retrospect, I probably should have identified every picture Spelling errors and mis-identification of pictures became a problem in grading tests
Visual Strategies Results Picture Pretest = 10.93 Picture Posttest = 11.97 T-Test = 0.0351 (significant results. P<.05) Word Pretest = 7.17 Word Posttest = 9.01 T-Test = 2.213xE-5 (significant results. P<.05) Chi-Square Test = 3.593xE-5 (significant results. P<.05)
Distractor Analysis There were no multiple choice questions. However, test design inadvertently left room for interpretation or error, which was taken into account during grading.
Matrix Note-Taking Strategy We decided to discontinue the note taking section of our CARP because of unforeseen time constraints. We did not realize that it would take students twenty or more minutes to read a two-three page selection and take notes on it.
Conclusion Chi-Square test/T-test was successful. Research questions answered:  Significant difference between super scanning and reading comprehension. Significant difference between memorization tasks and nonlinguistic representation study skills.  Limitations
Next Steps Fifth grade students at Hollywood Elementary can be prepared for future academic endeavors through reading strategies and nonlinguistic representation study skills.
Thank You

CARP

  • 1.
    Hollywood Elementary SchoolCollaborative Action Research Project Harmony Biscoe Amanda Kerby Laurel Matthew Donald Redmiles Elizabeth Vicini
  • 2.
    Problem and Justificationto Hollywood’s SIP Our team will address Hollywood’s SIP in order to support the 5 th graders’ transition to Middle School, specifically in terms of “… study skills” by designing and delivering a series of study skill strategies to all three 5 th grade classes over a series of three weeks.
  • 3.
    HES S.I.P. Strategies& Activities Specific Action Steps Student Groups Targeted Timeline/ Frequency Person Responsible Evaluation/ Evidence of Student Achievement 5 th Grade Transition to Middle School Classroom Guidance Lessons: Topics covered: Bullying, locker use, and combination lock practice, peer pressure, organization & study skills Grade 5 All Students March-May 2011 M. Long, Counselor Implementation
  • 4.
    Research Questions DATASOURCE 2 DATA SOURCE 1 Does Super Scanning improve reading comprehension? Does using the matrix strategy improve students’ understanding of the content? Will student performance on memorization tasks improve after the tutorial on nonlinguistic representation study skills? Pre-Test Post-Test
  • 5.
    How to TestOur Results: Chi-Square Test Test a significant difference between two categories (expected versus observed). visual and reading strategies pre/post test. Used large sample size.
  • 6.
  • 7.
    Reading Strategy DataPlan Pre-Test Students given a sample reading Offered five minutes to read Questioned on comprehension Strategy Implemented Walked through process Post-Test Review strategy Given a different sample to read Offered five minutes to read Questioned on comprehension
  • 8.
    Reading Strategy “…text comprehension strategies are needed to enhance &quot;reading to learn&quot; skills .” (Reed, Marchand-Martella & Koltz, 2007) Prepare Restructure Physical Context Restructure Socially and Emotionally (Zimmerman, 2002) State Super Scan Read Review (Reed, J., Marchand-Martella, N., Martella, R., & Kolts,R, 2007) (Zimmerman, 2002)
  • 9.
    Qualitative Analysis Methods and Interpretation Students appeared comfortable with the strategy Expressed interest in continuing to utilize the strategy Asked for a copy of the strategy steps to be distributed
  • 10.
    Reading Strategies ResultsAverage Scores on Quiz (out of 4) Pretest = 2.06 Posttest = 3.26 T-Test Results = 2.74xE-7 (significant results P<.05 ) Perceived Comprehension Average Scores Pretest = 3.16 Posttest = 3.43 T-Test Results = 0.035791(significant results P<.05)
  • 11.
    The Visualization TutorialPre-Test (automatically advancing slideshow) Attitude survey Group of 20 pictures Write down as many as possible Repeat for group of 10 words Visualization Skills Lesson 2 techniques explained and demonstrated Tell a Silly Story and Walk Around Your House Repeating to recall Make connections. Visualization
  • 12.
    The Visualization TutorialFollowing the lesson, students were given a new group of pictures to practice with. Sharing strategies or stories was provided. Post-Test (administered the following day in a manner identical to Pre-Test, with a different set of 20 pictures and 10 words)
  • 13.
    The Visualization Test10 Words 1) Crust 6) Rocks 2) Plate 7) Core 3) Mantle 8) Syrup 4) Dirt 9) Nickel 5) Fossil 10) Iron 20 Pictures
  • 14.
    Qualitative Analysis, Methods and Interpretation Students appeared attentive and engaged in slideshow Three minutes might have been too long a time period for answering; too much wait time for students to sit through Students were attentive when I demonstrated the silly stories Most students were eager to share their own stories at the end of the lesson If a student didn’t recognize the image, I named it for the whole class; In retrospect, I probably should have identified every picture Spelling errors and mis-identification of pictures became a problem in grading tests
  • 15.
    Visual Strategies ResultsPicture Pretest = 10.93 Picture Posttest = 11.97 T-Test = 0.0351 (significant results. P<.05) Word Pretest = 7.17 Word Posttest = 9.01 T-Test = 2.213xE-5 (significant results. P<.05) Chi-Square Test = 3.593xE-5 (significant results. P<.05)
  • 16.
    Distractor Analysis Therewere no multiple choice questions. However, test design inadvertently left room for interpretation or error, which was taken into account during grading.
  • 17.
    Matrix Note-Taking StrategyWe decided to discontinue the note taking section of our CARP because of unforeseen time constraints. We did not realize that it would take students twenty or more minutes to read a two-three page selection and take notes on it.
  • 18.
    Conclusion Chi-Square test/T-testwas successful. Research questions answered: Significant difference between super scanning and reading comprehension. Significant difference between memorization tasks and nonlinguistic representation study skills. Limitations
  • 19.
    Next Steps Fifthgrade students at Hollywood Elementary can be prepared for future academic endeavors through reading strategies and nonlinguistic representation study skills.
  • 20.