
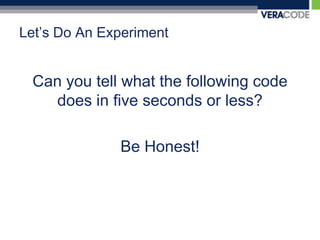
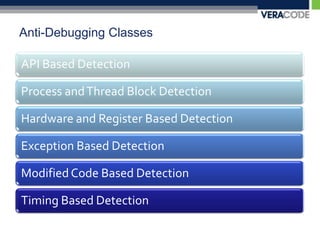
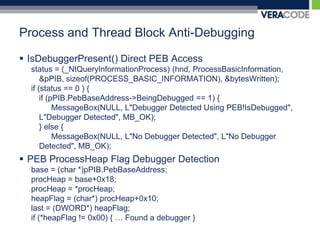
![Assembly Dumppush ebpmovebp, espsub esp, 0C0hpush ebxpush esipush edilea edi, [ebp+var_C0]movecx, 30hmoveax, 0CCCCCCCChrep stosdmovesi, espcall ds:__imp__IsDebuggerPresent@0cmpesi, espcall j___RTC_CheckEsptest eax, eaxjz short loc_411400movesi, esppush 0 ; uTypepush offset Caption push offset Text push 0 ; hWndcall ds:__imp__MessageBoxW@16 cmpesi, espcall j___RTC_CheckEspshort loc_41141Dloc_411400: ; CODE XREF: antidebug(void)+2Fjmovesi, esppush 0 ; uTypepush offset aNoDebuggerpush offset aNoDebuggerDetepush 0 ; hWndcall ds:__imp__MessageBoxW@16 cmpesi, espj___RTC_CheckEsploc_41141D: ; CODE XREF: antidebug(void)+4Ejpop edipop esipop ebxadd esp, 0C0hcmpebp, espcall j___RTC_CheckEspmovesp, ebppop ebpRetnantidebug@@YAXXZ endp](https://image.slidesharecdn.com/carolinacon-2009-antidebugging-dev-release-111004100206-phpapp02/85/CarolinaCon-2009-Anti-Debugging-7-320.jpg)

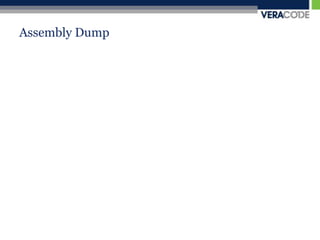
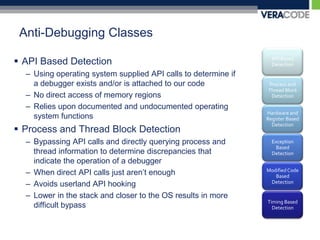
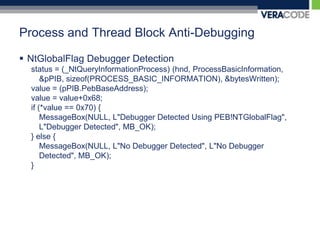
![Assembly Dump – Highlight Important Bitsvar_C0 = byte ptr -0C0hpush ebpmovebp, espsub esp, 0C0hPush ebxPush esiPush edilea edi, [ebp+var_C0]movecx, 30hmoveax, 0CCCCCCCChRep stosdmovesi, espCall ds:__imp__IsDebuggerPresent@0 cmpesi, espCall j___RTC_CheckEspTest eax, eaxjz short loc_411400movesi, esppush 0 ; uTypepush offset Caption push offset Text push 0 ; hWndcall ds:__imp__MessageBoxW@16cmpesi, espcall j___RTC_CheckEspjmp short loc_41141Dloc_411400: movesi, esppush 0 ; uTypepush offset aNoDebuggerpush offset aNoDebuggerDetepush 0 ; hWndcall ds:__imp__MessageBoxW@16cmpesi, espcall j___RTC_CheckEsploc_41141D: pop edipop esipop ebxadd esp, 0C0hcmpebp, espcall j___RTC_CheckEspmovesp, ebppop ebpRetn?antidebug@@YAXXZ endp](https://image.slidesharecdn.com/carolinacon-2009-antidebugging-dev-release-111004100206-phpapp02/85/CarolinaCon-2009-Anti-Debugging-9-320.jpg)
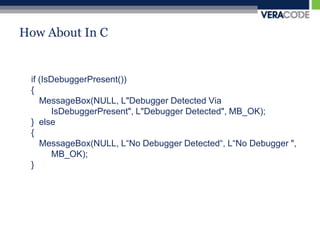


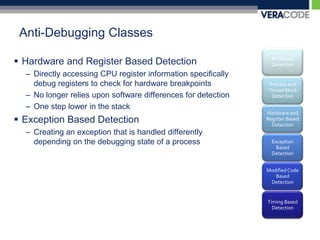
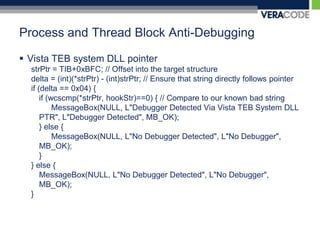
![Exception Anti-DebuggingSingle Step Detection (Trap Flag)__try { __asm { PUSHFD; //Saves the flag registers OR BYTE PTR[ESP+1], 1; // Sets the Trap Flag in EFlags POPFD; //Restore the flag registers NOP; // NOP }}__except (EXCEPTION_EXECUTE_HANDLER) { flag = 1;MessageBox(NULL, L"No Debugger Detected", L"No Debugger", MB_OK);}if (flag == 0) MessageBox(NULL, L"Debugger Detected Via Trap Flag", L"Debugger Detected", MB_OK);](https://image.slidesharecdn.com/carolinacon-2009-antidebugging-dev-release-111004100206-phpapp02/85/CarolinaCon-2009-Anti-Debugging-43-320.jpg)
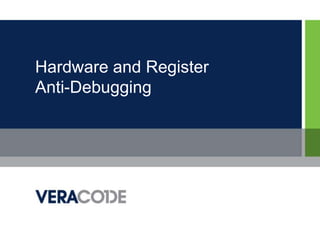
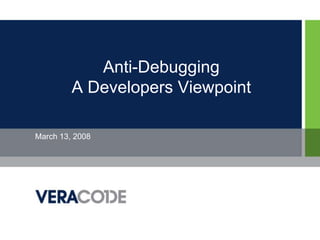
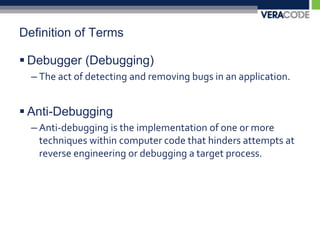
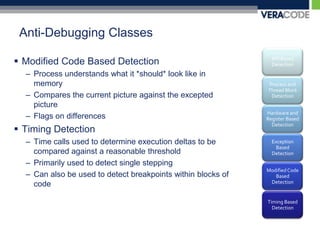
![Hardware Register Anti-DebuggingVmwaresldt detection__asm {sldtldt_info;}if ((ldt_info[0] != 0x00) && (ldt_info[1] != 0x00)) ldt_flag = 1;](https://image.slidesharecdn.com/carolinacon-2009-antidebugging-dev-release-111004100206-phpapp02/85/CarolinaCon-2009-Anti-Debugging-55-320.jpg)

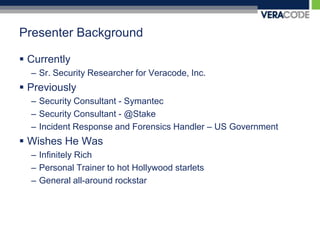
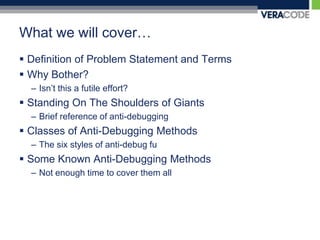
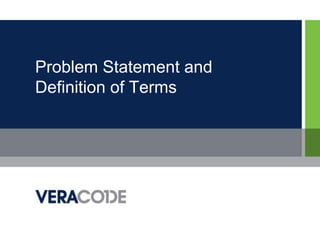
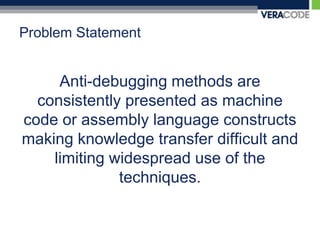
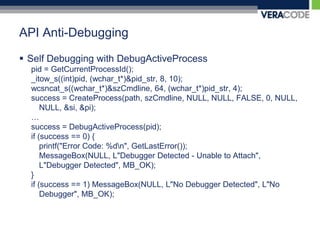
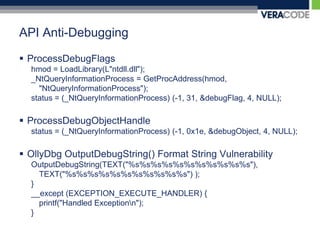
The document discusses various techniques for anti-debugging including API based detection, process and thread block detection, hardware and register based detection, exception based detection, and modified code based detection. It provides examples of API based anti-debugging methods like FindWindow, IsDebuggerPresent, CheckRemoteDebuggerPresent, OutputDebugString, NtQueryInformationProcess, and NtSetInformationThread. The purpose of anti-debugging is to protect intellectual property by making reversing software more difficult through detection and hindering of debuggers.