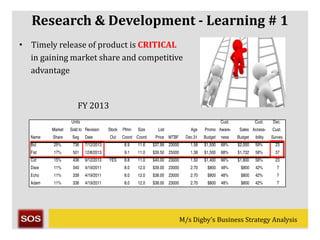
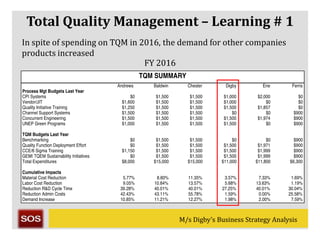
M/s Digby’s Business Strategy AnalysisBusiness Avenue, 4214,
Postal code 80.250-210 / Singapore
+65 3836 55 55
+65 9685 55 55| | www.SOS.com
M/s Digby’s Business Strategy
Analysis
M/s Digby’s Business Strategy AnalysisM/s Digby’s Business Strategy Analysis
Agenda
Digby Company Profile
Sensor Market in 2012
Current Scenario - 2016
Production – Learnings
Sales & Marketing – Learnings
Research & Development– Learnings
Finance – Learnings
TQM & HR– Learnings
M/s Digby’s Business Strategy AnalysisM/s Digby’s Business Strategy Analysis
Digby Company Profile
M/s Digby’s Business Strategy AnalysisM/s Digby’s Business Strategy Analysis
DIGBY
Research
& Devp
(R&D)
Production
Sales &
Marketing
Human
Resources
(HR)
Total
Quality
Mgmt
(TQM)
Finance
Sidd Ravishankar
Head – R&D
Varun Mahajan
Head – Production
Robin Agarwal
Head – Sales & Mktg
Shashank Shinde
Head – TQM & HR
Shirish Bansal
CEO & Head – Finance
M/s Digby’s Business Strategy AnalysisM/s Digby’s Business Strategy Analysis
Sensor Market in 2012
M/s Digby’s Business Strategy AnalysisM/s Digby’s Business Strategy Analysis
Sensor
Manufacturers in
Market
Market Share Market Cap
No. of
Products
Markets Served
Andrew 16.67 % $ 69M 5
Low, Trad, High,
Prmn, Size
Baldwin 16.67 % $ 69M 5
Low, Trad, High,
Prmn, Size
Chester 16.67 % $ 69M 5
Low, Trad, High,
Prmn, Size
Digby 16.67 % $ 69M 5
Low, Trad, High,
Prmn, Size
Erie 16.67 % $ 69M 5
Low, Trad, High,
Prmn, Size
Ferris 16.67 % $ 69M 5
Low, Trad, High,
Prmn, Size
Market Scenario - 2012
M/s Digby’s Business Strategy AnalysisM/s Digby’s Business Strategy Analysis
Current Scenario - 2016
M/s Digby’s Business Strategy AnalysisM/s Digby’s Business Strategy Analysis
Andrews
14%
Baldwin
15%
Chester
20%Digby
13%
Erie
15%
Ferris
23%
Market ShareFinancial Statistics
Sales Breakup
34.25
26.15
14.48
30.88
12.12
0
5
10
15
20
25
30
35
40
2010 2012 2014 2016 2018
Share Price
Shar…
M/s Digby’s Business Strategy AnalysisM/s Digby’s Business Strategy Analysis
• DazeTraditional Segment
• DellLow Segment
• DaveHigh Segment
• DotPerformance Segment
• DuneSize Segment
Digby Products
M/s Digby’s Business Strategy AnalysisM/s Digby’s Business Strategy Analysis
Production – Learnings
M/s Digby’s Business Strategy AnalysisM/s Digby’s Business Strategy Analysis
Mr. Varun Mahajan
Production Head
“We are looking at maximum
market share after 4 years
and we shall go full steam to
increase capacity in the
initial years.”
“Hopefully we shall be able to
take advantage of a growing
market !”
M/s Digby’s Business Strategy AnalysisM/s Digby’s Business Strategy Analysis
FY 2012
FY 2013
Production - Learning # 1
Capacity should be increased only considering short term market growth
and not long term market growth as it also carries depreciation cost
Add fixed capacity in small increments as the demand grows !
M/s Digby’s Business Strategy AnalysisM/s Digby’s Business Strategy Analysis
Production - Learning # 1
All other players sold off capacity and hence had more cash at hand for
investments.
FY 2013
M/s Digby’s Business Strategy AnalysisM/s Digby’s Business Strategy Analysis
FY 2013
Production - Learning # 2
• Conservative approach followed in selling off excess capacity
FY 2014
Correct your errors in the first shot !
M/s Digby’s Business Strategy AnalysisM/s Digby’s Business Strategy Analysis
Production - Learning # 3
Due to cash crunch owing to excess spending on increasing
capacity, Digby fell short of cash to Automate their plants resulting in
lower contribution margin and higher costs in years to come
FY 2012
FY 2013
Cost control is extremely important !
M/s Digby’s Business Strategy AnalysisM/s Digby’s Business Strategy Analysis
Production - Learning # 4
Poor Plant Utilization
• Ideal plant utilization
- 198% of the plant capacity
• Digby’s Plant utilization
level was 72% in 2013 and
increased to 160% in 2016
• This showed Digby’s over spending on plant expansion in the first
years resulted in poor Asset Turnover Ratio
0%
20%
40%
60%
80%
100%
120%
140%
160%
180%
200%
2013 2014 2015 2016
Optimum Capacity
Utilization
Industry Average
Utilization
Digby Average
Utilization
M/s Digby’s Business Strategy AnalysisM/s Digby’s Business Strategy Analysis
Production - Learning # 5
Poor Forecasting led to unsold inventory. Tradeoff between Stock Out
and Inventory carrying cost was not calculated
FY 2013
M/s Digby’s Business Strategy AnalysisM/s Digby’s Business Strategy Analysis
Poor Forecasting led to unmet market demand as all companies had
stock out
Production - Learning # 6
FY 2015
Market Demand > 1.8
Total Capacity
M/s Digby’s Business Strategy AnalysisM/s Digby’s Business Strategy Analysis
Sales & Marketing –
Learnings
M/s Digby’s Business Strategy AnalysisM/s Digby’s Business Strategy Analysis
Sales & Marketing - Learning # 1
Higher Customer visibility comes at a
price !
100% Customer
Awareness & 100%
Accessibility
75% Customer
Awareness & 75%
Accessibility
Less than 50% Customer
Awareness & Less than
50% Accessibility
M/s Digby’s Business Strategy AnalysisM/s Digby’s Business Strategy Analysis
Sales & Marketing - Learning # 2
• The product with a higher Customer Survey Score (CSS) tends to
outsell the others which have a lower CSS
CSS
Promotion
Budget
AR Policy
Customer
Buying
Criteria
Sales
Budget
M/s Digby’s Business Strategy AnalysisM/s Digby’s Business Strategy Analysis
• Pricing needs to be done carefully within a band that attracts the
customer
• Market will not accept your product if it is priced beyond a certain limit
Sales & Marketing - Learning # 3
FY 2015
M/s Digby’s Business Strategy AnalysisM/s Digby’s Business Strategy Analysis
Research & Development
– Learnings
M/s Digby’s Business Strategy AnalysisM/s Digby’s Business Strategy Analysis
Research & Development - Learning # 1
• Timely release of product is CRITICAL
in gaining market share and competitive
advantage
FY 2013
M/s Digby’s Business Strategy AnalysisM/s Digby’s Business Strategy Analysis
Research & Development - Learning # 2
• Product positioning must be as per
the needs/wants of the target segment
FY 2013
M/s Digby’s Business Strategy AnalysisM/s Digby’s Business Strategy Analysis
Research & Development - Learning # 3
• Failed product transitioning in Dixie
• No R&D was conducted on Dixie
under the expectation that it would
drift into the Traditional market
segment
• It ended up as an abandoned product
which was a misfit everywhere
Product Transitioning needs to be
PLANNED in advance
M/s Digby’s Business Strategy AnalysisM/s Digby’s Business Strategy Analysis
Research & Development - Learning # 4
• R&D time depends on R&D being
conducted on various products
simultaneously
• Continuous improvements should be
done on products every year
FY 2016
M/s Digby’s Business Strategy AnalysisM/s Digby’s Business Strategy Analysis
Finance – Learnings
M/s Digby’s Business Strategy AnalysisM/s Digby’s Business Strategy Analysis
Finance - Learning # 1
• Higher the Cash at hand, Lower is
the Risk to the organization!
• Poor prediction of cash at hand
resulted in an Emergency Loan to
Digby and Andrews
Finance should not drive business, business should drive finance!
- Prof Manish Agarwal
However, business should also hear out Finance..
M/s Digby’s Business Strategy AnalysisM/s Digby’s Business Strategy Analysis
Finance - Learning # 2
• Inventory Carrying Cost needs to
be looked at as poor sales results
in a high inventory carrying cost
• Also, inventory at hand results in a
conservative forecasting often
resulting in a STOCK OUT and lost
market potential in the following
year
M/s Digby’s Business Strategy AnalysisM/s Digby’s Business Strategy Analysis
Mr. Shirish Bansal
CEO & Finance Head
“We should follow our
tradition of issuing dividends
to our shareholders”
“I’m optimistic of an
increased market share and
increased stock price in the
coming year”
M/s Digby’s Business Strategy AnalysisM/s Digby’s Business Strategy Analysis
Finance - Learning # 3
• Digby paid 4 million as dividend and the same year Digby faced an
emergency loan of 4.9 million
• Digby should have reinvested to increase the value of the firm as it did
not have excess cash.
FY 2013
Customer is my CEO, who pays my salary; but I am not a Slave !
Mr. Boman Moradian
M/s Digby’s Business Strategy AnalysisM/s Digby’s Business Strategy Analysis
Finance - Learning # 4
• Debt/Equity ratio should always be
between 1.8 and 2.8
• If the ratio is high one should go for
equity and if the ratio is low one
should go for loan
• A company with a high D/E ratio is
seen as a risky company
Debt is not necessarily bad !
M/s Digby’s Business Strategy AnalysisM/s Digby’s Business Strategy Analysis
Finance - Learning # 5
• Long term loan should be used for
plant & equipment
purchase, capacity increase etc. for
long term use
• Current loan should be taken to
pay to suppliers or for short term
use
• Wrong selection will lead to
unnecessary interest
Debt should be taken according to
requirement
M/s Digby’s Business Strategy AnalysisM/s Digby’s Business Strategy Analysis
TQM & HR – Learning’s
M/s Digby’s Business Strategy AnalysisM/s Digby’s Business Strategy Analysis
Human Resource – Learning # 1
Productivity can be increased by:
• Continuous Manpower training
• Spending on recruiting to hire
high caliber workers
FY 2016
M/s Digby’s Business Strategy AnalysisM/s Digby’s Business Strategy Analysis
Total Quality Management – Learning # 1
No money spent on TQM initiatives in round 3 whereas the competitors
in the industry invested heavily
FY 2015
M/s Digby’s Business Strategy AnalysisM/s Digby’s Business Strategy Analysis
Total Quality Management – Learning # 1
In spite of spending on TQM in 2016, the demand for other companies
products increased
FY 2016
M/s Digby’s Business Strategy AnalysisM/s Digby’s Business Strategy Analysis
#2.
#1.
M/s Digby’s Business Strategy AnalysisM/s Digby’s Business Strategy Analysis
#3.
#4.
M/s Digby’s Business Strategy AnalysisM/s Digby’s Business Strategy Analysis
#5.
#6.
M/s Digby’s Business Strategy AnalysisM/s Digby’s Business Strategy Analysis
Lets now go to the Boardroom
M/s Digby’s Business Strategy Analysis
Thank You
Team D – Industry C51962
- Shirish Bansal
- Siddharth Ravishankar
- Shashank Shinde
- Robin Agarwal
- Varun Mahajan

Capstone Business Simulation - Learnings

  • 1.
    M/s Digby’s BusinessStrategy AnalysisBusiness Avenue, 4214, Postal code 80.250-210 / Singapore +65 3836 55 55 +65 9685 55 55| | www.SOS.com M/s Digby’s Business Strategy Analysis
  • 2.
    M/s Digby’s BusinessStrategy AnalysisM/s Digby’s Business Strategy Analysis Agenda Digby Company Profile Sensor Market in 2012 Current Scenario - 2016 Production – Learnings Sales & Marketing – Learnings Research & Development– Learnings Finance – Learnings TQM & HR– Learnings
  • 3.
    M/s Digby’s BusinessStrategy AnalysisM/s Digby’s Business Strategy Analysis Digby Company Profile
  • 4.
    M/s Digby’s BusinessStrategy AnalysisM/s Digby’s Business Strategy Analysis DIGBY Research & Devp (R&D) Production Sales & Marketing Human Resources (HR) Total Quality Mgmt (TQM) Finance Sidd Ravishankar Head – R&D Varun Mahajan Head – Production Robin Agarwal Head – Sales & Mktg Shashank Shinde Head – TQM & HR Shirish Bansal CEO & Head – Finance
  • 5.
    M/s Digby’s BusinessStrategy AnalysisM/s Digby’s Business Strategy Analysis Sensor Market in 2012
  • 6.
    M/s Digby’s BusinessStrategy AnalysisM/s Digby’s Business Strategy Analysis Sensor Manufacturers in Market Market Share Market Cap No. of Products Markets Served Andrew 16.67 % $ 69M 5 Low, Trad, High, Prmn, Size Baldwin 16.67 % $ 69M 5 Low, Trad, High, Prmn, Size Chester 16.67 % $ 69M 5 Low, Trad, High, Prmn, Size Digby 16.67 % $ 69M 5 Low, Trad, High, Prmn, Size Erie 16.67 % $ 69M 5 Low, Trad, High, Prmn, Size Ferris 16.67 % $ 69M 5 Low, Trad, High, Prmn, Size Market Scenario - 2012
  • 7.
    M/s Digby’s BusinessStrategy AnalysisM/s Digby’s Business Strategy Analysis Current Scenario - 2016
  • 8.
    M/s Digby’s BusinessStrategy AnalysisM/s Digby’s Business Strategy Analysis Andrews 14% Baldwin 15% Chester 20%Digby 13% Erie 15% Ferris 23% Market ShareFinancial Statistics Sales Breakup 34.25 26.15 14.48 30.88 12.12 0 5 10 15 20 25 30 35 40 2010 2012 2014 2016 2018 Share Price Shar…
  • 9.
    M/s Digby’s BusinessStrategy AnalysisM/s Digby’s Business Strategy Analysis • DazeTraditional Segment • DellLow Segment • DaveHigh Segment • DotPerformance Segment • DuneSize Segment Digby Products
  • 10.
    M/s Digby’s BusinessStrategy AnalysisM/s Digby’s Business Strategy Analysis Production – Learnings
  • 11.
    M/s Digby’s BusinessStrategy AnalysisM/s Digby’s Business Strategy Analysis Mr. Varun Mahajan Production Head “We are looking at maximum market share after 4 years and we shall go full steam to increase capacity in the initial years.” “Hopefully we shall be able to take advantage of a growing market !”
  • 12.
    M/s Digby’s BusinessStrategy AnalysisM/s Digby’s Business Strategy Analysis FY 2012 FY 2013 Production - Learning # 1 Capacity should be increased only considering short term market growth and not long term market growth as it also carries depreciation cost Add fixed capacity in small increments as the demand grows !
  • 13.
    M/s Digby’s BusinessStrategy AnalysisM/s Digby’s Business Strategy Analysis Production - Learning # 1 All other players sold off capacity and hence had more cash at hand for investments. FY 2013
  • 14.
    M/s Digby’s BusinessStrategy AnalysisM/s Digby’s Business Strategy Analysis FY 2013 Production - Learning # 2 • Conservative approach followed in selling off excess capacity FY 2014 Correct your errors in the first shot !
  • 15.
    M/s Digby’s BusinessStrategy AnalysisM/s Digby’s Business Strategy Analysis Production - Learning # 3 Due to cash crunch owing to excess spending on increasing capacity, Digby fell short of cash to Automate their plants resulting in lower contribution margin and higher costs in years to come FY 2012 FY 2013 Cost control is extremely important !
  • 16.
    M/s Digby’s BusinessStrategy AnalysisM/s Digby’s Business Strategy Analysis Production - Learning # 4 Poor Plant Utilization • Ideal plant utilization - 198% of the plant capacity • Digby’s Plant utilization level was 72% in 2013 and increased to 160% in 2016 • This showed Digby’s over spending on plant expansion in the first years resulted in poor Asset Turnover Ratio 0% 20% 40% 60% 80% 100% 120% 140% 160% 180% 200% 2013 2014 2015 2016 Optimum Capacity Utilization Industry Average Utilization Digby Average Utilization
  • 17.
    M/s Digby’s BusinessStrategy AnalysisM/s Digby’s Business Strategy Analysis Production - Learning # 5 Poor Forecasting led to unsold inventory. Tradeoff between Stock Out and Inventory carrying cost was not calculated FY 2013
  • 18.
    M/s Digby’s BusinessStrategy AnalysisM/s Digby’s Business Strategy Analysis Poor Forecasting led to unmet market demand as all companies had stock out Production - Learning # 6 FY 2015 Market Demand > 1.8 Total Capacity
  • 19.
    M/s Digby’s BusinessStrategy AnalysisM/s Digby’s Business Strategy Analysis Sales & Marketing – Learnings
  • 20.
    M/s Digby’s BusinessStrategy AnalysisM/s Digby’s Business Strategy Analysis Sales & Marketing - Learning # 1 Higher Customer visibility comes at a price ! 100% Customer Awareness & 100% Accessibility 75% Customer Awareness & 75% Accessibility Less than 50% Customer Awareness & Less than 50% Accessibility
  • 21.
    M/s Digby’s BusinessStrategy AnalysisM/s Digby’s Business Strategy Analysis Sales & Marketing - Learning # 2 • The product with a higher Customer Survey Score (CSS) tends to outsell the others which have a lower CSS CSS Promotion Budget AR Policy Customer Buying Criteria Sales Budget
  • 22.
    M/s Digby’s BusinessStrategy AnalysisM/s Digby’s Business Strategy Analysis • Pricing needs to be done carefully within a band that attracts the customer • Market will not accept your product if it is priced beyond a certain limit Sales & Marketing - Learning # 3 FY 2015
  • 23.
    M/s Digby’s BusinessStrategy AnalysisM/s Digby’s Business Strategy Analysis Research & Development – Learnings
  • 24.
    M/s Digby’s BusinessStrategy AnalysisM/s Digby’s Business Strategy Analysis Research & Development - Learning # 1 • Timely release of product is CRITICAL in gaining market share and competitive advantage FY 2013
  • 25.
    M/s Digby’s BusinessStrategy AnalysisM/s Digby’s Business Strategy Analysis Research & Development - Learning # 2 • Product positioning must be as per the needs/wants of the target segment FY 2013
  • 26.
    M/s Digby’s BusinessStrategy AnalysisM/s Digby’s Business Strategy Analysis Research & Development - Learning # 3 • Failed product transitioning in Dixie • No R&D was conducted on Dixie under the expectation that it would drift into the Traditional market segment • It ended up as an abandoned product which was a misfit everywhere Product Transitioning needs to be PLANNED in advance
  • 27.
    M/s Digby’s BusinessStrategy AnalysisM/s Digby’s Business Strategy Analysis Research & Development - Learning # 4 • R&D time depends on R&D being conducted on various products simultaneously • Continuous improvements should be done on products every year FY 2016
  • 28.
    M/s Digby’s BusinessStrategy AnalysisM/s Digby’s Business Strategy Analysis Finance – Learnings
  • 29.
    M/s Digby’s BusinessStrategy AnalysisM/s Digby’s Business Strategy Analysis Finance - Learning # 1 • Higher the Cash at hand, Lower is the Risk to the organization! • Poor prediction of cash at hand resulted in an Emergency Loan to Digby and Andrews Finance should not drive business, business should drive finance! - Prof Manish Agarwal However, business should also hear out Finance..
  • 30.
    M/s Digby’s BusinessStrategy AnalysisM/s Digby’s Business Strategy Analysis Finance - Learning # 2 • Inventory Carrying Cost needs to be looked at as poor sales results in a high inventory carrying cost • Also, inventory at hand results in a conservative forecasting often resulting in a STOCK OUT and lost market potential in the following year
  • 31.
    M/s Digby’s BusinessStrategy AnalysisM/s Digby’s Business Strategy Analysis Mr. Shirish Bansal CEO & Finance Head “We should follow our tradition of issuing dividends to our shareholders” “I’m optimistic of an increased market share and increased stock price in the coming year”
  • 32.
    M/s Digby’s BusinessStrategy AnalysisM/s Digby’s Business Strategy Analysis Finance - Learning # 3 • Digby paid 4 million as dividend and the same year Digby faced an emergency loan of 4.9 million • Digby should have reinvested to increase the value of the firm as it did not have excess cash. FY 2013 Customer is my CEO, who pays my salary; but I am not a Slave ! Mr. Boman Moradian
  • 33.
    M/s Digby’s BusinessStrategy AnalysisM/s Digby’s Business Strategy Analysis Finance - Learning # 4 • Debt/Equity ratio should always be between 1.8 and 2.8 • If the ratio is high one should go for equity and if the ratio is low one should go for loan • A company with a high D/E ratio is seen as a risky company Debt is not necessarily bad !
  • 34.
    M/s Digby’s BusinessStrategy AnalysisM/s Digby’s Business Strategy Analysis Finance - Learning # 5 • Long term loan should be used for plant & equipment purchase, capacity increase etc. for long term use • Current loan should be taken to pay to suppliers or for short term use • Wrong selection will lead to unnecessary interest Debt should be taken according to requirement
  • 35.
    M/s Digby’s BusinessStrategy AnalysisM/s Digby’s Business Strategy Analysis TQM & HR – Learning’s
  • 36.
    M/s Digby’s BusinessStrategy AnalysisM/s Digby’s Business Strategy Analysis Human Resource – Learning # 1 Productivity can be increased by: • Continuous Manpower training • Spending on recruiting to hire high caliber workers FY 2016
  • 37.
    M/s Digby’s BusinessStrategy AnalysisM/s Digby’s Business Strategy Analysis Total Quality Management – Learning # 1 No money spent on TQM initiatives in round 3 whereas the competitors in the industry invested heavily FY 2015
  • 38.
    M/s Digby’s BusinessStrategy AnalysisM/s Digby’s Business Strategy Analysis Total Quality Management – Learning # 1 In spite of spending on TQM in 2016, the demand for other companies products increased FY 2016
  • 39.
    M/s Digby’s BusinessStrategy AnalysisM/s Digby’s Business Strategy Analysis #2. #1.
  • 40.
    M/s Digby’s BusinessStrategy AnalysisM/s Digby’s Business Strategy Analysis #3. #4.
  • 41.
    M/s Digby’s BusinessStrategy AnalysisM/s Digby’s Business Strategy Analysis #5. #6.
  • 42.
    M/s Digby’s BusinessStrategy AnalysisM/s Digby’s Business Strategy Analysis Lets now go to the Boardroom
  • 43.
    M/s Digby’s BusinessStrategy Analysis Thank You Team D – Industry C51962 - Shirish Bansal - Siddharth Ravishankar - Shashank Shinde - Robin Agarwal - Varun Mahajan