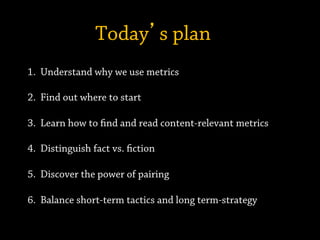
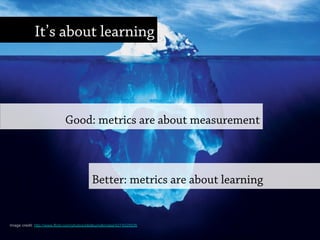
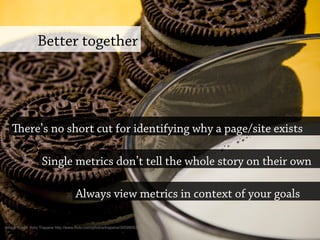
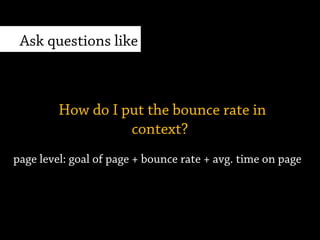
DATA DRIVEN
using Analytics insights
to drive effective content creation
welcome to
Yes. Hello.
Rebekah Cancino, Communication Strategist at Forty
So glad you’re here
Anna Hrach, Content Strategist at RIESTER
#DCSC@annabananahrach @rebekahcancino
So how does this
work?
#DCSC@annabananahrach @rebekahcancino
Today’s plan
1.  Understand why we use metrics
2.  Find out where to start
3.  Learn how to find and read content-relevant metrics
4.  Distinguish fact vs. fiction
5.  Discover the power of pairing
6.  Balance short-term tactics and long term-strategy
is year, the average
consumer will see or hear
1 million marketing
messages - that's almost
3,000 per day.
-
Why data?
#DCSC@annabananahrach @rebekahcancino
Content is not a
feature.
- Kristina Halvorson
Image credit: Bob Maske http://www.flickr.com/photos/audio1bob/320065808/
Data allows you track experiences
“Observe everything. Communicate well.”
Image credit: reurinkjan http://www.flickr.com/photos/reurinkjan/5505995483
Good: metrics are about measurement
Better: metrics are about learning
It’s about learning
Image credit: http://www.flickr.com/photos/e8albumdkmatai/4274025836
Discover opportunities
Content that’s working
How people find your site
Popular content
Image credit: Monte Mendoza http://www.flickr.com/photos/elmundodemontemendoza/8216522379/
Reveal problems
Content that isn’t working
Bad user experiences
Information architecture issues
Image credit: Daniel Schneider http://www.flickr.com/photos/rapturedmind/6544675195
Design smarter
Content
Information architecture
Navigation syntax and structure
Image credit: Brian Purkiss http://www.flickr.com/photos/brianpurkiss/1398732343/
Where to Start
#DCSC@annabananahrach @rebekahcancino
Start with what
What needs to be accomplished?
Image credit: Erik Daniel Drost http://www.flickr.com/photos/edrost88/7811696028/
Ask why?
Balance wants with needs
Image credit: Rick Munish http://rickmunish.deviantart.com/art/Justice-162068786
business
goals
reader
goals
content strategy gold
Get alignment
Take a look inside
Who are you writing for? What do they need?
Photo credit: Florin Gorgan
emotional
physicalcognitive
Right for the user
Personal-Behavioral Context: e New User Persona. © Daniel Eizans, 2010
DOING
Environmental, physical,
disabilities, preferences,
sensory stimuli
FEELING
Psychological state,
stress level, desires,
wants, needs
LEARNING
Cognitive assumptions,
learning ability,
education
Find and Read
Content-Relevant
Data
Analytics reveal a lot
You just have to know how to read them
Learn to love data
Meet user needs
Make your job easier
Accomplish business objectives
Image credit: Skinned Mink http://www.flickr.com/photos/21148821@N02/2055959594/
Construct your toolbox
Find the right tools for the job
Make sure platforms meet data analysis needs
Image credit: red11group http://www.flickr.com/photos/red11group/4870242163/
On-site search
Listen. Analyze. Understand. Improve.
Visitors telling you exactly what they need
Rewrite or add content to meet needs
Image credit: designerweb http://designerweb.deviantart.com/art/Stylish-Search-Bar-201157774
Google Analytics: let’s define our metrics
Image credit: Roel Willems http://www.flickr.com/photos/roelwillems/4461453799/
Feeling overwhelmed?
Begin at the top
Start with defining goals and key metrics
Drill your way down
Image credit: Nomadic Lass http://www.flickr.com/photos/nomadic_lass/6832118879/
Organic search?
Gauge content rankings and gaps
List of what your site is ranking for
(not provided)
Image credit:Mark Hofstetter http://commons.wikimedia.org/wiki/File:Avocado_Seedling.jpg
Bounce rate?
4 scenarios: back button, close browser, new URL, does nothing
% of people who never visit a second page
Determine content effectiveness & audience
Image credit: MichaelMaggs Edit by Richard Bartz"
Top content?
Understand why people come to your site
Identify most popular pages
Determine how to prioritize deeper content
Image credit:emiliokuffer http://www.flickr.com/photos/22298955@N08
Mobile users?
Evaluate layout, design and information delivery
Prioritize content
Recognize the need for responsive design
Image credit: DanielZanetti http://commons.wikimedia.org/wiki/File:Iphone_4G-2.jpg
Average time?
Understand average visit
Key difference: time on page vs. time on site
Image credit: mararie http://www.flickr.com/photos/32404172@N00
Fiction
vs.
Fact
#DCSC@annabananahrach @rebekahcancino
ere’s no shortcut for identifying
why a piece of content exists.
is is the first step to understanding
how to measure its performance.
Remember
Don t fall for it
More traffic=more money
e only metrics you need to measure myth
Industry standards
Engagement metrics
Image credit: Suburban Paparazzi http://www.flickr.com/photos/38549058@N03/3545848025/sizes/l/in/photostream
Seek the truth
Look for patterns
Pair metrics for real insight
Learn>measure
Image credit: Jacqueline ter Haar http://www.flickr.com/photos/jacquelineterhaar/3550688115/
Pop quiz!
#DCSC@annabananahrach @rebekahcancino
FALSE
Unique visitors = count of persistent
cookies dropped in a browser
Unique visitors represent real people?
FALSE
It doesn’t count time from bounced
visitors and last page in session.
Better to use page (vs. site) level data
for precise content segment
measurement.
Average visit duration is a precise
measure of how long visitors spend on
your site?
TRUE
Best practices are great, but nothing
beats analyzing Analytics against your
own site goals
ere’s no such thing as the most
important metrics for everyone or a
plug-and-play measurement strategy?
Content that drives a lot of traffic to
your site is very valuable?
IT DEPENDS
Not if it’s driving unqualified traffic
that doesn’t meet your business
objectives
Having a high bounce rate can negatively
impact your search result rankings?
FALSE
Google is smarter than your bounce
rate, a high bounce rate doesn’t
always mean a bad experience
e Power of
Pairing
#DCSC@annabananahrach @rebekahcancino
ere are three kinds of lies:
lies, damn lies,
and statistics."
- Mark Twain
Better together
ere’s no short cut for identifying why a page/site exists
Always view metrics in context of your goals
Image credit: Kory Trapane http://www.flickr.com/photos/trapane/3059905337
Single metrics don’t tell the whole story on their own
page level: goal of page + bounce rate + avg. time on page
How do I put the bounce rate in
context?
Ask questions, like
page level: unique visitors + page views + time on page
What content do visitors want more of?
Ask questions, like
page level: bounce rate + entrances
How can your content make a better
first impression?
Ask questions, like
site level: pages/visit + avg. visit duration
How can I tell if visitors are finding what
they need?
Ask questions, like
Photo credit: Usama Salehhttp: http://www.flickr.com/photos/stephencuyos/5430355182
Every metric needs a buddy
Ask questions. Formulate a hypothesis. Test. Repeat.
You formulate a hypothesis: Maybe our navigation is unclear?
Sample scenario
You see a high amount of page views per visit with a relatively low
avg. time on site, and you wonder: Are users having a hard time
finding what they need?
Which leads to an experiment: Let’s clarify the navigation syntax and
see if there’s an improvement.
ere’s no such thing as
“the most important
metrics to measure” or a
plug-and-play
measurement strategy.
Remember
Short-Term Tactics
and
Long-Term Strategies
e key to success is strategy
Photo credit: Loco s Photos
Get everyone talking again
Marry with user needs
Identify business objectives
Develop content that satisfies both
Photo credit: Ivan Walsh
Establish benchmarks and standards
Image credit: Bionic Teaching http://www.flickr.com/photos/bionicteaching/6986167357/
Track. Measure. Report. Refine. Rinse. Repeat.
Image credit: Louise Docker http://commons.wikimedia.org/wiki/File:TapeMeasure.jpg
Create monthly scorecards
Photo credit: Stephen Korecky
Take accountability and responsibility
Image credit: Brian A Petersen http://www.flickr.com/photos/bpbp/
You’ve got
questions? We’ve
got answers.
@annabananahrach @rebekahcancino

Data Driven: Using Analytics Insights to Guide Effective Content Creation

  • 1.
    DATA DRIVEN using Analyticsinsights to drive effective content creation welcome to
  • 2.
    Yes. Hello. Rebekah Cancino,Communication Strategist at Forty So glad you’re here Anna Hrach, Content Strategist at RIESTER #DCSC@annabananahrach @rebekahcancino
  • 3.
    So how doesthis work? #DCSC@annabananahrach @rebekahcancino
  • 4.
    Today’s plan 1.  Understandwhy we use metrics 2.  Find out where to start 3.  Learn how to find and read content-relevant metrics 4.  Distinguish fact vs. fiction 5.  Discover the power of pairing 6.  Balance short-term tactics and long term-strategy
  • 5.
    is year, theaverage consumer will see or hear 1 million marketing messages - that's almost 3,000 per day. -
  • 6.
  • 7.
    Content is nota feature. - Kristina Halvorson Image credit: Bob Maske http://www.flickr.com/photos/audio1bob/320065808/
  • 8.
    Data allows youtrack experiences
  • 9.
    “Observe everything. Communicatewell.” Image credit: reurinkjan http://www.flickr.com/photos/reurinkjan/5505995483
  • 10.
    Good: metrics areabout measurement Better: metrics are about learning It’s about learning Image credit: http://www.flickr.com/photos/e8albumdkmatai/4274025836
  • 11.
    Discover opportunities Content that’sworking How people find your site Popular content Image credit: Monte Mendoza http://www.flickr.com/photos/elmundodemontemendoza/8216522379/
  • 12.
    Reveal problems Content thatisn’t working Bad user experiences Information architecture issues Image credit: Daniel Schneider http://www.flickr.com/photos/rapturedmind/6544675195
  • 13.
    Design smarter Content Information architecture Navigationsyntax and structure Image credit: Brian Purkiss http://www.flickr.com/photos/brianpurkiss/1398732343/
  • 14.
  • 15.
    Start with what Whatneeds to be accomplished? Image credit: Erik Daniel Drost http://www.flickr.com/photos/edrost88/7811696028/
  • 16.
    Ask why? Balance wantswith needs Image credit: Rick Munish http://rickmunish.deviantart.com/art/Justice-162068786
  • 17.
  • 18.
    Take a lookinside Who are you writing for? What do they need? Photo credit: Florin Gorgan
  • 19.
    emotional physicalcognitive Right for theuser Personal-Behavioral Context: e New User Persona. © Daniel Eizans, 2010 DOING Environmental, physical, disabilities, preferences, sensory stimuli FEELING Psychological state, stress level, desires, wants, needs LEARNING Cognitive assumptions, learning ability, education
  • 20.
  • 21.
    Analytics reveal alot You just have to know how to read them
  • 22.
    Learn to lovedata Meet user needs Make your job easier Accomplish business objectives Image credit: Skinned Mink http://www.flickr.com/photos/21148821@N02/2055959594/
  • 23.
    Construct your toolbox Findthe right tools for the job Make sure platforms meet data analysis needs Image credit: red11group http://www.flickr.com/photos/red11group/4870242163/
  • 24.
    On-site search Listen. Analyze.Understand. Improve. Visitors telling you exactly what they need Rewrite or add content to meet needs Image credit: designerweb http://designerweb.deviantart.com/art/Stylish-Search-Bar-201157774
  • 25.
    Google Analytics: let’sdefine our metrics Image credit: Roel Willems http://www.flickr.com/photos/roelwillems/4461453799/
  • 26.
    Feeling overwhelmed? Begin atthe top Start with defining goals and key metrics Drill your way down Image credit: Nomadic Lass http://www.flickr.com/photos/nomadic_lass/6832118879/
  • 27.
    Organic search? Gauge contentrankings and gaps List of what your site is ranking for (not provided) Image credit:Mark Hofstetter http://commons.wikimedia.org/wiki/File:Avocado_Seedling.jpg
  • 28.
    Bounce rate? 4 scenarios:back button, close browser, new URL, does nothing % of people who never visit a second page Determine content effectiveness & audience Image credit: MichaelMaggs Edit by Richard Bartz"
  • 29.
    Top content? Understand whypeople come to your site Identify most popular pages Determine how to prioritize deeper content Image credit:emiliokuffer http://www.flickr.com/photos/22298955@N08
  • 30.
    Mobile users? Evaluate layout,design and information delivery Prioritize content Recognize the need for responsive design Image credit: DanielZanetti http://commons.wikimedia.org/wiki/File:Iphone_4G-2.jpg
  • 31.
    Average time? Understand averagevisit Key difference: time on page vs. time on site Image credit: mararie http://www.flickr.com/photos/32404172@N00
  • 32.
  • 33.
    ere’s no shortcutfor identifying why a piece of content exists. is is the first step to understanding how to measure its performance. Remember
  • 34.
    Don t fallfor it More traffic=more money e only metrics you need to measure myth Industry standards Engagement metrics Image credit: Suburban Paparazzi http://www.flickr.com/photos/38549058@N03/3545848025/sizes/l/in/photostream
  • 35.
    Seek the truth Lookfor patterns Pair metrics for real insight Learn>measure Image credit: Jacqueline ter Haar http://www.flickr.com/photos/jacquelineterhaar/3550688115/
  • 36.
  • 37.
    FALSE Unique visitors =count of persistent cookies dropped in a browser Unique visitors represent real people?
  • 38.
    FALSE It doesn’t counttime from bounced visitors and last page in session. Better to use page (vs. site) level data for precise content segment measurement. Average visit duration is a precise measure of how long visitors spend on your site?
  • 39.
    TRUE Best practices aregreat, but nothing beats analyzing Analytics against your own site goals ere’s no such thing as the most important metrics for everyone or a plug-and-play measurement strategy?
  • 40.
    Content that drivesa lot of traffic to your site is very valuable? IT DEPENDS Not if it’s driving unqualified traffic that doesn’t meet your business objectives
  • 41.
    Having a highbounce rate can negatively impact your search result rankings? FALSE Google is smarter than your bounce rate, a high bounce rate doesn’t always mean a bad experience
  • 42.
  • 43.
    ere are threekinds of lies: lies, damn lies, and statistics." - Mark Twain
  • 44.
    Better together ere’s noshort cut for identifying why a page/site exists Always view metrics in context of your goals Image credit: Kory Trapane http://www.flickr.com/photos/trapane/3059905337 Single metrics don’t tell the whole story on their own
  • 45.
    page level: goalof page + bounce rate + avg. time on page How do I put the bounce rate in context? Ask questions, like
  • 46.
    page level: uniquevisitors + page views + time on page What content do visitors want more of? Ask questions, like
  • 47.
    page level: bouncerate + entrances How can your content make a better first impression? Ask questions, like
  • 48.
    site level: pages/visit+ avg. visit duration How can I tell if visitors are finding what they need? Ask questions, like
  • 49.
    Photo credit: UsamaSalehhttp: http://www.flickr.com/photos/stephencuyos/5430355182 Every metric needs a buddy
  • 50.
    Ask questions. Formulatea hypothesis. Test. Repeat.
  • 51.
    You formulate ahypothesis: Maybe our navigation is unclear? Sample scenario You see a high amount of page views per visit with a relatively low avg. time on site, and you wonder: Are users having a hard time finding what they need? Which leads to an experiment: Let’s clarify the navigation syntax and see if there’s an improvement.
  • 52.
    ere’s no suchthing as “the most important metrics to measure” or a plug-and-play measurement strategy. Remember
  • 53.
  • 54.
    e key tosuccess is strategy Photo credit: Loco s Photos
  • 55.
    Get everyone talkingagain Marry with user needs Identify business objectives Develop content that satisfies both Photo credit: Ivan Walsh Photo credit: Ivan Walsh
  • 56.
    Establish benchmarks andstandards Image credit: Bionic Teaching http://www.flickr.com/photos/bionicteaching/6986167357/
  • 57.
    Track. Measure. Report.Refine. Rinse. Repeat. Image credit: Louise Docker http://commons.wikimedia.org/wiki/File:TapeMeasure.jpg
  • 58.
    Create monthly scorecards Photocredit: Stephen Korecky
  • 59.
    Take accountability andresponsibility Image credit: Brian A Petersen http://www.flickr.com/photos/bpbp/
  • 60.
    You’ve got questions? We’ve gotanswers. @annabananahrach @rebekahcancino