SlideShare a Scribd company logo
1 of 11
Download to read offline
cushmanwakefield.com | 1
U.S. Industrial
Q3 2018
MARKETBEAT
U.S. INDUSTRIAL
Overall Vacancy
Net Absorption/Rent NNN
4-QTR TRAILING AVERAGE
Market Indicators
Q3 17 Q3 18 12-Month
Forecast
Overall Vacancy 5.1% 4.9%
Net Absorption 66.8M 66.3M
Under Construction 233.1M 285.4M
Weighted Asking Rent (NNN) $5.80 $6.15
Rent Growth (Yr/Yr % Chg.) 3.9% 5.9%
Employment Indicators
Q3 17 Q3 18 12-Month
Forecast
Total Nonfarm Employment 146.9M 149.3M
Industrial Employment 31.5M 32.3M
Unemployment 4.4% 3.9%
$4.00
$4.50
$5.00
$5.50
$6.00
$6.50
0
10
20
30
40
50
60
70
80
2014 2015 2016 2017 2018
Net Absorption, MSF Weighted Asking Rent, $ PSF
Forecast
0.0%
2.0%
4.0%
6.0%
8.0%
10.0%
2014 2015 2016 2017 2018
Historical Average = 7.8%
Forecast
Another Year Another Medal
U.S. industrial absorption is on track to finish 2018 with its third
strongest net occupancy growth, behind only 2016 and 2014.
Considering the strong economic fundamentals, there is no
indication that demand will soften in the final quarter of 2018.
This means that the three strongest years of industrial
occupancy growth since the 1980s will have occurred in the last
five years. Looking forward, the combination of limited new
product and high utilization rates of existing footprints will
translate to strong performance for Class A product and
improved performance for Class B and C product.
Broad-Based Growth Continues: U.S. industrial markets
absorbed 66.3 million square feet (msf) in the third quarter of
2018, pushing year-to-date absorption to 203.9 msf, a 10.5%
increase from the 184.5 msf registered a year ago. Leasing
demand continued to be broad-based during the quarter, with
41 markets recording over 1 msf of net absorption and 29
markets eclipsing 2 msf of occupancy gains year-to-date. Each
industrial segment continued on a roll, with annual net
absorption for warehouse/distribution real estate surpassing
180 msf, while the growth rate for manufacturing and flex space
absorption nearly doubled in the third quarter of 2018 with
those segments absorbing 13.6 msf and 6.4 msf, respectively.
Among the U.S. regions, the South set the pace for the market
in the third quarter of 2018 with 27.7 msf of quarterly
absorption, and the West closely behind at 20.8 msf. Markets in
which annual net absorption was strongest included the Inland
Empire (22.7 msf), Dallas/Fort Worth (17.2 msf), Atlanta (15.9
msf) the Pennsylvania I-81/I-78 Distribution Corridor (13.3 msf),
Chicago (12.9 msf), and Central New Jersey (12.4 msf).
Vacancy Remains Anchored: Despite the delivery of 72 msf of
new product in the third quarter of 2018, the vacancy rate
remained anchored at a historic low of 4.9%, 130 basis points
(bps) below the 5-year historical average of 6.2% for all product
types. Vacancy rates have declined over the last 12 months in
50 of the 79 markets tracked by Cushman & Wakefield, with
rates holding steady or declining further in 42 markets during
the third quarter. Among the tightest markets were Los Angeles
(with vacancy of 1.4%), Orange County (1.7%), Salt Lake City
(2.4%), the San Francisco Peninsula (2.6%), Central New Jersey
and Silicon Valley (each at 2.8%), Cincinnati (2.9%) and
Jacksonville (3.0%).
Strong Fundamentals in Secondary Markets: Strengthening
fundamentals in secondary markets have helped spur solid
occupancy growth. Over 30 secondary markets registered
more than 1 msf of net absorption year-to-date. Notably,
average annual rent growth for both warehouse and
manufacturing are forecast to be strongest in secondary
markets in 2018, although growth will also be strong in primary
and tertiary markets.
All Eyes on Development: Market conditions are motivating
new development; construction starts jumped by 22.4%
year-over-year nationally, with 34 markets experiencing an
uptick in construction starts during the third quarter of 2018.
The largest up-tick was in the Midwest—where the development
pipeline increased 34.5% since the second quarter of 2018—
while construction activity increased modestly in the South and
Source: Cushman & Wakefield Research
Source: BLS
cushmanwakefield.com | 2
U.S. Industrial
Q3 2018
MARKETBEAT
Markets Remain Tight
Development Pipeline Building
Q3 2018 INDUSTRIAL PRODUCT UNDER CONSTRUCTION
Few Signs of Overbuilding
YEAR-TO-DATE SUPPLY & DEMAND FUNDAMENTALS
Outlook
•	 Net absorption will surpass 250 msf in 2018 for a
third year in a row, and eclipse 100 msf for a sixth
consecutive year in 2019.
•	 Supply will modestly outpace demand with the overall
industrial vacancy rate remaining in the low-to-mid 5%
range through 2018 and 2019.
•	 Rent growth will remain strong in 2018 and gradually
begin to decelerate in 2019.
Source: Cushman & Wakefield Research
Northeast and fell slightly in the West. There is currently 285.4
msf of industrial product under construction of which 199.4
msf is speculative, 70% more than the 5-year historical
average of 104.9 msf. Development of all sizes remains
concentrated in a handful of markets, but activity is ticking up
across the country. This is evidenced by the Inland Empire,
Dallas/Fort Worth, Atlanta, Chicago, and the Pennsylvania
I-81/I-78 Distribution Corridor still accounting for more than
one-third of product under construction, but 45 additional
markets currently having more than 1 msf under development.
Rents Rise Above Replacement Costs: U.S. industrial rents
increased 5.9% in the third quarter of 2018 from a year ago,
rising in 53 markets—20 of which posted double-digit gains.
The strongest rent growth occurred in San Francisco North
Bay, Central Valley California, Central New Jersey, Seattle,
Sacramento, Boston, Long Island, Memphis and Pittsburgh—all
markets in which average asking rents rose more than 15%
year-over-year. Although overall asking rents currently stand
at a high of $6.15 per square foot, on an inflation-adjusted
basis rents remain 4.3% below their level at the height of the
last cycle. Rent growth has lifted rents above replacement
costs in many markets, which—when taken in tandem with
tight conditions and continued demand—will bolster additional
development. Nevertheless, rising construction costs and the
conservatism among developers that has been a hallmark of
the current expansion will promote prudence and keep
industrial rents from being watered down from a wave of
speculative supply.
Booming Freight Economy: The outlook for consumer
spending and retail sales is positive, and that for eCommerce
even more so: online sales are forecast to grow by double-
digits throughout the next three years. And despite concerns
over trade policy, the primary drivers of industrial leasing
exhibit strength. Ports are bustling, industrial output was the
highest ever in August, and the Association of American
Railroads reports that the last two weeks of September 2018
were the two highest-volume U.S. intermodal weeks on record.
Inflation remains the greatest near-term risk. Eventually, higher
input and product costs—as measured by the producer price
index (PPI)—could result in higher consumer prices which
could stifle consumption and demand for industrial real estate.
Recently, the PPI has been ticking upward—and not just as a
result of tariff-related price effects. Transportation and
storage costs are rising rapidly. Despite the inflationary
headwinds, the U.S. economy and the industrial property
market are expected to perform well in 2018 and 2019.
0%
2%
4%
6%
8%
10%
12%
14% Q3 2018 Vacancy Prior Cycle Lows (2002-2007)
0
5
10
15
20
25 Speculative Deliveries (MSF) Build-to-Suit Deliveries (MSF) Net Absorption (MSF)
0
5
10
15
20
25
30 Speculative U/C (MSF) Build-to-Suit U/C (MSF)
MarketBeat U.S. Q3 2018 cushmanwakefield.com | 3
Net Absorption Leasing Activity
Demand Indicators (Overall) Q3 2017 Q4 2017 Q1 2018 Q2 2018 Q3 2018p Q3 2018p
United States 66,812,583 63,862,195 63,606,343 74,024,994 66,275,849 118,078,023
Northeast 8,861,433 5,186,345 11,738,275 7,574,394 8,334,036 16,490,828
Midwest 14,367,981 20,129,097 10,453,129 19,048,749 9,491,534 22,682,864
South 25,175,978 21,782,491 23,005,428 31,230,527 27,654,469 35,949,519
West 18,407,191 16,764,262 18,409,511 16,171,324 20,795,810 42,954,812
U.S. Industrial Report Markets Q3 2017 Q4 2017 Q1 2018 Q2 2018 Q3 2018p Q3 2018p
Atlanta, GA 3,648,731 4,088,694 5,060,545 3,914,585 6,965,199 6,343,792
Austin, TX -310,320 333,881 88,415 -7,271 33,372 517,471
Baltimore, MD 2,000,608 747,727 1,285,871 1,527,676 1,076,185 1,263,962
Binghamton, NY 40,000 67,346 0 -104,450 -137,442 20,000
Birmingham, AL 41,451 54,771 51,651 -139,480 284,495 385,190
Boston, MA -141,078 492,001 278,374 -322,686 -286,481 338,760
Buffalo, NY 164,966 -924,409 -419,352 -416,072 361,972 617,885
Central Valley, CA 1,117,105 921,226 1,906,657 611,363 2,894,262 3,786,550
Charleston, SC -412,412 -129,871 1,050,618 3,373,254 2,696 477,213
Charlotte, NC 349,467 188,684 398,436 1,862,756 936,141 1,174,123
Chicago, IL 2,099,650 6,156,467 2,978,396 6,338,567 3,605,619 6,445,504
Cincinnati, OH 424,580 1,064,784 1,569,121 2,028,135 1,862,303 2,059,839
Cleveland, OH 119,114 -287,548 1,362,622 -876,635 -682,362 624,685
Colorado Springs, CO -226,085 18,596 191,460 271,803 268,162 170,130
Columbus, OH 1,426,826 1,812,261 320,010 2,011,600 739,775 2,127,657
Dallas/Ft. Worth, TX 6,888,446 4,640,129 3,148,086 8,447,765 5,556,610 5,990,270
Dayton, OH -148,694 489,070 -183,797 -19,724 -98,342 57,382
Denver, CO 1,347,621 1,543,466 249,507 558,268 1,223,839 2,342,483
Detroit, MI 1,091,403 2,555,549 -311,631 2,072,402 -1,906,249 2,002,416
El Paso, TX 376,794 321,135 372,123 100,800 680,474 344,726
Fort Myers/Naples, FL -28,025 73,330 32,218 -134,930 -147,698 321,362
Fredericksburg, VA 49,387 56,102 868,508 -140,363 -42,789 98,271
Ft. Lauderdale, FL 179,962 514,548 -152,477 -165,440 843,971 1,396,645
Greenville, SC 502,474 394,982 1,800,991 1,069,748 1,868,143 393,527
Hampton Roads, VA 576,275 -36,520 302,709 -22,701 -338,584 334,280
Hartford, CT 27,817 135,148 359,849 -77,021 -1,363,863 516,783
Houston, TX 3,209,316 -104,023 817,236 1,459,852 485,266 3,997,029
Indianapolis, IN 2,313,853 3,716,487 556,797 1,658,650 4,138,778 2,837,672
Inland Empire CA 7,126,381 4,688,875 6,318,215 7,795,158 8,554,877 9,577,927
Jacksonville, FL 1,826,645 1,423,221 331,318 -107,214 45,155 287,502
Kansas City, MO 1,682,050 2,117,643 2,037,146 1,895,096 805,447 2,532,637
Lakeland, FL 293,766 36,455 435,792 643,178 235,643 149,005
Las Vegas, NV 2,145,979 2,298,777 1,970,032 1,352,307 630,459 1,063,059
Long Island, NY 253,587 852,791 -342,938 284,735 -588,527 567,655
Los Angeles, CA 1,837,210 1,022,046 1,685,219 -5,468 1,612,015 7,978,800
Louisville, KY 1,245,202 1,222,039 1,774,227 3,224,156 2,028,682 2,387,332
Memphis, TN 486,717 662,189 1,370,642 -211,289 1,303,011 2,736,150
Miami, FL 128,146 730,241 995,053 895,165 2,642,658 1,618,923
Milwaukee, WI 1,493,471 -56,043 842,084 712,238 79,061 1,064,415
Minneapolis, MN 872,326 825,334 592,886 895,305 560,618 1,960,941
Demand Indicators
MarketBeat U.S. Q3 2018 cushmanwakefield.com | 4
Net Absorption Leasing Activity
Demand Indicators (Overall) Q3 2017 Q4 2017 Q1 2018 Q2 2018 Q3 2018p Q3 2018p
Nashville, TN 1,675,012 120,526 1,308,765 1,899,880 1,001,225 808,386
New Haven, CT 5,477 175,696 131,206 -43,970 208,046 432,533
New Jersey - Central 2,809,359 2,184,634 3,906,067 3,124,948 5,325,215 5,369,090
New Jersey - Northern 497,798 1,664,946 161,298 735,863 336,333 3,425,712
Northern VA -20,211 35,291 68,689 511,809 306,033 491,546
Oakland/East Bay, CA -1,569,379 660,234 -419,159 -1,489,837 -305,680 2,178,710
Oklahoma City, OK -542,074 n/a -36,553 -56,541 -4,993 333,614
Omaha, NE 349,921 455,995 -45,931 92,488 -168,696 267,789
Orange County, CA -143,511 -261,531 -122,415 362,050 186,754 2,772,216
Orlando, FL 462,458 789,720 679,407 1,318,618 384,622 1,694,486
Palm Beach County, FL 362,784 101,677 4,592 49,778 87,463 319,106
PA I-81/I-78 Distribution Corridor 3,541,623 844,371 4,626,038 5,380,314 3,284,050 2,418,078
Philadelphia, PA 1,437,888 611,009 1,709,697 -393,235 371,849 1,778,930
Phoenix, AZ 2,571,976 2,600,022 1,615,377 2,628,495 2,212,260 2,548,499
Pittsburgh, PA -650,575 -356,733 1,186,565 -1,162,742 79,076 638,309
Portland, OR 870,133 -72,333 -633,444 1,315,894 609,839 1,563,766
Providence, RI 63,199 313,632 71,456 142,176 61,684 61,684
Puget Sound - Eastside -182,255 220,980 524,863 214,628 391,358 444,790
Raleigh/Durham, NC 317,502 -294,394 225,740 184,041 129,296 159,421
Richmond, VA 705,151 1,022,908 70,213 19,340 189,478 97,505
Roanoke, VA 95,604 6,011 480,115 472,350 54,719 22,047
Rochester, NY 407,166 -594,469 101,023 34,455 981,275 0
Sacramento, CA 1,379,668 1,426,115 1,717,798 825,852 -131,069 1,166,644
Salt Lake City, UT 798,628 723,096 1,039,351 -136,573 1,652,453 1,142,353
San Antonio, TX 135,180 -203,074 76,360 -26,959 79,690 391,347
San Diego, CA 844,640 103,378 -85,162 903,332 513,371 2,358,708
San Francisco North Bay, CA 71,827 39,783 -80,832 135,573 38,977 275,593
San Francisco Peninsula, CA 762 15,292 -4,915 -219,691 -134,821 354,722
San Jose (Silicon Valley), CA -177,705 346,282 731,852 71,272 -253,643 358,595
Savannah, GA 0 3,855,811 0 920,868 0 0
Seattle, WA 561,459 251,674 1,762,853 658,361 577,153 2,719,250
Southern New Hampshire 184,217 -302,661 -118,498 135,192 -194,820 195,392
St. Louis, MO 2,643,481 1,279,098 735,426 2,240,627 555,582 701,927
St. Petersburg/Clearwater, FL 123,416 225,964 -165,644 116,241 -261,559 199,990
Suburban MD 37,371 316,522 71,323 173,822 320,893 355,790
Syracuse, NY 219,989 23,043 87,490 256,887 -104,331 110,017
Tampa, FL 677,735 587,815 132,184 -57,510 839,148 488,357
Tucson, AZ 32,737 218,284 42,254 318,537 255,244 152,017
Tulsa, OK 93,420 n/a 58,275 114,543 69,824 371,151
Demand Indicators
p = preliminary
MarketBeat U.S. Q3 2018 cushmanwakefield.com | 5
Vacancy Rates
Overall Vacancy Rate Q3 2017 Q4 2017 Q1 2018 Q2 2018 Q3 2018p
United States 5.1% 5.1% 5.0% 4.9% 4.9%
Northeast 5.3% 5.3% 5.1% 5.3% 5.3%
Midwest 5.4% 5.3% 5.3% 5.0% 5.0%
South 6.2% 6.1% 5.9% 5.8% 5.8%
West 3.7% 3.7% 3.5% 3.6% 3.5%
U.S. Industrial Report Markets Q3 2017 Q4 2017 Q1 2018 Q2 2018 Q3 2018p
Atlanta, GA 7.8% 7.7% 8.1% 8.2% 7.9%
Austin, TX 9.5% 8.8% 9.2% 7.3% 7.1%
Baltimore, MD 6.9% 6.4% 6.4% 6.2% 7.3%
Binghamton, NY 9.8% 9.9% 8.8% 9.7% 10.5%
Birmingham, AL 10.8% 10.6% 10.2% 11.3% 9.8%
Boston, MA 6.4% 6.2% 5.9% 6.2% 6.7%
Buffalo, NY 8.9% 9.1% 9.2% 9.5% 9.2%
Central Valley, CA 2.8% 3.3% 3.6% 4.5% 3.5%
Charleston, SC 8.0% 8.1% 8.0% 7.2% 7.7%
Charlotte, NC 3.5% 3.4% 5.1% 4.5% 4.4%
Chicago, IL 6.7% 6.8% 6.8% 6.3% 6.0%
Cincinnati, OH 3.4% 3.2% 3.7% 3.0% 2.9%
Cleveland, OH 3.8% 3.9% 3.5% 3.5% 3.9%
Colorado Springs, CO 10.6% 10.7% 7.9% 6.9% 6.4%
Columbus, OH 5.1% 4.7% 4.8% 5.1% 5.4%
Dallas/Ft. Worth, TX 6.8% 7.0% 6.4% 6.4% 6.9%
Dayton, OH 8.2% 8.3% 7.8% 8.0% 8.1%
Denver, CO 4.8% 4.9% 5.0% 5.3% 5.4%
Detroit, MI 3.1% 2.9% 2.9% 2.9% 3.2%
El Paso, TX 5.0% 3.2% 2.7% 2.4% 1.1%
Fort Myers/Naples, FL 1.8% 1.9% 2.1% 2.8% 2.7%
Fredericksburg, VA 4.7% 5.3% 5.5% 6.7% 7.0%
Ft. Lauderdale, FL 4.0% 2.9% 3.8% 3.7% 3.1%
Greenville, SC 5.8% 5.8% 5.4% 5.3% 4.8%
Hampton Roads, VA 4.1% 4.4% 4.2% 3.9% 4.2%
Hartford, CT 8.1% 7.9% 7.6% 7.7% 6.8%
Houston, TX 6.2% 6.3% 6.0% 6.2% 6.4%
Indianapolis, IN 5.5% 5.3% 5.5% 5.2% 4.7%
Inland Empire CA 4.0% 4.1% 3.9% 4.1% 3.9%
Jacksonville, FL 4.8% 4.0% 3.4% 2.9% 3.0%
Kansas City, MO 7.1% 7.2% 7.4% 6.8% 6.7%
Lakeland, FL 3.9% 3.9% 4.9% 4.5% 3.8%
Las Vegas, NV 5.9% 4.6% 4.8% 4.3% 4.5%
Long Island, NY 6.5% 5.6% 5.1% 5.0% 5.1%
Los Angeles, CA 1.2% 1.3% 1.3% 1.5% 1.4%
Louisville, KY 8.1% 7.7% 7.2% 6.4% 5.9%
Memphis, TN 8.2% 7.8% 7.4% 7.2% 6.3%
Miami, FL 4.7% 4.7% 4.3% 4.3% 3.6%
Milwaukee, WI 3.8% 4.1% 4.1% 4.0% 4.2%
Minneapolis, MN 8.0% 8.5% 8.7% 8.2% 7.9%
MarketBeat U.S. Q3 2018 cushmanwakefield.com | 6
Vacancy Rates
Overall Vacancy Rate Q3 2017 Q4 2017 Q1 2018 Q2 2018 Q3 2018p
Nashville, TN 3.3% 3.5% 3.4% 3.2% 3.9%
New Haven, CT 9.8% 9.5% 9.1% 9.3% 6.9%
New Jersey - Central 3.6% 3.3% 2.6% 2.6% 2.8%
New Jersey - Northern 4.6% 4.4% 4.7% 4.1% 4.1%
Northern VA 8.7% 8.4% 10.1% 9.3% 8.6%
Oakland/East Bay, CA 3.3% 3.0% 3.0% 3.7% 4.2%
Oklahoma City, OK 9.0% 9.0% 4.7% 4.7% 5.3%
Omaha, NE 3.6% 3.4% 2.5% 2.9% 3.1%
Orange County, CA 1.9% 1.9% 1.9% 1.9% 1.7%
Orlando, FL 5.5% 5.4% 5.1% 4.8% 5.2%
Palm Beach County, FL 3.3% 2.7% 3.0% 3.1% 2.8%
PA I-81/I-78 Distribution Corridor 5.3% 5.1% 4.8% 5.5% 6.3%
Philadelphia, PA 3.4% 4.0% 3.3% 3.2% 3.1%
Phoenix, AZ 8.3% 7.9% 7.8% 7.1% 7.3%
Pittsburgh, PA 4.8% 5.4% 5.4% 6.1% 6.5%
Portland, OR 3.5% 3.9% 4.2% 3.9% 3.4%
Providence, RI 0.1% 0.1% 0.0% 0.4% 0.4%
Puget Sound - Eastside 4.9% 4.7% 4.3% 4.2% 3.9%
Raleigh/Durham, NC 5.5% 6.0% 5.5% 5.5% 4.8%
Richmond, VA 3.7% 3.7% 3.9% 3.5% 4.2%
Roanoke, VA 7.1% 7.2% 7.0% 6.6% 6.6%
Rochester, NY 9.0% 9.8% 9.7% 9.6% 8.3%
Sacramento, CA 6.3% 5.9% 4.3% 4.3% 4.5%
Salt Lake City, UT 5.8% 5.6% 5.2% 5.2% 2.4%
San Antonio, TX 8.0% 8.8% 8.4% 8.6% 9.0%
San Diego, CA 4.8% 4.8% 4.8% 4.9% 5.0%
San Francisco North Bay, CA 4.8% 4.6% 4.2% 3.9% 3.6%
San Francisco Peninsula, CA 2.1% 2.0% 1.6% 2.3% 2.6%
San Jose (Silicon Valley), CA 3.6% 3.2% 2.3% 2.7% 2.8%
Savannah, GA 3.2% 1.2% 1.2% 0.6% 0.6%
Seattle, WA 4.2% 4.1% 3.5% 3.9% 4.0%
Southern New Hampshire 7.5% 8.2% 8.8% 9.2% 8.2%
St. Louis, MO 6.7% 6.0% 6.1% 5.7% 6.1%
St. Petersburg/Clearwater, FL 3.5% 3.6% 3.8% 3.7% 4.0%
Suburban MD 10.4% 9.7% 9.7% 9.3% 8.2%
Syracuse, NY 8.8% 8.8% 8.6% 7.8% 8.0%
Tampa, FL 5.2% 5.3% 5.8% 6.2% 5.5%
Tucson, AZ 8.2% 6.6% 6.3% 6.0% 5.7%
Tulsa, OK 8.9% 8.9% 3.1% 3.0% 2.7%
p = preliminary
MarketBeat U.S. Q3 2018 cushmanwakefield.com | 7
Asking Rents
Overall (All Property Types) W/D MFG
Weighted Average Asking Rent Q3 2017 Q4 2017 Q1 2018 Q2 2018 Q3 2018p Q3 2018p
United States $5.80 $5.84 $6.00 $6.11 $6.15 $5.44 $6.07
Northeast $6.03 $6.17 $6.40 $6.51 $6.73 $6.41 $5.14
Midwest $4.61 $4.61 $4.70 $4.79 $4.79 $4.47 $4.67
South $5.45 $5.41 $5.62 $5.60 $5.58 $4.83 $4.91
West $7.98 $8.12 $8.34 $8.58 $8.71 $7.66 $9.43
U.S. Industrial Report Markets Q3 2017 Q4 2017 Q1 2018 Q2 2017 Q3 2018p Q3 2018p
Atlanta, GA $4.54 $4.47 $4.83 $4.96 $5.04 $4.21 $3.98
Austin, TX $9.34 $9.24 $10.08 $9.94 $10.37 $7.60 $9.65
Baltimore, MD $5.10 $5.70 $5.75 $5.77 $5.54 $5.02 n/a
Binghamton, NY $4.58 $4.57 $4.57 $4.57 $4.55 $4.31 $4.21
Birmingham, AL $4.09 $4.02 $3.98 $4.06 $4.26 $3.93 n/a
Boston, MA $6.97 $8.17 $7.45 $7.30 $8.22 $7.63 $7.93
Buffalo, NY $4.13 $4.13 $4.13 $4.13 $4.13 $4.25 $3.95
Central Valley, CA $4.24 $4.75 $4.44 $5.15 $5.46 $4.56 $7.53
Charleston, SC $5.48 $5.52 $5.54 $5.52 $5.46 $5.49 $4.95
Charlotte, NC $5.42 $5.21 $5.27 $5.18 $5.30 $4.82 $4.45
Chicago, IL $5.03 $5.08 $5.19 $5.29 $5.34 $5.06 $4.92
Cincinnati, OH $4.33 $4.25 $4.34 $4.40 $4.27 $4.01 $3.26
Cleveland, OH $4.12 $4.15 $4.30 $4.44 $4.12 $3.80 n/a
Colorado Springs, CO $7.37 $7.85 $8.07 $8.13 $8.15 $7.60 $7.24
Columbus, OH $3.46 $3.50 $3.55 $3.59 $3.60 $3.60 n/a
Dallas/Ft. Worth, TX $5.59 $5.06 $5.40 $5.50 $5.12 $4.19 $4.20
Dayton, OH $3.33 $3.26 $3.29 $3.05 $3.08 $3.06 $2.93
Denver, CO $8.03 $7.96 $7.78 $7.92 $8.02 $6.61 $7.76
Detroit, MI $5.56 $5.57 $5.79 $5.96 $6.09 $5.59 $5.41
El Paso, TX $4.00 $4.10 $4.10 $4.10 $4.25 $4.25 $4.15
Fort Myers/Naples, FL $7.50 $7.61 $7.72 $7.75 $7.99 $7.55 $8.86
Fredericksburg, VA $5.73 $5.73 $5.79 $5.97 $5.69 $5.77 $4.90
Ft. Lauderdale, FL $9.21 $9.27 $9.45 $9.36 $8.73 $8.15 $8.97
Greenville, SC $3.63 $3.60 $3.43 $3.45 $3.63 $3.59 $3.34
Hampton Roads, VA $5.00 $5.28 $5.44 $5.52 $5.67 $5.54 $5.53
Hartford, CT $4.24 $4.28 $4.47 $4.55 $4.88 $4.80 $3.78
Houston, TX $6.40 $6.44 $6.22 $6.13 $6.22 $6.10 $5.58
Indianapolis, IN $3.76 $3.80 $3.88 $4.09 $3.99 $3.65 $3.09
Inland Empire CA $7.52 $7.61 $7.69 $7.76 $7.92 $7.70 $8.20
Jacksonville, FL $4.98 $5.37 $5.52 $5.67 $5.21 $4.72 $3.12
Kansas City, MO $4.43 $4.27 $4.20 $4.29 $4.38 $4.03 $5.28
Lakeland, FL $5.76 $5.54 $5.45 $5.64 $5.68 $5.06 $8.21
Las Vegas, NV $6.84 $6.96 $6.96 $7.08 $6.96 $6.48 $5.40
Long Island, NY $9.21 $9.44 $10.68 $10.90 $10.81 $10.21 $11.29
Los Angeles, CA $9.00 $9.36 $9.85 $10.02 $10.05 $9.57 $9.61
Louisville, KY $3.70 $3.73 $3.81 $3.88 $3.94 $3.79 $3.54
Memphis, TN $2.75 $2.75 $2.75 $3.15 $3.22 $3.09 $2.77
Miami, FL $8.25 $8.45 $8.79 $7.49 $7.55 $7.16 $7.73
Milwaukee, WI $4.59 $4.64 $4.57 $4.59 $4.63 $4.22 $4.68
Minneapolis, MN $4.90 $4.88 $4.90 $4.90 $4.94 $4.50 n/a
MarketBeat U.S. Q3 2018 cushmanwakefield.com | 8
Asking Rents
p = preliminary
Overall (All Property Types) W/D MFG
Weighted Average Asking Rent Q3 2017 Q4 2017 Q1 2018 Q2 2018 Q3 2018p Q3 2018p
Nashville, TN $5.03 $5.09 $4.91 $4.76 $4.80 $4.87 $3.44
New Haven, CT $5.15 $5.35 $5.57 $5.43 $5.31 $4.56 $5.70
New Jersey - Central $7.39 $7.58 $7.69 $8.30 $8.87 $8.05 $7.69
New Jersey - Northern $7.82 $8.56 $8.57 $8.61 $8.67 $8.75 $6.62
Northern VA $11.12 $11.36 $11.18 $11.57 $11.80 $9.09 n/a
Oakland/East Bay, CA $10.10 $10.43 $10.45 $11.42 $11.47 $10.30 $12.31
Oklahoma City, OK $4.95 $4.95 $4.78 $4.74 $4.70 $4.83 $4.13
Omaha, NE $5.57 $5.55 $5.62 $5.58 $5.62 $5.46 $4.61
Orange County, CA $10.74 $11.24 $11.61 $11.34 $11.94 $10.64 $11.60
Orlando, FL $6.38 $6.48 $6.45 $6.60 $6.88 $5.76 $5.83
Palm Beach County, FL $10.56 $10.69 $10.74 $10.01 $10.12 $8.47 $9.45
PA I-81/I-78 Distribution Corridor $4.75 $4.77 $4.80 $4.86 $4.88 $4.89 $4.50
Philadelphia, PA $4.58 $4.51 $4.76 $4.79 $4.96 $4.86 $4.94
Phoenix, AZ $6.80 $6.70 $6.91 $7.31 $6.83 $5.27 $7.77
Pittsburgh, PA $7.68 $7.58 $8.59 $8.77 $8.88 $5.98 $5.22
Portland, OR $8.38 $8.50 $8.53 $8.72 $8.67 $7.67 $8.91
Providence, RI $4.85 $4.85 $4.85 $4.85 $4.85 $4.70 n/a
Puget Sound - Eastside $12.24 $11.76 $11.75 $11.53 $11.14 $10.74 $8.19
Raleigh/Durham, NC $7.71 $8.70 $8.51 $8.66 $8.64 $5.96 $8.40
Richmond, VA $5.03 $4.92 $4.83 $5.16 $4.89 $4.74 $5.36
Roanoke, VA $4.99 $4.98 $5.21 $5.16 $5.18 $4.68 $7.58
Rochester, NY $4.84 $4.84 $5.40 $5.40 $5.40 $3.75 $4.75
Sacramento, CA $5.08 $5.06 $5.41 $6.24 $6.05 $5.87 $6.47
Salt Lake City, UT $5.64 $5.82 $5.65 $5.37 $5.64 $5.40 $5.16
San Antonio, TX $5.75 $5.79 $6.08 $6.09 $6.14 $5.16 n/a
San Diego, CA $11.88 $12.36 $12.48 $12.72 $12.84 $9.60 $11.40
San Francisco North Bay, CA $11.97 $11.69 $14.87 $15.13 $16.04 $13.36 $12.29
San Francisco Peninsula, CA $16.42 $17.72 $17.62 $16.41 $16.49 $15.25 $19.81
San Jose (Silicon Valley), CA $12.12 $13.20 $13.08 $12.84 $12.96 $11.64 $15.36
Savannah, GA $4.69 $4.62 $4.62 $4.65 $4.65 $4.23 n/a
Seattle, WA $7.45 $7.61 $8.73 $8.79 $8.90 $8.33 $9.54
Southern New Hampshire $5.62 $5.79 $5.92 $5.64 $5.78 $5.01 $5.30
St. Louis, MO $4.62 $4.47 $4.57 $4.86 $4.96 $4.51 $7.60
St. Petersburg/Clearwater, FL $7.99 $8.12 $7.86 $7.67 $8.05 $6.14 $6.28
Suburban MD $9.21 $9.37 $10.02 $10.12 $9.66 $7.92 n/a
Syracuse, NY $4.08 $4.02 $3.94 $3.89 $3.88 $4.41 $3.20
Tampa, FL $5.85 $5.72 $5.74 $5.98 $6.24 $5.29 $4.19
Tucson, AZ $6.37 $6.23 $6.09 $6.08 $6.14 $5.93 $5.24
Tulsa, OK $4.54 $4.54 $4.69 $4.69 $4.77 $4.65 $4.00
MarketBeat U.S. Q3 2018 cushmanwakefield.com | 9
Inventory
Inventory Inventory Deliveries YTD 2018 Under Construction as of Q3 2018p
United States 14,581,399,220 212,408,138 285,378,748
Northeast 2,019,766,829 29,241,187 34,139,843
Midwest 4,017,497,207 41,207,292 65,456,052
South 4,511,156,317 81,976,637 111,326,679
West 4,032,978,867 59,983,022 74,456,174
U.S. Industrial Report Markets Inventory Deliveries YTD 2018 Under Construction as of Q3 2018p
Atlanta, GA 602,344,464 13,676,829 16,832,156
Austin, TX 41,105,170 646,151 2,070,987
Baltimore, MD 208,945,263 3,304,209 3,741,229
Binghamton, NY 17,463,247 0 0
Birmingham, AL 14,730,458 239,500 2,910,000
Boston, MA 146,096,787 472,500 1,336,558
Buffalo, NY 110,052,883 487,035 419,122
Central Valley, CA 128,808,782 4,794,695 10,600,672
Charleston, SC 71,579,555 5,508,135 2,817,499
Charlotte, NC 192,208,756 4,184,120 4,081,512
Chicago, IL 1,207,532,322 9,511,379 16,781,561
Cincinnati, OH 288,378,865 4,687,539 8,854,378
Cleveland, OH 495,499,412 2,871,520 3,413,853
Colorado Springs, CO 31,227,262 0 170,906
Columbus, OH 254,691,996 5,325,301 5,129,550
Dallas/Ft. Worth, TX 734,115,127 19,707,545 19,140,161
Dayton, OH 119,189,224 431,600 1,335,296
Denver, CO 245,260,710 3,294,246 5,122,927
Detroit, MI 538,154,064 2,298,831 5,285,273
El Paso, TX 52,684,401 648,760 797,662
Fort Myers/Naples, FL 41,594,589 197,371 873,785
Fredericksburg, VA 11,887,625 0 0
Ft. Lauderdale, FL 88,782,662 1,042,403 1,584,246
Greenville, SC 197,843,955 707,497 3,553,544
Hampton Roads, VA 98,286,777 50,000 50,000
Hartford, CT 93,012,333 133,200 1,255,000
Houston, TX 431,842,882 7,796,151 10,476,561
Indianapolis, IN 262,583,035 5,026,486 8,974,317
Inland Empire CA 541,478,833 22,086,737 25,052,721
Jacksonville, FL 106,017,415 60,000 1,255,890
Kansas City, MO 219,138,831 3,892,058 5,073,642
Lakeland, FL 32,222,795 1,286,928 1,531,120
Las Vegas, NV 125,892,282 3,209,009 2,954,452
Long Island, NY 133,253,087 90,530 469,052
Los Angeles, CA 1,069,650,328 5,321,551 3,397,347
Louisville, KY 161,777,615 5,068,551 3,685,566
Memphis, TN 193,328,576 4,348,955 2,779,307
Miami, FL 160,123,459 3,264,843 3,852,920
Milwaukee, WI 201,148,949 1,358,791 2,059,565
Minneapolis, MN 110,551,229 1,584,145 2,137,156
MarketBeat U.S. Q3 2018 cushmanwakefield.com | 10
Inventory
Inventory Inventory Deliveries YTD 2018 Under Construction as of Q3 2018p
Nashville, TN 209,666,342 2,736,635 4,523,036
New Haven, CT 47,972,701 80,500 855,000
New Jersey - Central 348,481,617 8,031,287 3,675,610
New Jersey - Northern 286,876,256 1,025,817 1,874,815
Northern VA 61,920,511 344,444 342,541
Oakland/East Bay, CA 206,421,235 1,324,295 5,608,130
Oklahoma City, OK 67,950,001 11,996 0
Omaha, NE 75,308,190 678,254 974,441
Orange County, CA 283,843,779 545,774 1,452,341
Orlando, FL 120,573,000 3,014,229 2,744,870
Palm Beach County, FL 41,477,766 166,392 247,413
PA I-81/I-78 Distribution Corridor 281,683,045 17,291,095 16,732,425
Philadelphia, PA 143,986,315 0 6,802,631
Phoenix, AZ 315,653,104 5,663,055 4,477,624
Pittsburgh, PA 168,651,734 334,848 554,400
Portland, OR 200,691,981 3,915,343 2,591,816
Providence, RI 77,727,305 0 0
Puget Sound - Eastside 61,189,474 411,340 782,213
Raleigh/Durham, NC 53,579,211 136,500 279,600
Richmond, VA 93,148,340 856,707 1,666,649
Roanoke, VA 51,451,418 250,000 0
Rochester, NY 73,551,473 0 0
Sacramento, CA 141,502,247 905,820 919,603
Salt Lake City, UT 124,296,894 2,432,072 3,996,435
San Antonio, TX 39,913,461 344,850 6,486,449
San Diego, CA 164,059,934 1,823,574 2,296,046
San Francisco North Bay, CA 30,734,395 40,000 614,204
San Francisco Peninsula, CA 41,792,226 0 0
San Jose (Silicon Valley), CA 85,631,745 634,118 0
Savannah, GA 56,682,251 1,039,548 10,548,650
Seattle, WA 192,574,576 2,968,431 4,179,803
Southern New Hampshire 48,120,877 1,240,000 0
St. Louis, MO 245,321,090 3,541,388 5,437,020
St. Petersburg/Clearwater, FL 47,910,931 126,000 64,675
Suburban MD 50,196,477 109,043 213,201
Syracuse, NY 42,837,169 54,375 165,230
Tampa, FL 80,837,025 923,017 1,828,370
Tucson, AZ 42,269,080 612,962 238,934
Tulsa, OK 94,428,039 179,328 347,080
p = preliminary
Methodology
Cushman & Wakefield’s quarterly estimates are derived from a variety of data sources, including its own proprietary database, and
historical data from third party data sources. The market statistics are calculated from a base building inventory made up of
industrial properties deemed to be competitive in the local industrial markets. Generally, owner-occupied and federally-owned
buildings are not included. Older buildings unfit for occupancy or ones that require substantial renovation before tenancy are
generally not included in the competitive inventory. The inventory is subject to revisions due to resampling. Vacant space is defined
as space that is available immediately or imminently after the end of the quarter. Sublet space still occupied by the tenant is not
counted as available space. The figures provided for the current quarter are preliminary, and all information contained in the report
is subject to correction of errors and revisions based on additional data received.
Regional Map
West
Midwest
South
Northeast
Jason Tolliver
Head of Logistics & Industrial Research
Americas
Tel: +1 317.639.0549
cushmanwakefield.com
Explanation of Terms
Total Inventory: The total amount of industrial space (in buildings of a
predetermined size by market) that can be rented by a third party.
Overall Vacancy Rate: The amount of unoccupied space (new, relet, and
sublet) expressed as a percentage of total inventory.
Absorption: The net change in occupied space between two points in time.
(Total occupied space in the present quarter minus total occupied space from
the previous quarter, quoted on a net, not gross, basis.)
Leasing Activity: The sum of all leases over a period of time. This includes
pre-leasing activity as well as expansions. It does not include renewals.
Overall Weighted Asking Rents: NNN average asking rents weighted by the
amount of available direct and sublease space in industrial properties.
W/D: Warehouse and or distribution properties.
MFG: Manufacturing properties.
About Cushman & Wakefield
Cushman & Wakefield (NYSE: CWK) is a leading global real estate services firm that
delivers exceptional value by putting ideas into action for real estate occupiers and
owners. Cushman & Wakefield is among the largest real estate services firms with
48,000 employees in approximately 400 offices and 70 countries. In 2017, the
firm had revenue of $6.9 billion across core services of property, facilities and
project management, leasing, capital markets, valuation and other services.
To learn more, visit www.cushmanwakefield.com or follow @CushWake on
Twitter.
©2018 Cushman & Wakefield. All rights reserved. The information contained within this report is gathered from multiple sources believed to be reliable. The information may contain errors or omissions and is presented
without any warranty or representations as to its accuracy.
Carolyn Salzer
Analyst, Logistics & Industrial Research
Americas
Tel: +1 847.518.3212
cushmanwakefield.com

More Related Content

What's hot

C&W Q3 2021 Canadian Cap Rate Report
 C&W Q3 2021 Canadian  Cap Rate Report  C&W Q3 2021 Canadian  Cap Rate Report
C&W Q3 2021 Canadian Cap Rate Report Guy Masse
 
C&W MARKETBEAT- CAPITAL MARKETS Q4 2016 – #CRE #REALESTATE #CCIM #SIOR @YOURT...
C&W MARKETBEAT- CAPITAL MARKETS Q4 2016 – #CRE #REALESTATE #CCIM #SIOR @YOURT...C&W MARKETBEAT- CAPITAL MARKETS Q4 2016 – #CRE #REALESTATE #CCIM #SIOR @YOURT...
C&W MARKETBEAT- CAPITAL MARKETS Q4 2016 – #CRE #REALESTATE #CCIM #SIOR @YOURT...Guy Masse
 
Marcu & Millichap 2016 U.S. MULTIFAMILY INVESTMENT FORECAST
Marcu & Millichap 2016 U.S. MULTIFAMILY INVESTMENT FORECASTMarcu & Millichap 2016 U.S. MULTIFAMILY INVESTMENT FORECAST
Marcu & Millichap 2016 U.S. MULTIFAMILY INVESTMENT FORECASTWayne Michael Mumford
 
Canada M&A Insights - March 2017
Canada M&A Insights - March 2017Canada M&A Insights - March 2017
Canada M&A Insights - March 2017Duff & Phelps
 
Capital Markets Industry Insights - Q1 2016
Capital Markets Industry Insights - Q1 2016Capital Markets Industry Insights - Q1 2016
Capital Markets Industry Insights - Q1 2016Duff & Phelps
 
Capital Markets Industry Insights - Fall 2016
Capital Markets Industry Insights - Fall 2016Capital Markets Industry Insights - Fall 2016
Capital Markets Industry Insights - Fall 2016Duff & Phelps
 
Capital Markets Insights - Q2 2016
Capital Markets Insights - Q2 2016Capital Markets Insights - Q2 2016
Capital Markets Insights - Q2 2016Duff & Phelps
 
Valuation Insights - Q3 2016
Valuation Insights - Q3 2016Valuation Insights - Q3 2016
Valuation Insights - Q3 2016Duff & Phelps
 
Boston_SNH_YearEnd2001
Boston_SNH_YearEnd2001Boston_SNH_YearEnd2001
Boston_SNH_YearEnd2001Bonnie Roberts
 
Capital Markets Insights - Q4 2016
Capital Markets Insights - Q4 2016Capital Markets Insights - Q4 2016
Capital Markets Insights - Q4 2016Duff & Phelps
 
Duff Phelps Valuation Insights Q1 2017
Duff Phelps Valuation Insights Q1 2017Duff Phelps Valuation Insights Q1 2017
Duff Phelps Valuation Insights Q1 2017Duff & Phelps
 
Digital ad spends trend 2015 2016
Digital ad spends trend 2015 2016Digital ad spends trend 2015 2016
Digital ad spends trend 2015 2016Manish Chugh
 
2019 Q4 Industrial St. Louis Report Colliers
2019 Q4 Industrial St. Louis Report Colliers2019 Q4 Industrial St. Louis Report Colliers
2019 Q4 Industrial St. Louis Report ColliersColliersSTL
 
Office fall2010 final
Office fall2010 finalOffice fall2010 final
Office fall2010 finalChris Fyvie
 
us industrial market beat snapshot_q12016
us industrial market beat snapshot_q12016us industrial market beat snapshot_q12016
us industrial market beat snapshot_q12016Matthew Marshall
 

What's hot (20)

C&W Q3 2021 Canadian Cap Rate Report
 C&W Q3 2021 Canadian  Cap Rate Report  C&W Q3 2021 Canadian  Cap Rate Report
C&W Q3 2021 Canadian Cap Rate Report
 
C&W MARKETBEAT- CAPITAL MARKETS Q4 2016 – #CRE #REALESTATE #CCIM #SIOR @YOURT...
C&W MARKETBEAT- CAPITAL MARKETS Q4 2016 – #CRE #REALESTATE #CCIM #SIOR @YOURT...C&W MARKETBEAT- CAPITAL MARKETS Q4 2016 – #CRE #REALESTATE #CCIM #SIOR @YOURT...
C&W MARKETBEAT- CAPITAL MARKETS Q4 2016 – #CRE #REALESTATE #CCIM #SIOR @YOURT...
 
National 1Q15
National 1Q15National 1Q15
National 1Q15
 
Marcu & Millichap 2016 U.S. MULTIFAMILY INVESTMENT FORECAST
Marcu & Millichap 2016 U.S. MULTIFAMILY INVESTMENT FORECASTMarcu & Millichap 2016 U.S. MULTIFAMILY INVESTMENT FORECAST
Marcu & Millichap 2016 U.S. MULTIFAMILY INVESTMENT FORECAST
 
Canada M&A Insights - March 2017
Canada M&A Insights - March 2017Canada M&A Insights - March 2017
Canada M&A Insights - March 2017
 
Global Insight
Global Insight Global Insight
Global Insight
 
Capital Markets Industry Insights - Q1 2016
Capital Markets Industry Insights - Q1 2016Capital Markets Industry Insights - Q1 2016
Capital Markets Industry Insights - Q1 2016
 
Capital Markets Industry Insights - Fall 2016
Capital Markets Industry Insights - Fall 2016Capital Markets Industry Insights - Fall 2016
Capital Markets Industry Insights - Fall 2016
 
2018 used car market report
2018 used car market report2018 used car market report
2018 used car market report
 
Capital Markets Insights - Q2 2016
Capital Markets Insights - Q2 2016Capital Markets Insights - Q2 2016
Capital Markets Insights - Q2 2016
 
Valuation Insights - Q3 2016
Valuation Insights - Q3 2016Valuation Insights - Q3 2016
Valuation Insights - Q3 2016
 
Boston_SNH_YearEnd2001
Boston_SNH_YearEnd2001Boston_SNH_YearEnd2001
Boston_SNH_YearEnd2001
 
Capital Markets Insights - Q4 2016
Capital Markets Insights - Q4 2016Capital Markets Insights - Q4 2016
Capital Markets Insights - Q4 2016
 
Econ 231 Essay
Econ 231 EssayEcon 231 Essay
Econ 231 Essay
 
Duff Phelps Valuation Insights Q1 2017
Duff Phelps Valuation Insights Q1 2017Duff Phelps Valuation Insights Q1 2017
Duff Phelps Valuation Insights Q1 2017
 
Digital ad spends trend 2015 2016
Digital ad spends trend 2015 2016Digital ad spends trend 2015 2016
Digital ad spends trend 2015 2016
 
2019 Q4 Industrial St. Louis Report Colliers
2019 Q4 Industrial St. Louis Report Colliers2019 Q4 Industrial St. Louis Report Colliers
2019 Q4 Industrial St. Louis Report Colliers
 
Q3 2013 Houston Office Market Research Report
Q3 2013 Houston Office Market Research ReportQ3 2013 Houston Office Market Research Report
Q3 2013 Houston Office Market Research Report
 
Office fall2010 final
Office fall2010 finalOffice fall2010 final
Office fall2010 final
 
us industrial market beat snapshot_q12016
us industrial market beat snapshot_q12016us industrial market beat snapshot_q12016
us industrial market beat snapshot_q12016
 

Similar to U.S. Industrial Market Insights for Q3 2018

C&W MARKETBEAT- U.S INDUSTRIAL Q4 2016 – #CRE #REALESTATE #CCIM #SIOR
C&W MARKETBEAT- U.S INDUSTRIAL Q4 2016 – #CRE #REALESTATE #CCIM #SIORC&W MARKETBEAT- U.S INDUSTRIAL Q4 2016 – #CRE #REALESTATE #CCIM #SIOR
C&W MARKETBEAT- U.S INDUSTRIAL Q4 2016 – #CRE #REALESTATE #CCIM #SIORGuy Masse
 
Q1 - 2015 North American Industrial Highlights
Q1 - 2015 North American Industrial HighlightsQ1 - 2015 North American Industrial Highlights
Q1 - 2015 North American Industrial HighlightsCoy Davidson
 
C&W MARKETBEAT- U.S OFFICE Q4 2016 – #CRE #REALESTATE
C&W MARKETBEAT- U.S OFFICE Q4 2016 – #CRE #REALESTATEC&W MARKETBEAT- U.S OFFICE Q4 2016 – #CRE #REALESTATE
C&W MARKETBEAT- U.S OFFICE Q4 2016 – #CRE #REALESTATEGuy Masse
 
U.S. Office market statistics, trends and outlook: Q3 2015
U.S. Office market statistics, trends and outlook: Q3 2015U.S. Office market statistics, trends and outlook: Q3 2015
U.S. Office market statistics, trends and outlook: Q3 2015JLL
 
Q2 2105 North American Industrial Highligts
Q2 2105 North American Industrial HighligtsQ2 2105 North American Industrial Highligts
Q2 2105 North American Industrial HighligtsCoy Davidson
 
Single Tenant Net Lease Cap Rate Research Report
Single Tenant Net Lease Cap Rate Research ReportSingle Tenant Net Lease Cap Rate Research Report
Single Tenant Net Lease Cap Rate Research ReportThe Boulder Group
 
4Q_2015_RetailReport_email
4Q_2015_RetailReport_email4Q_2015_RetailReport_email
4Q_2015_RetailReport_emailPatrick Anthon
 
Cushman & Wakefield's Americas Market Beat~ Industrial Philadelphia q32016
Cushman & Wakefield's Americas Market Beat~ Industrial Philadelphia q32016Cushman & Wakefield's Americas Market Beat~ Industrial Philadelphia q32016
Cushman & Wakefield's Americas Market Beat~ Industrial Philadelphia q32016Matthew Marshall
 
2014 Q4 NORTH AMERICAN INDUSTRIAL HIGHLIGHTS
2014 Q4 NORTH AMERICAN INDUSTRIAL HIGHLIGHTS2014 Q4 NORTH AMERICAN INDUSTRIAL HIGHLIGHTS
2014 Q4 NORTH AMERICAN INDUSTRIAL HIGHLIGHTSCoy Davidson
 
JLL Detroit Industrial Insight & Statistics - Q2 2016
JLL Detroit Industrial Insight & Statistics - Q2 2016JLL Detroit Industrial Insight & Statistics - Q2 2016
JLL Detroit Industrial Insight & Statistics - Q2 2016Aaron Moore
 
Cox Automotive Market Insight Overview September 2019
Cox Automotive Market Insight Overview   September 2019  Cox Automotive Market Insight Overview   September 2019
Cox Automotive Market Insight Overview September 2019 Philip Nothard
 
JLL West Michigan Industrial Insight & Statistics - Q3 2018
JLL West Michigan Industrial Insight & Statistics - Q3 2018JLL West Michigan Industrial Insight & Statistics - Q3 2018
JLL West Michigan Industrial Insight & Statistics - Q3 2018Harrison West
 
Austin’s industrial market closes 2018 with new buildings and high absorption
Austin’s industrial market closes 2018 with new buildings and high absorptionAustin’s industrial market closes 2018 with new buildings and high absorption
Austin’s industrial market closes 2018 with new buildings and high absorptionColliers International | Houston
 
US_Office_MarketBeat_Q4-2020 (1).pdf
US_Office_MarketBeat_Q4-2020 (1).pdfUS_Office_MarketBeat_Q4-2020 (1).pdf
US_Office_MarketBeat_Q4-2020 (1).pdfRavneetSehmbi
 
Economic Outlook Real Estate
Economic Outlook Real EstateEconomic Outlook Real Estate
Economic Outlook Real EstateShay Moser
 
Atlanta Q4 Market Update - Office
Atlanta Q4 Market Update - Office Atlanta Q4 Market Update - Office
Atlanta Q4 Market Update - Office James Koontz
 

Similar to U.S. Industrial Market Insights for Q3 2018 (20)

C&W MARKETBEAT- U.S INDUSTRIAL Q4 2016 – #CRE #REALESTATE #CCIM #SIOR
C&W MARKETBEAT- U.S INDUSTRIAL Q4 2016 – #CRE #REALESTATE #CCIM #SIORC&W MARKETBEAT- U.S INDUSTRIAL Q4 2016 – #CRE #REALESTATE #CCIM #SIOR
C&W MARKETBEAT- U.S INDUSTRIAL Q4 2016 – #CRE #REALESTATE #CCIM #SIOR
 
Q1 - 2015 North American Industrial Highlights
Q1 - 2015 North American Industrial HighlightsQ1 - 2015 North American Industrial Highlights
Q1 - 2015 North American Industrial Highlights
 
Mergermarket2018
Mergermarket2018Mergermarket2018
Mergermarket2018
 
M&A Q1-Q3 2018
M&A Q1-Q3 2018M&A Q1-Q3 2018
M&A Q1-Q3 2018
 
C&W MARKETBEAT- U.S OFFICE Q4 2016 – #CRE #REALESTATE
C&W MARKETBEAT- U.S OFFICE Q4 2016 – #CRE #REALESTATEC&W MARKETBEAT- U.S OFFICE Q4 2016 – #CRE #REALESTATE
C&W MARKETBEAT- U.S OFFICE Q4 2016 – #CRE #REALESTATE
 
U.S. Office market statistics, trends and outlook: Q3 2015
U.S. Office market statistics, trends and outlook: Q3 2015U.S. Office market statistics, trends and outlook: Q3 2015
U.S. Office market statistics, trends and outlook: Q3 2015
 
Q2 2105 North American Industrial Highligts
Q2 2105 North American Industrial HighligtsQ2 2105 North American Industrial Highligts
Q2 2105 North American Industrial Highligts
 
Mergermarket financialleaguetablereport.h12018
Mergermarket financialleaguetablereport.h12018Mergermarket financialleaguetablereport.h12018
Mergermarket financialleaguetablereport.h12018
 
Single Tenant Net Lease Cap Rate Research Report
Single Tenant Net Lease Cap Rate Research ReportSingle Tenant Net Lease Cap Rate Research Report
Single Tenant Net Lease Cap Rate Research Report
 
4Q_2015_RetailReport_email
4Q_2015_RetailReport_email4Q_2015_RetailReport_email
4Q_2015_RetailReport_email
 
Cushman & Wakefield's Americas Market Beat~ Industrial Philadelphia q32016
Cushman & Wakefield's Americas Market Beat~ Industrial Philadelphia q32016Cushman & Wakefield's Americas Market Beat~ Industrial Philadelphia q32016
Cushman & Wakefield's Americas Market Beat~ Industrial Philadelphia q32016
 
2014 Q4 NORTH AMERICAN INDUSTRIAL HIGHLIGHTS
2014 Q4 NORTH AMERICAN INDUSTRIAL HIGHLIGHTS2014 Q4 NORTH AMERICAN INDUSTRIAL HIGHLIGHTS
2014 Q4 NORTH AMERICAN INDUSTRIAL HIGHLIGHTS
 
JLL Detroit Industrial Insight & Statistics - Q2 2016
JLL Detroit Industrial Insight & Statistics - Q2 2016JLL Detroit Industrial Insight & Statistics - Q2 2016
JLL Detroit Industrial Insight & Statistics - Q2 2016
 
Cox Automotive Market Insight Overview September 2019
Cox Automotive Market Insight Overview   September 2019  Cox Automotive Market Insight Overview   September 2019
Cox Automotive Market Insight Overview September 2019
 
JLL West Michigan Industrial Insight & Statistics - Q3 2018
JLL West Michigan Industrial Insight & Statistics - Q3 2018JLL West Michigan Industrial Insight & Statistics - Q3 2018
JLL West Michigan Industrial Insight & Statistics - Q3 2018
 
Global & Regional M&A Report 2019
Global & Regional M&A Report 2019Global & Regional M&A Report 2019
Global & Regional M&A Report 2019
 
Austin’s industrial market closes 2018 with new buildings and high absorption
Austin’s industrial market closes 2018 with new buildings and high absorptionAustin’s industrial market closes 2018 with new buildings and high absorption
Austin’s industrial market closes 2018 with new buildings and high absorption
 
US_Office_MarketBeat_Q4-2020 (1).pdf
US_Office_MarketBeat_Q4-2020 (1).pdfUS_Office_MarketBeat_Q4-2020 (1).pdf
US_Office_MarketBeat_Q4-2020 (1).pdf
 
Economic Outlook Real Estate
Economic Outlook Real EstateEconomic Outlook Real Estate
Economic Outlook Real Estate
 
Atlanta Q4 Market Update - Office
Atlanta Q4 Market Update - Office Atlanta Q4 Market Update - Office
Atlanta Q4 Market Update - Office
 

More from Guy Masse

North America Industrial Construction Cost Guide 2023
North America Industrial Construction Cost Guide 2023North America Industrial Construction Cost Guide 2023
North America Industrial Construction Cost Guide 2023Guy Masse
 
Cushman &Wakefield Canadian-Employment-Report.pdf
 Cushman &Wakefield Canadian-Employment-Report.pdf Cushman &Wakefield Canadian-Employment-Report.pdf
Cushman &Wakefield Canadian-Employment-Report.pdfGuy Masse
 
C&W Greater Montreal Area Industrial Scorecard - Q1 2021
C&W Greater Montreal Area  Industrial Scorecard - Q1 2021 C&W Greater Montreal Area  Industrial Scorecard - Q1 2021
C&W Greater Montreal Area Industrial Scorecard - Q1 2021 Guy Masse
 
C&W Greater Montreal Area Office Scorecard - Q1 2021
C&W Greater Montreal Area Office Scorecard - Q1 2021C&W Greater Montreal Area Office Scorecard - Q1 2021
C&W Greater Montreal Area Office Scorecard - Q1 2021Guy Masse
 
Cushman & Wakefield Toronto Americas Marketbeat Office Q1 2019
Cushman & Wakefield Toronto Americas Marketbeat Office Q1 2019 Cushman & Wakefield Toronto Americas Marketbeat Office Q1 2019
Cushman & Wakefield Toronto Americas Marketbeat Office Q1 2019 Guy Masse
 
Cushman & Wakefield Montreal Americas Marketbeat Office Q12019 #CRE #RealEstate
Cushman & Wakefield Montreal Americas Marketbeat Office Q12019  #CRE #RealEstateCushman & Wakefield Montreal Americas Marketbeat Office Q12019  #CRE #RealEstate
Cushman & Wakefield Montreal Americas Marketbeat Office Q12019 #CRE #RealEstateGuy Masse
 
C&W-Canadian Office Stats -Q1 2019 - #cre #realestate
 C&W-Canadian Office Stats -Q1 2019 - #cre #realestate C&W-Canadian Office Stats -Q1 2019 - #cre #realestate
C&W-Canadian Office Stats -Q1 2019 - #cre #realestateGuy Masse
 
Headquarters Lessons Learned - Cushman & Wakefield Report #CRE #RealEstate
Headquarters Lessons Learned - Cushman & Wakefield Report #CRE #RealEstateHeadquarters Lessons Learned - Cushman & Wakefield Report #CRE #RealEstate
Headquarters Lessons Learned - Cushman & Wakefield Report #CRE #RealEstateGuy Masse
 
Cushman & Wakefield's Canadian Office Statistical Summary Q4 2018
Cushman & Wakefield's Canadian Office Statistical Summary Q4 2018Cushman & Wakefield's Canadian Office Statistical Summary Q4 2018
Cushman & Wakefield's Canadian Office Statistical Summary Q4 2018Guy Masse
 
C&W REAL ESTATE MARKET REPORTS : WORKPLACE 2025 #CRE
C&W REAL ESTATE MARKET REPORTS : WORKPLACE 2025 #CREC&W REAL ESTATE MARKET REPORTS : WORKPLACE 2025 #CRE
C&W REAL ESTATE MARKET REPORTS : WORKPLACE 2025 #CREGuy Masse
 
Cushman & Wakefield Q12018 Canadian Office Statistical Summary
 Cushman & Wakefield Q12018 Canadian Office Statistical Summary Cushman & Wakefield Q12018 Canadian Office Statistical Summary
Cushman & Wakefield Q12018 Canadian Office Statistical SummaryGuy Masse
 
90,000 SF OF CLASS A OFFICE SPACE FOR SUBLEASE
90,000 SF OF CLASS A OFFICE SPACE  FOR SUBLEASE90,000 SF OF CLASS A OFFICE SPACE  FOR SUBLEASE
90,000 SF OF CLASS A OFFICE SPACE FOR SUBLEASEGuy Masse
 
Trump100 days- Implications for the Property Markets
Trump100 days-  Implications for the Property Markets Trump100 days-  Implications for the Property Markets
Trump100 days- Implications for the Property Markets Guy Masse
 
C&W MARKETBEAT- RETAIL Q4 2016 – #CRE #REALESTATE #CCIM #SIOR @YOURTENANTREP
C&W MARKETBEAT- RETAIL Q4 2016 – #CRE #REALESTATE #CCIM #SIOR @YOURTENANTREPC&W MARKETBEAT- RETAIL Q4 2016 – #CRE #REALESTATE #CCIM #SIOR @YOURTENANTREP
C&W MARKETBEAT- RETAIL Q4 2016 – #CRE #REALESTATE #CCIM #SIOR @YOURTENANTREPGuy Masse
 
Cushman & Wakefield Atlas outlook 2016
Cushman & Wakefield Atlas outlook 2016Cushman & Wakefield Atlas outlook 2016
Cushman & Wakefield Atlas outlook 2016Guy Masse
 
WINNING IN GROWTH CITIES /ACushman & Wakefield Capital Markets Research Publi...
WINNING IN GROWTH CITIES /ACushman & Wakefield Capital Markets Research Publi...WINNING IN GROWTH CITIES /ACushman & Wakefield Capital Markets Research Publi...
WINNING IN GROWTH CITIES /ACushman & Wakefield Capital Markets Research Publi...Guy Masse
 
Cw global office forecast 2014-2015
Cw global office forecast 2014-2015Cw global office forecast 2014-2015
Cw global office forecast 2014-2015Guy Masse
 
Workplace Transformation Survey - A Global View of Workplace Change
Workplace Transformation Survey - A Global View of Workplace Change Workplace Transformation Survey - A Global View of Workplace Change
Workplace Transformation Survey - A Global View of Workplace Change Guy Masse
 

More from Guy Masse (18)

North America Industrial Construction Cost Guide 2023
North America Industrial Construction Cost Guide 2023North America Industrial Construction Cost Guide 2023
North America Industrial Construction Cost Guide 2023
 
Cushman &Wakefield Canadian-Employment-Report.pdf
 Cushman &Wakefield Canadian-Employment-Report.pdf Cushman &Wakefield Canadian-Employment-Report.pdf
Cushman &Wakefield Canadian-Employment-Report.pdf
 
C&W Greater Montreal Area Industrial Scorecard - Q1 2021
C&W Greater Montreal Area  Industrial Scorecard - Q1 2021 C&W Greater Montreal Area  Industrial Scorecard - Q1 2021
C&W Greater Montreal Area Industrial Scorecard - Q1 2021
 
C&W Greater Montreal Area Office Scorecard - Q1 2021
C&W Greater Montreal Area Office Scorecard - Q1 2021C&W Greater Montreal Area Office Scorecard - Q1 2021
C&W Greater Montreal Area Office Scorecard - Q1 2021
 
Cushman & Wakefield Toronto Americas Marketbeat Office Q1 2019
Cushman & Wakefield Toronto Americas Marketbeat Office Q1 2019 Cushman & Wakefield Toronto Americas Marketbeat Office Q1 2019
Cushman & Wakefield Toronto Americas Marketbeat Office Q1 2019
 
Cushman & Wakefield Montreal Americas Marketbeat Office Q12019 #CRE #RealEstate
Cushman & Wakefield Montreal Americas Marketbeat Office Q12019  #CRE #RealEstateCushman & Wakefield Montreal Americas Marketbeat Office Q12019  #CRE #RealEstate
Cushman & Wakefield Montreal Americas Marketbeat Office Q12019 #CRE #RealEstate
 
C&W-Canadian Office Stats -Q1 2019 - #cre #realestate
 C&W-Canadian Office Stats -Q1 2019 - #cre #realestate C&W-Canadian Office Stats -Q1 2019 - #cre #realestate
C&W-Canadian Office Stats -Q1 2019 - #cre #realestate
 
Headquarters Lessons Learned - Cushman & Wakefield Report #CRE #RealEstate
Headquarters Lessons Learned - Cushman & Wakefield Report #CRE #RealEstateHeadquarters Lessons Learned - Cushman & Wakefield Report #CRE #RealEstate
Headquarters Lessons Learned - Cushman & Wakefield Report #CRE #RealEstate
 
Cushman & Wakefield's Canadian Office Statistical Summary Q4 2018
Cushman & Wakefield's Canadian Office Statistical Summary Q4 2018Cushman & Wakefield's Canadian Office Statistical Summary Q4 2018
Cushman & Wakefield's Canadian Office Statistical Summary Q4 2018
 
C&W REAL ESTATE MARKET REPORTS : WORKPLACE 2025 #CRE
C&W REAL ESTATE MARKET REPORTS : WORKPLACE 2025 #CREC&W REAL ESTATE MARKET REPORTS : WORKPLACE 2025 #CRE
C&W REAL ESTATE MARKET REPORTS : WORKPLACE 2025 #CRE
 
Cushman & Wakefield Q12018 Canadian Office Statistical Summary
 Cushman & Wakefield Q12018 Canadian Office Statistical Summary Cushman & Wakefield Q12018 Canadian Office Statistical Summary
Cushman & Wakefield Q12018 Canadian Office Statistical Summary
 
90,000 SF OF CLASS A OFFICE SPACE FOR SUBLEASE
90,000 SF OF CLASS A OFFICE SPACE  FOR SUBLEASE90,000 SF OF CLASS A OFFICE SPACE  FOR SUBLEASE
90,000 SF OF CLASS A OFFICE SPACE FOR SUBLEASE
 
Trump100 days- Implications for the Property Markets
Trump100 days-  Implications for the Property Markets Trump100 days-  Implications for the Property Markets
Trump100 days- Implications for the Property Markets
 
C&W MARKETBEAT- RETAIL Q4 2016 – #CRE #REALESTATE #CCIM #SIOR @YOURTENANTREP
C&W MARKETBEAT- RETAIL Q4 2016 – #CRE #REALESTATE #CCIM #SIOR @YOURTENANTREPC&W MARKETBEAT- RETAIL Q4 2016 – #CRE #REALESTATE #CCIM #SIOR @YOURTENANTREP
C&W MARKETBEAT- RETAIL Q4 2016 – #CRE #REALESTATE #CCIM #SIOR @YOURTENANTREP
 
Cushman & Wakefield Atlas outlook 2016
Cushman & Wakefield Atlas outlook 2016Cushman & Wakefield Atlas outlook 2016
Cushman & Wakefield Atlas outlook 2016
 
WINNING IN GROWTH CITIES /ACushman & Wakefield Capital Markets Research Publi...
WINNING IN GROWTH CITIES /ACushman & Wakefield Capital Markets Research Publi...WINNING IN GROWTH CITIES /ACushman & Wakefield Capital Markets Research Publi...
WINNING IN GROWTH CITIES /ACushman & Wakefield Capital Markets Research Publi...
 
Cw global office forecast 2014-2015
Cw global office forecast 2014-2015Cw global office forecast 2014-2015
Cw global office forecast 2014-2015
 
Workplace Transformation Survey - A Global View of Workplace Change
Workplace Transformation Survey - A Global View of Workplace Change Workplace Transformation Survey - A Global View of Workplace Change
Workplace Transformation Survey - A Global View of Workplace Change
 

Recently uploaded

SVN Live 4.22.24 Weekly Property Broadcast
SVN Live 4.22.24 Weekly Property BroadcastSVN Live 4.22.24 Weekly Property Broadcast
SVN Live 4.22.24 Weekly Property BroadcastSVN International Corp.
 
What Is Biophilic Design .pdf
What Is Biophilic Design            .pdfWhat Is Biophilic Design            .pdf
What Is Biophilic Design .pdfyamunaNMH
 
Rustomjee The Panorama At Pali Hill, Bandra West, Mumbai - Brochure.pdf
Rustomjee The Panorama At Pali Hill, Bandra West, Mumbai - Brochure.pdfRustomjee The Panorama At Pali Hill, Bandra West, Mumbai - Brochure.pdf
Rustomjee The Panorama At Pali Hill, Bandra West, Mumbai - Brochure.pdfmonikasharma630
 
Call Girls in Kashmiri Gate Delhi 💯Call Us 🔝8264348440🔝
Call Girls in Kashmiri Gate Delhi 💯Call Us 🔝8264348440🔝Call Girls in Kashmiri Gate Delhi 💯Call Us 🔝8264348440🔝
Call Girls in Kashmiri Gate Delhi 💯Call Us 🔝8264348440🔝soniya singh
 
Call Girls In Mayur Vihar-1 Delhi ❤️8860477959 Good Looking Escorts In 24/7 D...
Call Girls In Mayur Vihar-1 Delhi ❤️8860477959 Good Looking Escorts In 24/7 D...Call Girls In Mayur Vihar-1 Delhi ❤️8860477959 Good Looking Escorts In 24/7 D...
Call Girls In Mayur Vihar-1 Delhi ❤️8860477959 Good Looking Escorts In 24/7 D...lizamodels9
 
Call Girls in Pitampura Delhi 💯Call Us 🔝8264348440🔝
Call Girls in Pitampura Delhi 💯Call Us 🔝8264348440🔝Call Girls in Pitampura Delhi 💯Call Us 🔝8264348440🔝
Call Girls in Pitampura Delhi 💯Call Us 🔝8264348440🔝soniya singh
 
Listing Turkey Sylvana Istanbul - Bahcesehir
Listing Turkey Sylvana Istanbul - BahcesehirListing Turkey Sylvana Istanbul - Bahcesehir
Listing Turkey Sylvana Istanbul - BahcesehirListing Turkey
 
Shapoorji Pallonji Parkwest Sequoia Tower Bangalore.pdf
Shapoorji Pallonji Parkwest Sequoia Tower Bangalore.pdfShapoorji Pallonji Parkwest Sequoia Tower Bangalore.pdf
Shapoorji Pallonji Parkwest Sequoia Tower Bangalore.pdfashiyadav24
 
9990771857 Call Girls in Noida Sector 1 Noida (Call Girls) Delhi
9990771857 Call Girls in Noida Sector 1 Noida (Call Girls) Delhi9990771857 Call Girls in Noida Sector 1 Noida (Call Girls) Delhi
9990771857 Call Girls in Noida Sector 1 Noida (Call Girls) Delhidelhimodel235
 
How to Build Multifamily and Laneway Suites in Toronto!! (feat. Expert Archi...
How to Build Multifamily and Laneway Suites  in Toronto!! (feat. Expert Archi...How to Build Multifamily and Laneway Suites  in Toronto!! (feat. Expert Archi...
How to Build Multifamily and Laneway Suites in Toronto!! (feat. Expert Archi...Volition Properties
 
)_Call Girls In Radisson Blu Plaza Hotel, Delhi Airport ❤️8860477959 _Indepen...
)_Call Girls In Radisson Blu Plaza Hotel, Delhi Airport ❤️8860477959 _Indepen...)_Call Girls In Radisson Blu Plaza Hotel, Delhi Airport ❤️8860477959 _Indepen...
)_Call Girls In Radisson Blu Plaza Hotel, Delhi Airport ❤️8860477959 _Indepen...lizamodels9
 
9990771857 Call Girls in Noida Sector 03 Noida (Call Girls) Delhi
9990771857 Call Girls in Noida Sector 03 Noida (Call Girls) Delhi9990771857 Call Girls in Noida Sector 03 Noida (Call Girls) Delhi
9990771857 Call Girls in Noida Sector 03 Noida (Call Girls) Delhidelhimodel235
 
The Omaxe State Dwarka Delhi-broucher.pdf.pdf
The Omaxe State Dwarka Delhi-broucher.pdf.pdfThe Omaxe State Dwarka Delhi-broucher.pdf.pdf
The Omaxe State Dwarka Delhi-broucher.pdf.pdfkratirudram
 
Purva Palm Hills Devanahalli, Bangalore E- Brochure.pdf
Purva Palm Hills Devanahalli, Bangalore E- Brochure.pdfPurva Palm Hills Devanahalli, Bangalore E- Brochure.pdf
Purva Palm Hills Devanahalli, Bangalore E- Brochure.pdffaheemali990101
 
Cashpay_Call Girls In Gaur City Mall Noida ❤️8860477959 Escorts Service In 24...
Cashpay_Call Girls In Gaur City Mall Noida ❤️8860477959 Escorts Service In 24...Cashpay_Call Girls In Gaur City Mall Noida ❤️8860477959 Escorts Service In 24...
Cashpay_Call Girls In Gaur City Mall Noida ❤️8860477959 Escorts Service In 24...lizamodels9
 
Call Girls in Model Town Delhi 💯Call Us 🔝8264348440🔝
Call Girls in Model Town Delhi 💯Call Us 🔝8264348440🔝Call Girls in Model Town Delhi 💯Call Us 🔝8264348440🔝
Call Girls in Model Town Delhi 💯Call Us 🔝8264348440🔝soniya singh
 
Sobha Aranya Sector 80 Gurgaon E- Brochure.pdf
Sobha Aranya Sector 80 Gurgaon E- Brochure.pdfSobha Aranya Sector 80 Gurgaon E- Brochure.pdf
Sobha Aranya Sector 80 Gurgaon E- Brochure.pdffaheemali990101
 
Nanke Area Estate commercial ( Dir. Kat Kuo)
Nanke Area Estate commercial ( Dir. Kat Kuo)Nanke Area Estate commercial ( Dir. Kat Kuo)
Nanke Area Estate commercial ( Dir. Kat Kuo)jessica288382
 

Recently uploaded (20)

SVN Live 4.22.24 Weekly Property Broadcast
SVN Live 4.22.24 Weekly Property BroadcastSVN Live 4.22.24 Weekly Property Broadcast
SVN Live 4.22.24 Weekly Property Broadcast
 
Call Girls in Mahavir Nagar whatsaap call US +919953056974
Call Girls in Mahavir Nagar  whatsaap call US  +919953056974Call Girls in Mahavir Nagar  whatsaap call US  +919953056974
Call Girls in Mahavir Nagar whatsaap call US +919953056974
 
What Is Biophilic Design .pdf
What Is Biophilic Design            .pdfWhat Is Biophilic Design            .pdf
What Is Biophilic Design .pdf
 
Rustomjee The Panorama At Pali Hill, Bandra West, Mumbai - Brochure.pdf
Rustomjee The Panorama At Pali Hill, Bandra West, Mumbai - Brochure.pdfRustomjee The Panorama At Pali Hill, Bandra West, Mumbai - Brochure.pdf
Rustomjee The Panorama At Pali Hill, Bandra West, Mumbai - Brochure.pdf
 
Call Girls in Kashmiri Gate Delhi 💯Call Us 🔝8264348440🔝
Call Girls in Kashmiri Gate Delhi 💯Call Us 🔝8264348440🔝Call Girls in Kashmiri Gate Delhi 💯Call Us 🔝8264348440🔝
Call Girls in Kashmiri Gate Delhi 💯Call Us 🔝8264348440🔝
 
Call Girls In Mayur Vihar-1 Delhi ❤️8860477959 Good Looking Escorts In 24/7 D...
Call Girls In Mayur Vihar-1 Delhi ❤️8860477959 Good Looking Escorts In 24/7 D...Call Girls In Mayur Vihar-1 Delhi ❤️8860477959 Good Looking Escorts In 24/7 D...
Call Girls In Mayur Vihar-1 Delhi ❤️8860477959 Good Looking Escorts In 24/7 D...
 
Call Girls in Pitampura Delhi 💯Call Us 🔝8264348440🔝
Call Girls in Pitampura Delhi 💯Call Us 🔝8264348440🔝Call Girls in Pitampura Delhi 💯Call Us 🔝8264348440🔝
Call Girls in Pitampura Delhi 💯Call Us 🔝8264348440🔝
 
Listing Turkey Sylvana Istanbul - Bahcesehir
Listing Turkey Sylvana Istanbul - BahcesehirListing Turkey Sylvana Istanbul - Bahcesehir
Listing Turkey Sylvana Istanbul - Bahcesehir
 
Shapoorji Pallonji Parkwest Sequoia Tower Bangalore.pdf
Shapoorji Pallonji Parkwest Sequoia Tower Bangalore.pdfShapoorji Pallonji Parkwest Sequoia Tower Bangalore.pdf
Shapoorji Pallonji Parkwest Sequoia Tower Bangalore.pdf
 
9990771857 Call Girls in Noida Sector 1 Noida (Call Girls) Delhi
9990771857 Call Girls in Noida Sector 1 Noida (Call Girls) Delhi9990771857 Call Girls in Noida Sector 1 Noida (Call Girls) Delhi
9990771857 Call Girls in Noida Sector 1 Noida (Call Girls) Delhi
 
How to Build Multifamily and Laneway Suites in Toronto!! (feat. Expert Archi...
How to Build Multifamily and Laneway Suites  in Toronto!! (feat. Expert Archi...How to Build Multifamily and Laneway Suites  in Toronto!! (feat. Expert Archi...
How to Build Multifamily and Laneway Suites in Toronto!! (feat. Expert Archi...
 
)_Call Girls In Radisson Blu Plaza Hotel, Delhi Airport ❤️8860477959 _Indepen...
)_Call Girls In Radisson Blu Plaza Hotel, Delhi Airport ❤️8860477959 _Indepen...)_Call Girls In Radisson Blu Plaza Hotel, Delhi Airport ❤️8860477959 _Indepen...
)_Call Girls In Radisson Blu Plaza Hotel, Delhi Airport ❤️8860477959 _Indepen...
 
9990771857 Call Girls in Noida Sector 03 Noida (Call Girls) Delhi
9990771857 Call Girls in Noida Sector 03 Noida (Call Girls) Delhi9990771857 Call Girls in Noida Sector 03 Noida (Call Girls) Delhi
9990771857 Call Girls in Noida Sector 03 Noida (Call Girls) Delhi
 
The Omaxe State Dwarka Delhi-broucher.pdf.pdf
The Omaxe State Dwarka Delhi-broucher.pdf.pdfThe Omaxe State Dwarka Delhi-broucher.pdf.pdf
The Omaxe State Dwarka Delhi-broucher.pdf.pdf
 
Purva Palm Hills Devanahalli, Bangalore E- Brochure.pdf
Purva Palm Hills Devanahalli, Bangalore E- Brochure.pdfPurva Palm Hills Devanahalli, Bangalore E- Brochure.pdf
Purva Palm Hills Devanahalli, Bangalore E- Brochure.pdf
 
Cashpay_Call Girls In Gaur City Mall Noida ❤️8860477959 Escorts Service In 24...
Cashpay_Call Girls In Gaur City Mall Noida ❤️8860477959 Escorts Service In 24...Cashpay_Call Girls In Gaur City Mall Noida ❤️8860477959 Escorts Service In 24...
Cashpay_Call Girls In Gaur City Mall Noida ❤️8860477959 Escorts Service In 24...
 
9953056974 Low Rate Call Girls In Saket, Delhi NCR
9953056974 Low Rate Call Girls In Saket, Delhi NCR9953056974 Low Rate Call Girls In Saket, Delhi NCR
9953056974 Low Rate Call Girls In Saket, Delhi NCR
 
Call Girls in Model Town Delhi 💯Call Us 🔝8264348440🔝
Call Girls in Model Town Delhi 💯Call Us 🔝8264348440🔝Call Girls in Model Town Delhi 💯Call Us 🔝8264348440🔝
Call Girls in Model Town Delhi 💯Call Us 🔝8264348440🔝
 
Sobha Aranya Sector 80 Gurgaon E- Brochure.pdf
Sobha Aranya Sector 80 Gurgaon E- Brochure.pdfSobha Aranya Sector 80 Gurgaon E- Brochure.pdf
Sobha Aranya Sector 80 Gurgaon E- Brochure.pdf
 
Nanke Area Estate commercial ( Dir. Kat Kuo)
Nanke Area Estate commercial ( Dir. Kat Kuo)Nanke Area Estate commercial ( Dir. Kat Kuo)
Nanke Area Estate commercial ( Dir. Kat Kuo)
 

U.S. Industrial Market Insights for Q3 2018

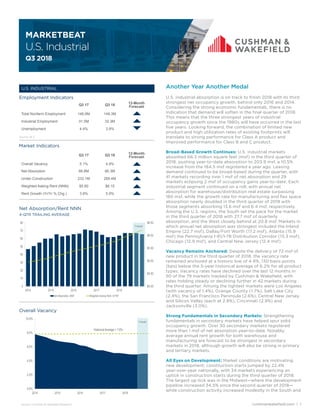
  • 1. cushmanwakefield.com | 1 U.S. Industrial Q3 2018 MARKETBEAT U.S. INDUSTRIAL Overall Vacancy Net Absorption/Rent NNN 4-QTR TRAILING AVERAGE Market Indicators Q3 17 Q3 18 12-Month Forecast Overall Vacancy 5.1% 4.9% Net Absorption 66.8M 66.3M Under Construction 233.1M 285.4M Weighted Asking Rent (NNN) $5.80 $6.15 Rent Growth (Yr/Yr % Chg.) 3.9% 5.9% Employment Indicators Q3 17 Q3 18 12-Month Forecast Total Nonfarm Employment 146.9M 149.3M Industrial Employment 31.5M 32.3M Unemployment 4.4% 3.9% $4.00 $4.50 $5.00 $5.50 $6.00 $6.50 0 10 20 30 40 50 60 70 80 2014 2015 2016 2017 2018 Net Absorption, MSF Weighted Asking Rent, $ PSF Forecast 0.0% 2.0% 4.0% 6.0% 8.0% 10.0% 2014 2015 2016 2017 2018 Historical Average = 7.8% Forecast Another Year Another Medal U.S. industrial absorption is on track to finish 2018 with its third strongest net occupancy growth, behind only 2016 and 2014. Considering the strong economic fundamentals, there is no indication that demand will soften in the final quarter of 2018. This means that the three strongest years of industrial occupancy growth since the 1980s will have occurred in the last five years. Looking forward, the combination of limited new product and high utilization rates of existing footprints will translate to strong performance for Class A product and improved performance for Class B and C product. Broad-Based Growth Continues: U.S. industrial markets absorbed 66.3 million square feet (msf) in the third quarter of 2018, pushing year-to-date absorption to 203.9 msf, a 10.5% increase from the 184.5 msf registered a year ago. Leasing demand continued to be broad-based during the quarter, with 41 markets recording over 1 msf of net absorption and 29 markets eclipsing 2 msf of occupancy gains year-to-date. Each industrial segment continued on a roll, with annual net absorption for warehouse/distribution real estate surpassing 180 msf, while the growth rate for manufacturing and flex space absorption nearly doubled in the third quarter of 2018 with those segments absorbing 13.6 msf and 6.4 msf, respectively. Among the U.S. regions, the South set the pace for the market in the third quarter of 2018 with 27.7 msf of quarterly absorption, and the West closely behind at 20.8 msf. Markets in which annual net absorption was strongest included the Inland Empire (22.7 msf), Dallas/Fort Worth (17.2 msf), Atlanta (15.9 msf) the Pennsylvania I-81/I-78 Distribution Corridor (13.3 msf), Chicago (12.9 msf), and Central New Jersey (12.4 msf). Vacancy Remains Anchored: Despite the delivery of 72 msf of new product in the third quarter of 2018, the vacancy rate remained anchored at a historic low of 4.9%, 130 basis points (bps) below the 5-year historical average of 6.2% for all product types. Vacancy rates have declined over the last 12 months in 50 of the 79 markets tracked by Cushman & Wakefield, with rates holding steady or declining further in 42 markets during the third quarter. Among the tightest markets were Los Angeles (with vacancy of 1.4%), Orange County (1.7%), Salt Lake City (2.4%), the San Francisco Peninsula (2.6%), Central New Jersey and Silicon Valley (each at 2.8%), Cincinnati (2.9%) and Jacksonville (3.0%). Strong Fundamentals in Secondary Markets: Strengthening fundamentals in secondary markets have helped spur solid occupancy growth. Over 30 secondary markets registered more than 1 msf of net absorption year-to-date. Notably, average annual rent growth for both warehouse and manufacturing are forecast to be strongest in secondary markets in 2018, although growth will also be strong in primary and tertiary markets. All Eyes on Development: Market conditions are motivating new development; construction starts jumped by 22.4% year-over-year nationally, with 34 markets experiencing an uptick in construction starts during the third quarter of 2018. The largest up-tick was in the Midwest—where the development pipeline increased 34.5% since the second quarter of 2018— while construction activity increased modestly in the South and Source: Cushman & Wakefield Research Source: BLS
  • 2. cushmanwakefield.com | 2 U.S. Industrial Q3 2018 MARKETBEAT Markets Remain Tight Development Pipeline Building Q3 2018 INDUSTRIAL PRODUCT UNDER CONSTRUCTION Few Signs of Overbuilding YEAR-TO-DATE SUPPLY & DEMAND FUNDAMENTALS Outlook • Net absorption will surpass 250 msf in 2018 for a third year in a row, and eclipse 100 msf for a sixth consecutive year in 2019. • Supply will modestly outpace demand with the overall industrial vacancy rate remaining in the low-to-mid 5% range through 2018 and 2019. • Rent growth will remain strong in 2018 and gradually begin to decelerate in 2019. Source: Cushman & Wakefield Research Source: Cushman & Wakefield Research Source: Cushman & Wakefield Research Northeast and fell slightly in the West. There is currently 285.4 msf of industrial product under construction of which 199.4 msf is speculative, 70% more than the 5-year historical average of 104.9 msf. Development of all sizes remains concentrated in a handful of markets, but activity is ticking up across the country. This is evidenced by the Inland Empire, Dallas/Fort Worth, Atlanta, Chicago, and the Pennsylvania I-81/I-78 Distribution Corridor still accounting for more than one-third of product under construction, but 45 additional markets currently having more than 1 msf under development. Rents Rise Above Replacement Costs: U.S. industrial rents increased 5.9% in the third quarter of 2018 from a year ago, rising in 53 markets—20 of which posted double-digit gains. The strongest rent growth occurred in San Francisco North Bay, Central Valley California, Central New Jersey, Seattle, Sacramento, Boston, Long Island, Memphis and Pittsburgh—all markets in which average asking rents rose more than 15% year-over-year. Although overall asking rents currently stand at a high of $6.15 per square foot, on an inflation-adjusted basis rents remain 4.3% below their level at the height of the last cycle. Rent growth has lifted rents above replacement costs in many markets, which—when taken in tandem with tight conditions and continued demand—will bolster additional development. Nevertheless, rising construction costs and the conservatism among developers that has been a hallmark of the current expansion will promote prudence and keep industrial rents from being watered down from a wave of speculative supply. Booming Freight Economy: The outlook for consumer spending and retail sales is positive, and that for eCommerce even more so: online sales are forecast to grow by double- digits throughout the next three years. And despite concerns over trade policy, the primary drivers of industrial leasing exhibit strength. Ports are bustling, industrial output was the highest ever in August, and the Association of American Railroads reports that the last two weeks of September 2018 were the two highest-volume U.S. intermodal weeks on record. Inflation remains the greatest near-term risk. Eventually, higher input and product costs—as measured by the producer price index (PPI)—could result in higher consumer prices which could stifle consumption and demand for industrial real estate. Recently, the PPI has been ticking upward—and not just as a result of tariff-related price effects. Transportation and storage costs are rising rapidly. Despite the inflationary headwinds, the U.S. economy and the industrial property market are expected to perform well in 2018 and 2019. 0% 2% 4% 6% 8% 10% 12% 14% Q3 2018 Vacancy Prior Cycle Lows (2002-2007) 0 5 10 15 20 25 Speculative Deliveries (MSF) Build-to-Suit Deliveries (MSF) Net Absorption (MSF) 0 5 10 15 20 25 30 Speculative U/C (MSF) Build-to-Suit U/C (MSF)
  • 3. MarketBeat U.S. Q3 2018 cushmanwakefield.com | 3 Net Absorption Leasing Activity Demand Indicators (Overall) Q3 2017 Q4 2017 Q1 2018 Q2 2018 Q3 2018p Q3 2018p United States 66,812,583 63,862,195 63,606,343 74,024,994 66,275,849 118,078,023 Northeast 8,861,433 5,186,345 11,738,275 7,574,394 8,334,036 16,490,828 Midwest 14,367,981 20,129,097 10,453,129 19,048,749 9,491,534 22,682,864 South 25,175,978 21,782,491 23,005,428 31,230,527 27,654,469 35,949,519 West 18,407,191 16,764,262 18,409,511 16,171,324 20,795,810 42,954,812 U.S. Industrial Report Markets Q3 2017 Q4 2017 Q1 2018 Q2 2018 Q3 2018p Q3 2018p Atlanta, GA 3,648,731 4,088,694 5,060,545 3,914,585 6,965,199 6,343,792 Austin, TX -310,320 333,881 88,415 -7,271 33,372 517,471 Baltimore, MD 2,000,608 747,727 1,285,871 1,527,676 1,076,185 1,263,962 Binghamton, NY 40,000 67,346 0 -104,450 -137,442 20,000 Birmingham, AL 41,451 54,771 51,651 -139,480 284,495 385,190 Boston, MA -141,078 492,001 278,374 -322,686 -286,481 338,760 Buffalo, NY 164,966 -924,409 -419,352 -416,072 361,972 617,885 Central Valley, CA 1,117,105 921,226 1,906,657 611,363 2,894,262 3,786,550 Charleston, SC -412,412 -129,871 1,050,618 3,373,254 2,696 477,213 Charlotte, NC 349,467 188,684 398,436 1,862,756 936,141 1,174,123 Chicago, IL 2,099,650 6,156,467 2,978,396 6,338,567 3,605,619 6,445,504 Cincinnati, OH 424,580 1,064,784 1,569,121 2,028,135 1,862,303 2,059,839 Cleveland, OH 119,114 -287,548 1,362,622 -876,635 -682,362 624,685 Colorado Springs, CO -226,085 18,596 191,460 271,803 268,162 170,130 Columbus, OH 1,426,826 1,812,261 320,010 2,011,600 739,775 2,127,657 Dallas/Ft. Worth, TX 6,888,446 4,640,129 3,148,086 8,447,765 5,556,610 5,990,270 Dayton, OH -148,694 489,070 -183,797 -19,724 -98,342 57,382 Denver, CO 1,347,621 1,543,466 249,507 558,268 1,223,839 2,342,483 Detroit, MI 1,091,403 2,555,549 -311,631 2,072,402 -1,906,249 2,002,416 El Paso, TX 376,794 321,135 372,123 100,800 680,474 344,726 Fort Myers/Naples, FL -28,025 73,330 32,218 -134,930 -147,698 321,362 Fredericksburg, VA 49,387 56,102 868,508 -140,363 -42,789 98,271 Ft. Lauderdale, FL 179,962 514,548 -152,477 -165,440 843,971 1,396,645 Greenville, SC 502,474 394,982 1,800,991 1,069,748 1,868,143 393,527 Hampton Roads, VA 576,275 -36,520 302,709 -22,701 -338,584 334,280 Hartford, CT 27,817 135,148 359,849 -77,021 -1,363,863 516,783 Houston, TX 3,209,316 -104,023 817,236 1,459,852 485,266 3,997,029 Indianapolis, IN 2,313,853 3,716,487 556,797 1,658,650 4,138,778 2,837,672 Inland Empire CA 7,126,381 4,688,875 6,318,215 7,795,158 8,554,877 9,577,927 Jacksonville, FL 1,826,645 1,423,221 331,318 -107,214 45,155 287,502 Kansas City, MO 1,682,050 2,117,643 2,037,146 1,895,096 805,447 2,532,637 Lakeland, FL 293,766 36,455 435,792 643,178 235,643 149,005 Las Vegas, NV 2,145,979 2,298,777 1,970,032 1,352,307 630,459 1,063,059 Long Island, NY 253,587 852,791 -342,938 284,735 -588,527 567,655 Los Angeles, CA 1,837,210 1,022,046 1,685,219 -5,468 1,612,015 7,978,800 Louisville, KY 1,245,202 1,222,039 1,774,227 3,224,156 2,028,682 2,387,332 Memphis, TN 486,717 662,189 1,370,642 -211,289 1,303,011 2,736,150 Miami, FL 128,146 730,241 995,053 895,165 2,642,658 1,618,923 Milwaukee, WI 1,493,471 -56,043 842,084 712,238 79,061 1,064,415 Minneapolis, MN 872,326 825,334 592,886 895,305 560,618 1,960,941 Demand Indicators
  • 4. MarketBeat U.S. Q3 2018 cushmanwakefield.com | 4 Net Absorption Leasing Activity Demand Indicators (Overall) Q3 2017 Q4 2017 Q1 2018 Q2 2018 Q3 2018p Q3 2018p Nashville, TN 1,675,012 120,526 1,308,765 1,899,880 1,001,225 808,386 New Haven, CT 5,477 175,696 131,206 -43,970 208,046 432,533 New Jersey - Central 2,809,359 2,184,634 3,906,067 3,124,948 5,325,215 5,369,090 New Jersey - Northern 497,798 1,664,946 161,298 735,863 336,333 3,425,712 Northern VA -20,211 35,291 68,689 511,809 306,033 491,546 Oakland/East Bay, CA -1,569,379 660,234 -419,159 -1,489,837 -305,680 2,178,710 Oklahoma City, OK -542,074 n/a -36,553 -56,541 -4,993 333,614 Omaha, NE 349,921 455,995 -45,931 92,488 -168,696 267,789 Orange County, CA -143,511 -261,531 -122,415 362,050 186,754 2,772,216 Orlando, FL 462,458 789,720 679,407 1,318,618 384,622 1,694,486 Palm Beach County, FL 362,784 101,677 4,592 49,778 87,463 319,106 PA I-81/I-78 Distribution Corridor 3,541,623 844,371 4,626,038 5,380,314 3,284,050 2,418,078 Philadelphia, PA 1,437,888 611,009 1,709,697 -393,235 371,849 1,778,930 Phoenix, AZ 2,571,976 2,600,022 1,615,377 2,628,495 2,212,260 2,548,499 Pittsburgh, PA -650,575 -356,733 1,186,565 -1,162,742 79,076 638,309 Portland, OR 870,133 -72,333 -633,444 1,315,894 609,839 1,563,766 Providence, RI 63,199 313,632 71,456 142,176 61,684 61,684 Puget Sound - Eastside -182,255 220,980 524,863 214,628 391,358 444,790 Raleigh/Durham, NC 317,502 -294,394 225,740 184,041 129,296 159,421 Richmond, VA 705,151 1,022,908 70,213 19,340 189,478 97,505 Roanoke, VA 95,604 6,011 480,115 472,350 54,719 22,047 Rochester, NY 407,166 -594,469 101,023 34,455 981,275 0 Sacramento, CA 1,379,668 1,426,115 1,717,798 825,852 -131,069 1,166,644 Salt Lake City, UT 798,628 723,096 1,039,351 -136,573 1,652,453 1,142,353 San Antonio, TX 135,180 -203,074 76,360 -26,959 79,690 391,347 San Diego, CA 844,640 103,378 -85,162 903,332 513,371 2,358,708 San Francisco North Bay, CA 71,827 39,783 -80,832 135,573 38,977 275,593 San Francisco Peninsula, CA 762 15,292 -4,915 -219,691 -134,821 354,722 San Jose (Silicon Valley), CA -177,705 346,282 731,852 71,272 -253,643 358,595 Savannah, GA 0 3,855,811 0 920,868 0 0 Seattle, WA 561,459 251,674 1,762,853 658,361 577,153 2,719,250 Southern New Hampshire 184,217 -302,661 -118,498 135,192 -194,820 195,392 St. Louis, MO 2,643,481 1,279,098 735,426 2,240,627 555,582 701,927 St. Petersburg/Clearwater, FL 123,416 225,964 -165,644 116,241 -261,559 199,990 Suburban MD 37,371 316,522 71,323 173,822 320,893 355,790 Syracuse, NY 219,989 23,043 87,490 256,887 -104,331 110,017 Tampa, FL 677,735 587,815 132,184 -57,510 839,148 488,357 Tucson, AZ 32,737 218,284 42,254 318,537 255,244 152,017 Tulsa, OK 93,420 n/a 58,275 114,543 69,824 371,151 Demand Indicators p = preliminary
  • 5. MarketBeat U.S. Q3 2018 cushmanwakefield.com | 5 Vacancy Rates Overall Vacancy Rate Q3 2017 Q4 2017 Q1 2018 Q2 2018 Q3 2018p United States 5.1% 5.1% 5.0% 4.9% 4.9% Northeast 5.3% 5.3% 5.1% 5.3% 5.3% Midwest 5.4% 5.3% 5.3% 5.0% 5.0% South 6.2% 6.1% 5.9% 5.8% 5.8% West 3.7% 3.7% 3.5% 3.6% 3.5% U.S. Industrial Report Markets Q3 2017 Q4 2017 Q1 2018 Q2 2018 Q3 2018p Atlanta, GA 7.8% 7.7% 8.1% 8.2% 7.9% Austin, TX 9.5% 8.8% 9.2% 7.3% 7.1% Baltimore, MD 6.9% 6.4% 6.4% 6.2% 7.3% Binghamton, NY 9.8% 9.9% 8.8% 9.7% 10.5% Birmingham, AL 10.8% 10.6% 10.2% 11.3% 9.8% Boston, MA 6.4% 6.2% 5.9% 6.2% 6.7% Buffalo, NY 8.9% 9.1% 9.2% 9.5% 9.2% Central Valley, CA 2.8% 3.3% 3.6% 4.5% 3.5% Charleston, SC 8.0% 8.1% 8.0% 7.2% 7.7% Charlotte, NC 3.5% 3.4% 5.1% 4.5% 4.4% Chicago, IL 6.7% 6.8% 6.8% 6.3% 6.0% Cincinnati, OH 3.4% 3.2% 3.7% 3.0% 2.9% Cleveland, OH 3.8% 3.9% 3.5% 3.5% 3.9% Colorado Springs, CO 10.6% 10.7% 7.9% 6.9% 6.4% Columbus, OH 5.1% 4.7% 4.8% 5.1% 5.4% Dallas/Ft. Worth, TX 6.8% 7.0% 6.4% 6.4% 6.9% Dayton, OH 8.2% 8.3% 7.8% 8.0% 8.1% Denver, CO 4.8% 4.9% 5.0% 5.3% 5.4% Detroit, MI 3.1% 2.9% 2.9% 2.9% 3.2% El Paso, TX 5.0% 3.2% 2.7% 2.4% 1.1% Fort Myers/Naples, FL 1.8% 1.9% 2.1% 2.8% 2.7% Fredericksburg, VA 4.7% 5.3% 5.5% 6.7% 7.0% Ft. Lauderdale, FL 4.0% 2.9% 3.8% 3.7% 3.1% Greenville, SC 5.8% 5.8% 5.4% 5.3% 4.8% Hampton Roads, VA 4.1% 4.4% 4.2% 3.9% 4.2% Hartford, CT 8.1% 7.9% 7.6% 7.7% 6.8% Houston, TX 6.2% 6.3% 6.0% 6.2% 6.4% Indianapolis, IN 5.5% 5.3% 5.5% 5.2% 4.7% Inland Empire CA 4.0% 4.1% 3.9% 4.1% 3.9% Jacksonville, FL 4.8% 4.0% 3.4% 2.9% 3.0% Kansas City, MO 7.1% 7.2% 7.4% 6.8% 6.7% Lakeland, FL 3.9% 3.9% 4.9% 4.5% 3.8% Las Vegas, NV 5.9% 4.6% 4.8% 4.3% 4.5% Long Island, NY 6.5% 5.6% 5.1% 5.0% 5.1% Los Angeles, CA 1.2% 1.3% 1.3% 1.5% 1.4% Louisville, KY 8.1% 7.7% 7.2% 6.4% 5.9% Memphis, TN 8.2% 7.8% 7.4% 7.2% 6.3% Miami, FL 4.7% 4.7% 4.3% 4.3% 3.6% Milwaukee, WI 3.8% 4.1% 4.1% 4.0% 4.2% Minneapolis, MN 8.0% 8.5% 8.7% 8.2% 7.9%
  • 6. MarketBeat U.S. Q3 2018 cushmanwakefield.com | 6 Vacancy Rates Overall Vacancy Rate Q3 2017 Q4 2017 Q1 2018 Q2 2018 Q3 2018p Nashville, TN 3.3% 3.5% 3.4% 3.2% 3.9% New Haven, CT 9.8% 9.5% 9.1% 9.3% 6.9% New Jersey - Central 3.6% 3.3% 2.6% 2.6% 2.8% New Jersey - Northern 4.6% 4.4% 4.7% 4.1% 4.1% Northern VA 8.7% 8.4% 10.1% 9.3% 8.6% Oakland/East Bay, CA 3.3% 3.0% 3.0% 3.7% 4.2% Oklahoma City, OK 9.0% 9.0% 4.7% 4.7% 5.3% Omaha, NE 3.6% 3.4% 2.5% 2.9% 3.1% Orange County, CA 1.9% 1.9% 1.9% 1.9% 1.7% Orlando, FL 5.5% 5.4% 5.1% 4.8% 5.2% Palm Beach County, FL 3.3% 2.7% 3.0% 3.1% 2.8% PA I-81/I-78 Distribution Corridor 5.3% 5.1% 4.8% 5.5% 6.3% Philadelphia, PA 3.4% 4.0% 3.3% 3.2% 3.1% Phoenix, AZ 8.3% 7.9% 7.8% 7.1% 7.3% Pittsburgh, PA 4.8% 5.4% 5.4% 6.1% 6.5% Portland, OR 3.5% 3.9% 4.2% 3.9% 3.4% Providence, RI 0.1% 0.1% 0.0% 0.4% 0.4% Puget Sound - Eastside 4.9% 4.7% 4.3% 4.2% 3.9% Raleigh/Durham, NC 5.5% 6.0% 5.5% 5.5% 4.8% Richmond, VA 3.7% 3.7% 3.9% 3.5% 4.2% Roanoke, VA 7.1% 7.2% 7.0% 6.6% 6.6% Rochester, NY 9.0% 9.8% 9.7% 9.6% 8.3% Sacramento, CA 6.3% 5.9% 4.3% 4.3% 4.5% Salt Lake City, UT 5.8% 5.6% 5.2% 5.2% 2.4% San Antonio, TX 8.0% 8.8% 8.4% 8.6% 9.0% San Diego, CA 4.8% 4.8% 4.8% 4.9% 5.0% San Francisco North Bay, CA 4.8% 4.6% 4.2% 3.9% 3.6% San Francisco Peninsula, CA 2.1% 2.0% 1.6% 2.3% 2.6% San Jose (Silicon Valley), CA 3.6% 3.2% 2.3% 2.7% 2.8% Savannah, GA 3.2% 1.2% 1.2% 0.6% 0.6% Seattle, WA 4.2% 4.1% 3.5% 3.9% 4.0% Southern New Hampshire 7.5% 8.2% 8.8% 9.2% 8.2% St. Louis, MO 6.7% 6.0% 6.1% 5.7% 6.1% St. Petersburg/Clearwater, FL 3.5% 3.6% 3.8% 3.7% 4.0% Suburban MD 10.4% 9.7% 9.7% 9.3% 8.2% Syracuse, NY 8.8% 8.8% 8.6% 7.8% 8.0% Tampa, FL 5.2% 5.3% 5.8% 6.2% 5.5% Tucson, AZ 8.2% 6.6% 6.3% 6.0% 5.7% Tulsa, OK 8.9% 8.9% 3.1% 3.0% 2.7% p = preliminary
  • 7. MarketBeat U.S. Q3 2018 cushmanwakefield.com | 7 Asking Rents Overall (All Property Types) W/D MFG Weighted Average Asking Rent Q3 2017 Q4 2017 Q1 2018 Q2 2018 Q3 2018p Q3 2018p United States $5.80 $5.84 $6.00 $6.11 $6.15 $5.44 $6.07 Northeast $6.03 $6.17 $6.40 $6.51 $6.73 $6.41 $5.14 Midwest $4.61 $4.61 $4.70 $4.79 $4.79 $4.47 $4.67 South $5.45 $5.41 $5.62 $5.60 $5.58 $4.83 $4.91 West $7.98 $8.12 $8.34 $8.58 $8.71 $7.66 $9.43 U.S. Industrial Report Markets Q3 2017 Q4 2017 Q1 2018 Q2 2017 Q3 2018p Q3 2018p Atlanta, GA $4.54 $4.47 $4.83 $4.96 $5.04 $4.21 $3.98 Austin, TX $9.34 $9.24 $10.08 $9.94 $10.37 $7.60 $9.65 Baltimore, MD $5.10 $5.70 $5.75 $5.77 $5.54 $5.02 n/a Binghamton, NY $4.58 $4.57 $4.57 $4.57 $4.55 $4.31 $4.21 Birmingham, AL $4.09 $4.02 $3.98 $4.06 $4.26 $3.93 n/a Boston, MA $6.97 $8.17 $7.45 $7.30 $8.22 $7.63 $7.93 Buffalo, NY $4.13 $4.13 $4.13 $4.13 $4.13 $4.25 $3.95 Central Valley, CA $4.24 $4.75 $4.44 $5.15 $5.46 $4.56 $7.53 Charleston, SC $5.48 $5.52 $5.54 $5.52 $5.46 $5.49 $4.95 Charlotte, NC $5.42 $5.21 $5.27 $5.18 $5.30 $4.82 $4.45 Chicago, IL $5.03 $5.08 $5.19 $5.29 $5.34 $5.06 $4.92 Cincinnati, OH $4.33 $4.25 $4.34 $4.40 $4.27 $4.01 $3.26 Cleveland, OH $4.12 $4.15 $4.30 $4.44 $4.12 $3.80 n/a Colorado Springs, CO $7.37 $7.85 $8.07 $8.13 $8.15 $7.60 $7.24 Columbus, OH $3.46 $3.50 $3.55 $3.59 $3.60 $3.60 n/a Dallas/Ft. Worth, TX $5.59 $5.06 $5.40 $5.50 $5.12 $4.19 $4.20 Dayton, OH $3.33 $3.26 $3.29 $3.05 $3.08 $3.06 $2.93 Denver, CO $8.03 $7.96 $7.78 $7.92 $8.02 $6.61 $7.76 Detroit, MI $5.56 $5.57 $5.79 $5.96 $6.09 $5.59 $5.41 El Paso, TX $4.00 $4.10 $4.10 $4.10 $4.25 $4.25 $4.15 Fort Myers/Naples, FL $7.50 $7.61 $7.72 $7.75 $7.99 $7.55 $8.86 Fredericksburg, VA $5.73 $5.73 $5.79 $5.97 $5.69 $5.77 $4.90 Ft. Lauderdale, FL $9.21 $9.27 $9.45 $9.36 $8.73 $8.15 $8.97 Greenville, SC $3.63 $3.60 $3.43 $3.45 $3.63 $3.59 $3.34 Hampton Roads, VA $5.00 $5.28 $5.44 $5.52 $5.67 $5.54 $5.53 Hartford, CT $4.24 $4.28 $4.47 $4.55 $4.88 $4.80 $3.78 Houston, TX $6.40 $6.44 $6.22 $6.13 $6.22 $6.10 $5.58 Indianapolis, IN $3.76 $3.80 $3.88 $4.09 $3.99 $3.65 $3.09 Inland Empire CA $7.52 $7.61 $7.69 $7.76 $7.92 $7.70 $8.20 Jacksonville, FL $4.98 $5.37 $5.52 $5.67 $5.21 $4.72 $3.12 Kansas City, MO $4.43 $4.27 $4.20 $4.29 $4.38 $4.03 $5.28 Lakeland, FL $5.76 $5.54 $5.45 $5.64 $5.68 $5.06 $8.21 Las Vegas, NV $6.84 $6.96 $6.96 $7.08 $6.96 $6.48 $5.40 Long Island, NY $9.21 $9.44 $10.68 $10.90 $10.81 $10.21 $11.29 Los Angeles, CA $9.00 $9.36 $9.85 $10.02 $10.05 $9.57 $9.61 Louisville, KY $3.70 $3.73 $3.81 $3.88 $3.94 $3.79 $3.54 Memphis, TN $2.75 $2.75 $2.75 $3.15 $3.22 $3.09 $2.77 Miami, FL $8.25 $8.45 $8.79 $7.49 $7.55 $7.16 $7.73 Milwaukee, WI $4.59 $4.64 $4.57 $4.59 $4.63 $4.22 $4.68 Minneapolis, MN $4.90 $4.88 $4.90 $4.90 $4.94 $4.50 n/a
  • 8. MarketBeat U.S. Q3 2018 cushmanwakefield.com | 8 Asking Rents p = preliminary Overall (All Property Types) W/D MFG Weighted Average Asking Rent Q3 2017 Q4 2017 Q1 2018 Q2 2018 Q3 2018p Q3 2018p Nashville, TN $5.03 $5.09 $4.91 $4.76 $4.80 $4.87 $3.44 New Haven, CT $5.15 $5.35 $5.57 $5.43 $5.31 $4.56 $5.70 New Jersey - Central $7.39 $7.58 $7.69 $8.30 $8.87 $8.05 $7.69 New Jersey - Northern $7.82 $8.56 $8.57 $8.61 $8.67 $8.75 $6.62 Northern VA $11.12 $11.36 $11.18 $11.57 $11.80 $9.09 n/a Oakland/East Bay, CA $10.10 $10.43 $10.45 $11.42 $11.47 $10.30 $12.31 Oklahoma City, OK $4.95 $4.95 $4.78 $4.74 $4.70 $4.83 $4.13 Omaha, NE $5.57 $5.55 $5.62 $5.58 $5.62 $5.46 $4.61 Orange County, CA $10.74 $11.24 $11.61 $11.34 $11.94 $10.64 $11.60 Orlando, FL $6.38 $6.48 $6.45 $6.60 $6.88 $5.76 $5.83 Palm Beach County, FL $10.56 $10.69 $10.74 $10.01 $10.12 $8.47 $9.45 PA I-81/I-78 Distribution Corridor $4.75 $4.77 $4.80 $4.86 $4.88 $4.89 $4.50 Philadelphia, PA $4.58 $4.51 $4.76 $4.79 $4.96 $4.86 $4.94 Phoenix, AZ $6.80 $6.70 $6.91 $7.31 $6.83 $5.27 $7.77 Pittsburgh, PA $7.68 $7.58 $8.59 $8.77 $8.88 $5.98 $5.22 Portland, OR $8.38 $8.50 $8.53 $8.72 $8.67 $7.67 $8.91 Providence, RI $4.85 $4.85 $4.85 $4.85 $4.85 $4.70 n/a Puget Sound - Eastside $12.24 $11.76 $11.75 $11.53 $11.14 $10.74 $8.19 Raleigh/Durham, NC $7.71 $8.70 $8.51 $8.66 $8.64 $5.96 $8.40 Richmond, VA $5.03 $4.92 $4.83 $5.16 $4.89 $4.74 $5.36 Roanoke, VA $4.99 $4.98 $5.21 $5.16 $5.18 $4.68 $7.58 Rochester, NY $4.84 $4.84 $5.40 $5.40 $5.40 $3.75 $4.75 Sacramento, CA $5.08 $5.06 $5.41 $6.24 $6.05 $5.87 $6.47 Salt Lake City, UT $5.64 $5.82 $5.65 $5.37 $5.64 $5.40 $5.16 San Antonio, TX $5.75 $5.79 $6.08 $6.09 $6.14 $5.16 n/a San Diego, CA $11.88 $12.36 $12.48 $12.72 $12.84 $9.60 $11.40 San Francisco North Bay, CA $11.97 $11.69 $14.87 $15.13 $16.04 $13.36 $12.29 San Francisco Peninsula, CA $16.42 $17.72 $17.62 $16.41 $16.49 $15.25 $19.81 San Jose (Silicon Valley), CA $12.12 $13.20 $13.08 $12.84 $12.96 $11.64 $15.36 Savannah, GA $4.69 $4.62 $4.62 $4.65 $4.65 $4.23 n/a Seattle, WA $7.45 $7.61 $8.73 $8.79 $8.90 $8.33 $9.54 Southern New Hampshire $5.62 $5.79 $5.92 $5.64 $5.78 $5.01 $5.30 St. Louis, MO $4.62 $4.47 $4.57 $4.86 $4.96 $4.51 $7.60 St. Petersburg/Clearwater, FL $7.99 $8.12 $7.86 $7.67 $8.05 $6.14 $6.28 Suburban MD $9.21 $9.37 $10.02 $10.12 $9.66 $7.92 n/a Syracuse, NY $4.08 $4.02 $3.94 $3.89 $3.88 $4.41 $3.20 Tampa, FL $5.85 $5.72 $5.74 $5.98 $6.24 $5.29 $4.19 Tucson, AZ $6.37 $6.23 $6.09 $6.08 $6.14 $5.93 $5.24 Tulsa, OK $4.54 $4.54 $4.69 $4.69 $4.77 $4.65 $4.00
  • 9. MarketBeat U.S. Q3 2018 cushmanwakefield.com | 9 Inventory Inventory Inventory Deliveries YTD 2018 Under Construction as of Q3 2018p United States 14,581,399,220 212,408,138 285,378,748 Northeast 2,019,766,829 29,241,187 34,139,843 Midwest 4,017,497,207 41,207,292 65,456,052 South 4,511,156,317 81,976,637 111,326,679 West 4,032,978,867 59,983,022 74,456,174 U.S. Industrial Report Markets Inventory Deliveries YTD 2018 Under Construction as of Q3 2018p Atlanta, GA 602,344,464 13,676,829 16,832,156 Austin, TX 41,105,170 646,151 2,070,987 Baltimore, MD 208,945,263 3,304,209 3,741,229 Binghamton, NY 17,463,247 0 0 Birmingham, AL 14,730,458 239,500 2,910,000 Boston, MA 146,096,787 472,500 1,336,558 Buffalo, NY 110,052,883 487,035 419,122 Central Valley, CA 128,808,782 4,794,695 10,600,672 Charleston, SC 71,579,555 5,508,135 2,817,499 Charlotte, NC 192,208,756 4,184,120 4,081,512 Chicago, IL 1,207,532,322 9,511,379 16,781,561 Cincinnati, OH 288,378,865 4,687,539 8,854,378 Cleveland, OH 495,499,412 2,871,520 3,413,853 Colorado Springs, CO 31,227,262 0 170,906 Columbus, OH 254,691,996 5,325,301 5,129,550 Dallas/Ft. Worth, TX 734,115,127 19,707,545 19,140,161 Dayton, OH 119,189,224 431,600 1,335,296 Denver, CO 245,260,710 3,294,246 5,122,927 Detroit, MI 538,154,064 2,298,831 5,285,273 El Paso, TX 52,684,401 648,760 797,662 Fort Myers/Naples, FL 41,594,589 197,371 873,785 Fredericksburg, VA 11,887,625 0 0 Ft. Lauderdale, FL 88,782,662 1,042,403 1,584,246 Greenville, SC 197,843,955 707,497 3,553,544 Hampton Roads, VA 98,286,777 50,000 50,000 Hartford, CT 93,012,333 133,200 1,255,000 Houston, TX 431,842,882 7,796,151 10,476,561 Indianapolis, IN 262,583,035 5,026,486 8,974,317 Inland Empire CA 541,478,833 22,086,737 25,052,721 Jacksonville, FL 106,017,415 60,000 1,255,890 Kansas City, MO 219,138,831 3,892,058 5,073,642 Lakeland, FL 32,222,795 1,286,928 1,531,120 Las Vegas, NV 125,892,282 3,209,009 2,954,452 Long Island, NY 133,253,087 90,530 469,052 Los Angeles, CA 1,069,650,328 5,321,551 3,397,347 Louisville, KY 161,777,615 5,068,551 3,685,566 Memphis, TN 193,328,576 4,348,955 2,779,307 Miami, FL 160,123,459 3,264,843 3,852,920 Milwaukee, WI 201,148,949 1,358,791 2,059,565 Minneapolis, MN 110,551,229 1,584,145 2,137,156
  • 10. MarketBeat U.S. Q3 2018 cushmanwakefield.com | 10 Inventory Inventory Inventory Deliveries YTD 2018 Under Construction as of Q3 2018p Nashville, TN 209,666,342 2,736,635 4,523,036 New Haven, CT 47,972,701 80,500 855,000 New Jersey - Central 348,481,617 8,031,287 3,675,610 New Jersey - Northern 286,876,256 1,025,817 1,874,815 Northern VA 61,920,511 344,444 342,541 Oakland/East Bay, CA 206,421,235 1,324,295 5,608,130 Oklahoma City, OK 67,950,001 11,996 0 Omaha, NE 75,308,190 678,254 974,441 Orange County, CA 283,843,779 545,774 1,452,341 Orlando, FL 120,573,000 3,014,229 2,744,870 Palm Beach County, FL 41,477,766 166,392 247,413 PA I-81/I-78 Distribution Corridor 281,683,045 17,291,095 16,732,425 Philadelphia, PA 143,986,315 0 6,802,631 Phoenix, AZ 315,653,104 5,663,055 4,477,624 Pittsburgh, PA 168,651,734 334,848 554,400 Portland, OR 200,691,981 3,915,343 2,591,816 Providence, RI 77,727,305 0 0 Puget Sound - Eastside 61,189,474 411,340 782,213 Raleigh/Durham, NC 53,579,211 136,500 279,600 Richmond, VA 93,148,340 856,707 1,666,649 Roanoke, VA 51,451,418 250,000 0 Rochester, NY 73,551,473 0 0 Sacramento, CA 141,502,247 905,820 919,603 Salt Lake City, UT 124,296,894 2,432,072 3,996,435 San Antonio, TX 39,913,461 344,850 6,486,449 San Diego, CA 164,059,934 1,823,574 2,296,046 San Francisco North Bay, CA 30,734,395 40,000 614,204 San Francisco Peninsula, CA 41,792,226 0 0 San Jose (Silicon Valley), CA 85,631,745 634,118 0 Savannah, GA 56,682,251 1,039,548 10,548,650 Seattle, WA 192,574,576 2,968,431 4,179,803 Southern New Hampshire 48,120,877 1,240,000 0 St. Louis, MO 245,321,090 3,541,388 5,437,020 St. Petersburg/Clearwater, FL 47,910,931 126,000 64,675 Suburban MD 50,196,477 109,043 213,201 Syracuse, NY 42,837,169 54,375 165,230 Tampa, FL 80,837,025 923,017 1,828,370 Tucson, AZ 42,269,080 612,962 238,934 Tulsa, OK 94,428,039 179,328 347,080 p = preliminary
  • 11. Methodology Cushman & Wakefield’s quarterly estimates are derived from a variety of data sources, including its own proprietary database, and historical data from third party data sources. The market statistics are calculated from a base building inventory made up of industrial properties deemed to be competitive in the local industrial markets. Generally, owner-occupied and federally-owned buildings are not included. Older buildings unfit for occupancy or ones that require substantial renovation before tenancy are generally not included in the competitive inventory. The inventory is subject to revisions due to resampling. Vacant space is defined as space that is available immediately or imminently after the end of the quarter. Sublet space still occupied by the tenant is not counted as available space. The figures provided for the current quarter are preliminary, and all information contained in the report is subject to correction of errors and revisions based on additional data received. Regional Map West Midwest South Northeast Jason Tolliver Head of Logistics & Industrial Research Americas Tel: +1 317.639.0549 cushmanwakefield.com Explanation of Terms Total Inventory: The total amount of industrial space (in buildings of a predetermined size by market) that can be rented by a third party. Overall Vacancy Rate: The amount of unoccupied space (new, relet, and sublet) expressed as a percentage of total inventory. Absorption: The net change in occupied space between two points in time. (Total occupied space in the present quarter minus total occupied space from the previous quarter, quoted on a net, not gross, basis.) Leasing Activity: The sum of all leases over a period of time. This includes pre-leasing activity as well as expansions. It does not include renewals. Overall Weighted Asking Rents: NNN average asking rents weighted by the amount of available direct and sublease space in industrial properties. W/D: Warehouse and or distribution properties. MFG: Manufacturing properties. About Cushman & Wakefield Cushman & Wakefield (NYSE: CWK) is a leading global real estate services firm that delivers exceptional value by putting ideas into action for real estate occupiers and owners. Cushman & Wakefield is among the largest real estate services firms with 48,000 employees in approximately 400 offices and 70 countries. In 2017, the firm had revenue of $6.9 billion across core services of property, facilities and project management, leasing, capital markets, valuation and other services. To learn more, visit www.cushmanwakefield.com or follow @CushWake on Twitter. ©2018 Cushman & Wakefield. All rights reserved. The information contained within this report is gathered from multiple sources believed to be reliable. The information may contain errors or omissions and is presented without any warranty or representations as to its accuracy. Carolyn Salzer Analyst, Logistics & Industrial Research Americas Tel: +1 847.518.3212 cushmanwakefield.com