SlideShare a Scribd company logo
1 of 11
Download to read offline
cushmanwakefield.com | 1
U.S. Office
Q4 2018
MARKETBEAT
U.S. Office Market Was Driven by the Tech
Sector in the Fourth Quarter of 2018
U.S. office markets remained active in the fourth quarter of
2018 with new leasing volume totaling 74.7 million square feet
(msf). Although this was slightly less than the 80.2 msf of new
leasing recorded in the third quarter of the year, it was greater
than the 73.4 msf recorded in the fourth quarter of 2017. New
leasing volume for 2018 was 311.9 msf, only slightly lower than
the cyclical high of 314.8 msf in 2017. In the fourth quarter the
tech sector accounted for slightly more than one-third (34.4%)
of the leasing volume, well ahead of the 18.8% share secured by
the financial services sector. The real estate sector captured
the third largest share of leasing volume in the fourth quarter—
approximately 5.6%—largely a reflection of the co-working
sector’s rapid growth. For all of 2018, tech leases accounted for
an estimated 29.3% of activity, followed by financial services at
20.7% and real estate at 6.3%.
The importance of the tech sector is evident in the geographic
distribution of leasing activity. Cities with strong local
technology sectors were among those boasting the highest
leasing volume. In its Tech Cities 2.0 report, Cushman &
Wakefield identified 21 U.S. metropolitan areas where the
technology sector is an important factor in local economies.
Those metropolitan areas account for approximately 59.2% of
the total inventory tracked by Cushman & Wakefield. In the
fourth quarter of 2018, they captured 72.5% of the new leasing
activity, and 70.7% of activity for the year.
Absorption exceeds construction completions, vacancy
declines and the pipeline grows: The U.S. economy added
762,000 net new nonfarm payroll jobs during the fourth
quarter of 2018, the largest number of job gains in any quarter
last year. This strong employment growth led to an increase in
net absorption—defined as the net change in occupied space.
Net absorption nearly doubled in the fourth quarter, rising to
20.0 msf from 11.0 msf in the third quarter, and the highest level
since the fourth quarter of 2015. On the supply side, 13.7 msf of
new office space was completed and delivered to the market
during the fourth quarter, up from 9.8 msf in the third quarter.
With demand for space (absorption) exceeding new supply, the
national vacancy rate declined slightly, from 13.4% in the third
quarter of 2018 to 13.2% in the fourth quarter. However, that
vacancy rate was still slightly higher than the 13.1% vacancy
rate recorded a year ago. In fact, the U.S. vacancy rate has
remained relatively flat for the past three years, hovering in a
narrow range between 13.1% and 13.4% since the first quarter of
2016. Over those three years a total of 157.2 msf was absorbed
while 159.4 msf was completed. This balance between
absorption and construction completions has held the vacancy
rate flat.
Despite the increase in new construction completions, the
amount of space under construction in the U.S. continued to
rise. At the end of 2018, 114.2 msf was under construction in the
U.S., up from 103.0 msf at the end of 2017. That is the highest
volume in the current cycle, representing 2.1% of the total
inventory of the U.S., the largest share in the current cycle.
Much of this new construction is in cities and markets where
demand is strong. In fact, the 15 markets with the highest
volume of space under construction were also among the
strongest markets for net absorption during 2018. At the end of
the year, the top 15 new construction markets accounted for
66.7 msf—or 58.3%—of the national construction pipeline.
U.S. OFFICE
Office: Overall Vacancy
Office: Net Absorption/Asking Rent
4Q TRAILING AVERAGE
Market Indicators (Overall)
Q4 17 Q4 18 12-Month
Forecast
Vacancy Rate 13.1% 13.2%
Net Absorption 13.8M 20.0M
Under Construction 103.0M 114.2M
Weighted Asking Rent (FS) $30.59 $31.45
Rent Growth (Yr/Yr % Chg.) 4.2% 2.2%
Employment Indicators
Q4 17 Q4 18 12-Month
Forecast
Total Nonfarm Employment 147.4M 149.9M
Office-using Employment 31.8M 32.4M
Unemployment 4.1% 3.7%
$24.00
$26.00
$28.00
$30.00
$32.00
0
7
14
21
2015 2016 2017 2018 2019
Net Absorption, MSF Asking Rent, $ PSF
Forecast
12.0%
12.5%
13.0%
13.5%
14.0%
14.5%
15.0%
2015 2016 2017 2018 2019
10Year Average= 14.9%
Forecast
Source: Cushman & Wakefield Research
Source: BLS
cushmanwakefield.com | 2
U.S. Office
Q4 2018
MARKETBEAT
Office: Vacancy by Market
Select Markets in the U.S.
Office: Asking Rent by Market
Highest Priced U.S. Markets
Office: New Supply
Looking Ahead
The U.S. economy accelerated in 2018 fueled by tax cuts,
rising optimism and synchronized global growth. This led
to faster job growth and greater demand for office space
as absorption increased. At the center of this growth was
the tech sector which dominated new leasing. Tech-driv-
en markets also experienced strong absorption during
the year. Offsetting the impact of strong demand growth
was rising new construction: 52.7 msf of new office space
was completed in 2018—a fourth consecutive year during
which completions topped 50.0 msf. The pipeline con-
tinues to build, reaching a cyclical high of 114 msf. This
new supply will weigh on markets during 2019. While
Cushman & Wakefield expects continuing job growth, the
overall trend in vacancy is expected to be flat. That will
create pockets of opportunity for occupiers in some mar-
kets across the U.S. this year where the supply/demand
balance is tilted more toward tenants. Overall, 2019 is
expected to be another year of balanced growth in both
supply and demand.
6.2%
6.4%
7.2%
7.5%
7.6%
7.7%
8.0%
8.0%
8.9%
9.0%
9.2%
9.3%
9.6%
9.7%
9.7%
9.9%
10.6%
10.7%
10.8%
11.0%
2%
4%
6%
8%
10%
12%
14% National Average 13.2%
0
5
10
15
20
25
2015 2016 2017 2018 2019
MSF
10 Year Average = 10.7 MSF
Forecast
$76.82
$75.57
$75.03
$63.57
$60.82
$54.34
$43.24
$42.45
$39.59
$39.23
$38.69
$37.04
$36.97
$36.96
$36.26
$35.66
$0
$20
$40
$60
$80
$PSF
National Average = $31.45
Source: Cushman & Wakefield Research
These same markets accounted for 29.5 msf—or 54.8%—of net
absorption during the year. Markets where the construction
pipeline represents a significant share of existing inventory
include San Mateo County CA (8.0%), Austin TX (7.8%),
Nashville TN (7.6%), Seattle WA (6.8%) and Midtown
Manhattan (6.0%).
Tech markets tighten: Given these leasing and absorption
data, it is not surprising that the markets with the lowest
vacancy were also a “Who’s Who” of tech-driven regions.
Among major markets, those with the lowest vacancy rate
were Puget Sound-Eastside (Seattle) with a 6.2% vacancy
rate, San Francisco (6.4%), Midtown South Manhattan (7.2%),
Charlotte, NC (7.6%) and Raleigh/Durham, NC (7.7%).
But the low vacancy environment was not limited to a few
tech markets. In the fourth quarter of 2018, 29 markets
registered vacancy rates below 10%—the highest number of
sub-10% vacancy rate markets since the end of 2000.
Rents rise, but the pace slows: The average asking rent for
office space in the U.S. increased to a record $31.45 per
square foot (psf) in the fourth quarter of 2018. While average
asking rent was 2.2% higher than a year ago, it was the
smallest year-over-year increase since 2014 when rents rose
only 2.0%. Fifty markets recorded an increase in asking rents
from the third to the fourth quarter of 2018, the smallest
number of quarter-over-quarter increases since the first
quarter of 2018.
Among major markets, the largest year-over-year rent growth
was in Orange County CA—average asking rents in that
market rose 12.1%. The second-fastest growth was in Midtown
South/Manhattan (+11.5%), followed by San Francisco/North
Bay (+9.5%), Raleigh/Durham (+9.1%) and Portland OR (+7.7%).
For a second consecutive quarter Midtown South/Manhattan
boasted the highest average asking rent—a weighted average
of $76.82 psf. Following was San Francisco at $75.57 psf,
Midtown Manhattan ($75.03 psf), Downtown Manhattan
($63.57 psf) and San Mateo County CA ($60.82 psf).
MarketBeat U.S. Office Q4 2018 cushmanwakefield.com | 3
Net Absorption Leasing Activity**
Demand Indicators (Overall) Q4 2017 Q1 2018 Q2 2018 Q3 2018 Q4 2018p Q4 2018p
United States 13,849,881 7,986,723 14,815,061 10,967,950 19,962,916 381,613,730
Northeast 3,370,397 265,018 4,924,632 3,175,502 5,089,338 91,829,836
Midwest 566,234 1,032,599 2,095,426 522,205 2,436,889 45,006,275
South 3,793,716 115,183 2,795,455 1,790,705 6,869,380 107,840,769
West 6,119,534 6,573,923 4,999,548 5,479,538 5,567,309 136,936,850
U.S. Office Market Reports Q4 2017 Q1 2018 Q2 2018 Q3 2018 Q4 2018p Q4 2018p
Atlanta, GA 905,671 482,191 89,712 -261,207 755,561 12,092,543
Austin, TX -90,292 -86,161 -64,368 306,487 368,237 6,820,256
Baltimore, MD 63,522 -48,425 301,945 164,112 575,384 2,237,006
Binghamton, NY 29,482 8,358 7,353 8,955 32,272 62,083
Birmingham, AL -271,466 -387,710 -292,771 38,965 89,026 887,400
Boston, MA 1,714,728 789,664 941,612 406,307 648,484 14,835,950
Buffalo, NY 180,711 118,058 -36,832 85,402 67,165 825,652
Charleston, SC -31,793 83,627 382,982 -196,512 114,905 846,496
Charlotte, NC -277,551 120,129 -133,684 764,464 712,520 3,466,337
Chicago, IL -87,431 375,861 521,090 -527,647 485,721 19,088,075
Cincinnati, OH 6,132 -688,648 1,471 6,195 -27,870 1,632,570
Cleveland, OH -33,348 652,292 -132,832 370,957 489,376 1,478,727
Colorado Springs, CO 41,005 -7,799 33,513 213,379 25,815 1,101,348
Columbus, OH 121,938 74,995 356,075 -245,428 238,716 1,662,328
Dallas/Fort Worth, TX 651,472 463,512 758,161 -235,488 519,116 10,489,562
Dayton, OH 34,949 26,733 47,703 -4,415 13,368 478,495
Denver, CO 276,809 108,343 1,420,416 884,176 300,795 12,376,523
Detroit, MI -149,900 -23,504 297,216 522,848 401,123 3,593,693
El Paso, TX 206,180 174,753 171,857 117,053 317,200 331,756
Fairfield County, CT 158,904 -444,060 425,403 -626,483 -433,700 3,353,129
Fort Myers/Naples, FL 5,296 -88,290 -108,726 56,437 34,437 958,763
Fredericksburg, VA -41,100 -1,039 25,319 -66,929 12,514 256,657
Ft. Lauderdale, FL 192,477 83,852 -92,109 22,571 -52,844 2,337,029
Greenville, SC -29,702 63,980 -88,102 77,102 -43,267 553,766
Hampton Roads, VA 182,887 218,483 194,768 -458,431 57,116 1,112,329
Hartford, CT -22,471 66,356 -180,443 -32,143 113,825 1,515,472
Houston, TX -76,018 -1,595,091 -729,169 403,426 1,730,319 13,914,400
Indianapolis, IN 106,407 21,164 148,105 32,059 144,335 2,878,933
Inland Empire CA 63,707 20,591 111,838 59,723 52,156 1,233,329
Jacksonville, FL -177,795 26,678 43,424 170,171 -145,545 1,484,634
Kansas City, MO 12,877 391,484 291,917 136,082 -18,375 5,042,654
Las Vegas, NV 753,700 531,433 194,925 -320,868 167,055 2,646,384
Long Island, NY 635,282 -155,834 348,898 432,891 -99,580 1,287,723
Los Angeles CBD 125,536 100,825 259,229 158,952 361,710 2,216,429
Los Angeles Metro 324,649 41,751 588,956 561,367 926,389 14,452,526
Louisville, KY 56,968 -12,944 41,464 242,750 41,622 905,348
Memphis, TN 45,706 115,130 21,427 215,645 100,214 883,564
Miami, FL 149,150 517,999 272,523 -84,811 92,445 3,071,809
Milwaukee, WI 6,799 209,598 111,563 18,087 13,851 1,186,070
Minneapolis/St. Paul, MN 372,274 -163,970 437,958 -30,768 296,227 3,635,117
Demand Indicators
MarketBeat U.S. Office Q4 2018 cushmanwakefield.com | 4
Net Absorption Leasing Activity**
Demand Indicators (Overall) Q4 2017 Q1 2018 Q2 2018 Q3 2018 Q4 2018p Q4 2018p
Nashville, TN -31,019 -72,654 158,854 75,668 71,024 2,324,658
New Haven, CT -420,840 -28,419 -11,991 96,508 -110,000 419,181
New Jersey - Central -200,094 -452,358 476,621 -154,026 537,844 4,991,706
New Jersey - Northern -679,405 -581,449 -57,951 561,162 370,423 6,623,405
New Orleans, LA -153,754 -69,504 51,339 -90,201 18,875 357,024
New York - Brooklyn 452,500 233,807 -145,636 -505,871 108,773 1,152,217
New York - Downtown 161,963 84,629 876,759 -452,177 606,368 6,206,240
New York - Midtown 1,497,959 1,316,820 1,332,041 2,382,020 2,290,165 28,301,624
New York – Midtown South 551,254 272,498 858,204 219,171 616,356 7,582,878
Northern VA 1,011,923 359,647 328,468 110,109 404,533 11,472,870
Oakland/East Bay, CA* 418,281 -422,906 -175,361 419,804 224,951 9,103,788
Omaha, NE -106,784 97,553 94,072 69,799 327,021 1,131,751
Orange County, CA 176,349 46,496 200,568 -81,668 131,191 8,164,796
Orlando, FL 165,766 -101,696 303,625 189,122 -168,210 2,713,749
Palm Beach, FL 74,486 17,790 -137,318 353 79,692 1,560,715
Philadelphia, PA -726,020 -105,205 -319,417 271,168 1,009,196 7,590,878
Phoenix, AZ 383,458 865,326 786,100 493,857 639,948 8,117,957
Pittsburgh, PA -72,103 -448,378 139,838 142,285 -85,436 2,915,365
Portland, OR 228,906 -167,524 294,961 -80,102 -65,276 2,325,479
Providence, RI 40,000 7,000 20,000 20,000 25,000 1,093,500
Puget Sound - Eastside 13,064 536,624 -80,388 347,223 247,205 5,314,113
Raleigh/Durham, NC 480,412 189,060 362,984 33,222 169,029 1,801,768
Richmond, VA 262,192 -277,478 230,435 131,145 6,193 2,262,230
Roanoke, VA 5,235 -85,873 -60,413 990 117,743 375,362
Rochester, NY 147,176 -307,934 180,621 142,101 -91,663 375,108
Sacramento, CA 428,813 273,859 142,513 167,273 -51,127 5,115,744
Salt Lake City, UT 543,049 50,079 287,769 76,732 869,962 2,432,492
San Antonio, TX -128,901 -162,460 -36,626 -7,640 146,943 1,233,552
San Diego, CA 393,547 349,859 212,717 -235,062 -49,525 6,074,794
San Francisco North Bay, CA 106,126 -51,112 62,728 -46,843 115,114 1,120,851
San Francisco, CA 253,149 2,201,032 1,392,816 1,028,671 216,148 10,470,028
San Juan, PR n/a n/a n/a n/a n/a n/a
San Mateo County, CA -51,390 76,484 -293,965 737,191 16,742 8,481,786
San Jose (Silicon Valley), CA* -95,694 605,427 -760,178 852,071 1,068,450 29,641,560
Savannah, GA 38,194 n/a 98,334 n/a -36,340 65,000
Seattle, WA 1,618,836 1,357,121 232,029 201,498 411,728 6,000,285
Southern New Hampshire 14,847 -63,798 2,340 56,833 3,879 589,870
St. Louis, MO 282,321 59,041 -78,912 174,436 73,396 3,197,862
St. Petersburg/Clearwater, FL 67,506 61,279 163,941 -62,901 43,523 805,889
Suburban MD 90,173 -101,457 456,704 -6,225 54,697 3,640,642
Syracuse, NY 17,895 -983 167,651 17,747 -57,597 784,553
Tampa, FL 214,245 70,402 153,413 -20,049 -67,575 4,361,569
Tucson, AZ 117,634 58,014 88,362 42,164 -42,122 546,638
Tulsa, OK n/a -107,618 -197,655 171,636 296,457 841,453
Washington, DC 233,646 265,071 124,717 -10,329 453,836 11,374,633
Westchester County, NY -111,371 -43,754 -100,439 103,652 -462,436 1,323,302
Demand Indicators
p = preliminary
*Includes R&D
**Leasing activity includes renewals
MarketBeat U.S. Office Q4 2018 cushmanwakefield.com | 5
Vacancy Rates
Overall Direct
Vacancy Rate (All Classes) Q4 2017 Q1 2018 Q2 2018 Q3 2018 Q4 2018p Q4 2018p
United States 13.1% 13.2% 13.4% 13.4% 13.2% 12.0%
Northeast 12.2% 12.5% 12.6% 12.6% 12.6% 11.1%
Midwest 14.5% 14.3% 14.5% 14.6% 14.3% 13.5%
South 14.0% 14.4% 14.6% 14.6% 14.5% 13.4%
West 12.0% 11.9% 11.8% 11.7% 11.4% 10.1%
U.S. Office Report Markets Q4 2017 Q1 2018 Q2 2018 Q3 2018 Q4 2018p Q4 2018p
Atlanta, GA 16.5% 16.2% 16.2% 16.4% 16.2% 15.2%
Austin, TX 10.4% 10.5% 11.2% 11.4% 10.6% 8.4%
Baltimore, MD 12.7% 13.2% 13.1% 13.6% 13.4% 12.8%
Binghamton, NY 9.0% 8.9% 8.6% 8.6% 7.9% 7.9%
Birmingham, AL 12.9% 15.9% 17.1% 16.9% 16.5% 13.9%
Boston, MA 10.1% 10.0% 9.7% 9.5% 9.7% 8.5%
Buffalo, NY 17.3% 17.3% 17.4% 17.0% 16.8% 16.0%
Charleston, SC 6.3% 5.6% 5.7% 6.2% 6.2% 5.9%
Charlotte, NC 8.0% 8.1% 8.2% 7.5% 7.6% 7.2%
Chicago, IL 16.8% 17.2% 18.4% 18.8% 18.3% 16.7%
Cincinnati, OH 21.1% 21.6% 20.1% 19.9% 20.2% 19.3%
Cleveland, OH 9.6% 8.5% 8.6% 8.6% 8.2% 8.0%
Colorado Springs, CO 18.1% 10.4% 10.1% 9.7% 9.7% 9.3%
Columbus, OH 14.3% 13.7% 14.0% 14.9% 14.5% 13.1%
Dallas/Fort Worth, TX 16.7% 17.7% 18.5% 18.8% 18.5% 17.2%
Dayton, OH 21.9% 22.6% 22.1% 22.3% 22.0% 21.9%
Denver, CO 15.6% 16.3% 16.1% 15.7% 15.2% 13.9%
Detroit, MI 13.6% 13.5% 12.6% 12.4% 11.9% 11.7%
El Paso, TX 6.3% 7.2% 7.2% 7.2% 7.3% 7.1%
Fairfield County, CT 23.1% 24.2% 24.5% 24.6% 25.3% 22.1%
Fort Myers/Naples, FL 6.2% 5.8% 6.4% 5.6% 6.0% 5.8%
Fredericksburg, VA 12.4% 12.1% 11.6% 11.8% 11.6% 11.1%
Ft. Lauderdale, FL 11.6% 12.0% 11.7% 12.2% 12.8% 12.0%
Greenville, SC 7.8% 8.2% 9.3% 10.6% 8.1% 7.6%
Hampton Roads, VA 9.8% 9.6% 8.9% 9.6% 8.9% 8.8%
Hartford, CT 16.1% 16.4% 17.2% 17.3% 16.7% 14.9%
Houston, TX 20.2% 22.0% 22.4% 22.3% 21.7% 19.2%
Indianapolis, IN 14.3% 14.3% 17.2% 16.9% 15.9% 15.4%
Inland Empire CA 8.8% 8.7% 8.0% 7.8% 7.5% 7.3%
Jacksonville, FL 13.5% 13.0% 12.8% 12.6% 12.9% 12.3%
Kansas City, MO 16.3% 15.5% 14.4% 14.4% 14.4% 13.5%
Las Vegas, NV 12.3% 11.9% 11.9% 12.4% 12.4% 11.7%
Long Island, NY 12.3% 12.7% 11.7% 10.5% 10.7% 8.5%
Los Angeles CBD 21.2% 21.2% 20.3% 20.2% 18.6% 17.9%
Los Angeles Metro 14.1% 14.5% 14.6% 14.4% 13.9% 12.9%
Louisville, KY 13.2% 13.5% 13.5% 12.2% 12.6% 11.9%
Memphis, TN 20.0% 14.2% 14.4% 13.6% 13.5% 13.1%
Miami, FL 12.1% 12.1% 12.4% 12.9% 13.8% 13.0%
Milwaukee, WI 16.8% 16.2% 15.3% 15.0% 15.0% 14.6%
Minneapolis/St. Paul, MN 17.4% 17.6% 17.1% 17.5% 17.6% 16.8%
MarketBeat U.S. Office Q4 2018 cushmanwakefield.com | 6
Vacancy Rates
Overall Direct
Vacancy Rate (All Classes) Q4 2017 Q1 2018 Q2 2018 Q3 2018 Q4 2018p Q4 2018p
Nashville, TN 8.5% 8.5% 8.6% 9.8% 9.7% 9.1%
New Haven, CT 14.6% 13.7% 13.4% 13.0% 13.1% 12.3%
New Jersey - Central 16.5% 17.2% 16.5% 16.7% 16.0% 13.8%
New Jersey - Northern 18.4% 19.7% 19.8% 19.2% 18.8% 17.2%
New Orleans, LA 8.8% 9.5% 9.3% 9.3% 9.6% 9.5%
New York - Brooklyn 10.5% 10.5% 11.1% 13.2% 15.2% 13.5%
New York - Downtown 8.7% 9.0% 11.3% 12.0% 10.8% 9.4%
New York - Midtown 9.5% 9.3% 9.2% 9.2% 9.3% 7.5%
New York – Midtown South 6.9% 6.5% 6.7% 7.4% 7.2% 5.6%
Northern VA 21.6% 21.1% 20.5% 20.6% 20.3% 19.2%
Oakland/East Bay, CA* 10.6% 11.0% 11.4% 11.2% 11.0% 9.3%
Omaha, NE 7.7% 6.8% 6.6% 6.8% 6.6% 6.2%
Orange County, CA 11.1% 11.6% 11.3% 11.8% 11.5% 11.0%
Orlando, FL 9.3% 9.5% 9.3% 8.6% 8.9% 8.7%
Palm Beach, FL 12.9% 14.5% 13.7% 14.0% 13.7% 13.0%
Philadelphia, PA 11.4% 12.0% 12.6% 12.5% 12.5% 11.9%
Phoenix, AZ 17.4% 16.8% 16.1% 15.6% 15.6% 14.5%
Pittsburgh, PA 10.4% 10.7% 11.0% 11.1% 10.8% 9.8%
Portland, OR 10.3% 10.5% 10.5% 11.4% 11.8% 11.2%
Providence, RI 12.0% 12.1% 12.0% 11.6% 11.4% 11.2%
Puget Sound - Eastside 8.4% 8.1% 8.1% 7.0% 6.2% 5.1%
Raleigh/Durham, NC 8.1% 8.1% 7.6% 7.4% 7.7% 7.2%
Richmond, VA 7.1% 6.7% 6.7% 6.6% 6.8% 6.4%
Roanoke, VA 6.2% 6.8% 6.8% 6.8% 6.1% 6.1%
Rochester, NY 13.3% 15.4% 14.2% 13.2% 13.8% 13.8%
Sacramento, CA 9.6% 9.6% 9.6% 9.5% 9.2% 9.1%
Salt Lake City, UT 13.9% 14.0% 13.3% 13.5% 12.4% 10.9%
San Antonio, TX 13.9% 13.9% 13.5% 13.2% 13.0% 12.6%
San Diego, CA 13.3% 12.9% 12.6% 13.4% 13.8% 11.4%
San Francisco North Bay, CA 8.4% 8.7% 8.4% 8.6% 8.0% 6.8%
San Francisco, CA 8.6% 7.6% 7.4% 6.8% 6.4% 5.0%
San Juan, PR 11.2% 11.6% 12.8% 12.9% 12.6% 12.6%
San Mateo County, CA 8.5% 8.1% 8.8% 8.5% 9.0% 6.9%
San Jose (Silicon Valley), CA* 11.0% 10.6% 10.7% 10.5% 9.9% 7.6%
Savannah, GA 15.8% 15.8% 12.9% 12.9% 14.0% 14.0%
Seattle, WA 7.3% 8.1% 8.7% 8.4% 8.0% 7.1%
Southern New Hampshire 9.9% 9.9% 10.3% 10.1% 9.6% 8.8%
St. Louis, MO 11.7% 11.4% 12.3% 12.0% 11.8% 11.2%
St. Petersburg/Clearwater, FL 13.1% 12.6% 11.7% 12.7% 11.9% 11.7%
Suburban MD 19.4% 19.4% 19.0% 18.7% 18.4% 17.5%
Syracuse, NY 14.2% 14.0% 12.4% 12.3% 12.7% 11.6%
Tampa, FL 11.7% 11.3% 10.9% 10.9% 11.9% 10.9%
Tucson, AZ 9.0% 8.9% 8.1% 8.1% 8.4% 8.2%
Tulsa, OK 22.0% 22.2% 23.2% 24.1% 23.2% 21.4%
Washington, DC 12.4% 12.4% 14.0% 14.1% 14.1% 13.1%
Westchester County, NY 19.6% 24.6% 25.7% 25.1% 26.5% 24.5%
p = preliminary
*Includes R&D.
MarketBeat U.S. Office Q4 2018 cushmanwakefield.com | 7
Asking Rents
Overall (All Classes) Class A
Weighted Average Asking Rent Q4 2017 Q1 2018 Q2 2018 Q3 2018 Q4 2018p Q4 2018p
United States $30.78 $30.72 $31.03 $31.29 $31.45 $37.56
Northeast $38.37 $37.65 $38.41 $38.89 $38.92 $45.26
Midwest $23.23 $23.46 $23.60 $23.62 $23.82 $27.42
South $27.92 $28.16 $28.32 $28.52 $28.50 $38.05
West $33.61 $33.33 $33.67 $34.11 $34.53 $41.70
U.S. Office Report Markets Q4 2017 Q1 2018 Q2 2018 Q3 2018 Q4 2018p Q4 2018p
Atlanta, GA $24.78 $25.79 $26.53 $26.74 $26.64 $30.31
Austin, TX $36.13 $36.39 $36.54 $35.81 $36.26 $41.09
Baltimore, MD $23.37 $23.14 $23.41 $23.52 $23.45 $26.63
Binghamton, NY $12.84 $12.84 $12.84 $12.93 $13.20 $13.20
Birmingham, AL $19.31 $19.35 $18.94 $18.63 $18.57 $19.66
Boston, MA $37.08 $35.82 $36.05 $36.87 $36.97 $41.94
Buffalo, NY $17.70 $17.70 $17.70 $17.70 $17.70 $23.60
Charleston, SC $21.67 $22.11 $23.35 $25.50 $23.55 $26.52
Charlotte, NC $24.45 $25.18 $25.46 $26.14 $26.25 $30.16
Chicago, IL $30.48 $30.57 $30.24 $29.94 $30.23 $33.66
Cincinnati, OH $18.53 $18.66 $19.09 $18.95 $19.00 $21.59
Cleveland, OH $17.35 $17.25 $17.50 $17.31 $17.66 $21.96
Colorado Springs, CO $13.92 $15.51 $15.52 $15.73 $16.72 $20.04
Columbus, OH $20.74 $20.77 $20.94 $20.96 $20.92 $23.02
Dallas/Fort Worth, TX $26.49 $27.31 $26.43 $26.47 $26.39 $29.76
Dayton, OH $15.04 $15.00 $14.98 $14.86 $14.90 $18.20
Denver, CO $26.86 $27.41 $27.50 $27.72 $28.21 $31.89
Detroit, MI $19.42 $19.52 $19.61 $19.59 $19.65 $22.18
El Paso, TX $16.26 $16.25 $16.50 $16.50 $16.50 $17.00
Fairfield County, CT $33.00 $32.55 $32.47 $32.21 $32.47 $37.70
Fort Myers/Naples, FL $15.63 $14.97 $14.85 $15.09 $15.02 $18.03
Fredericksburg, VA $19.07 $20.12 $22.83 $22.46 $22.55 $24.88
Ft. Lauderdale, FL $29.24 $30.35 $30.48 $30.72 $30.18 $37.23
Greenville, SC $18.54 $19.39 $19.25 $19.11 $19.37 $23.53
Hampton Roads, VA $17.67 $17.75 $18.19 $18.82 $18.37 $21.54
Hartford, CT $20.72 $20.55 $20.59 $20.91 $20.99 $22.24
Houston, TX $29.80 $29.44 $29.04 $29.37 $29.25 $36.48
Indianapolis, IN $19.35 $19.53 $19.24 $19.60 $19.74 $22.07
Inland Empire CA $22.21 $22.36 $22.72 $22.91 $22.92 $27.44
Jacksonville, FL $19.02 $19.07 $19.00 $19.64 $19.50 $22.93
Kansas City, MO $19.85 $19.73 $20.20 $20.26 $20.69 $24.01
Las Vegas, NV $19.56 $19.80 $19.44 $19.92 $20.40 $28.44
Long Island, NY $29.75 $29.46 $29.96 $29.78 $29.22 $32.46
Los Angeles CBD $42.39 $42.23 $42.25 $42.35 $42.45 $43.36
Los Angeles Metro $38.74 $39.24 $39.31 $39.72 $39.59 $43.16
Louisville, KY $17.15 $16.96 $16.82 $16.40 $16.70 $20.23
Memphis, TN $18.13 $17.87 $17.82 $17.91 $18.10 $19.66
Miami, FL $38.16 $38.49 $38.03 $38.86 $38.69 $43.96
Milwaukee, WI $19.00 $19.00 $19.00 $20.13 $20.27 $23.81
Minneapolis/St. Paul, MN $25.38 $25.49 $25.32 $25.65 $25.48 $30.83
MarketBeat U.S. Office Q4 2018 cushmanwakefield.com | 8
Asking Rents
Overall (All Classes) Class A
Weighted Average Asking Rent Q4 2017 Q1 2018 Q2 2018 Q3 2018 Q4 2018p Q4 2018p
Nashville, TN $26.99 $26.45 $26.20 $26.78 $26.71 $29.74
New Haven, CT $21.42 $21.35 $21.37 $21.56 $21.72 $23.16
New Jersey - Central $25.75 $26.45 $26.58 $26.57 $26.71 $29.59
New Jersey - Northern $29.84 $30.13 $30.79 $30.84 $31.09 $35.95
New Orleans, LA $18.63 $18.57 $18.69 $18.86 $18.63 $19.65
New York - Brooklyn $41.31 $41.15 $42.56 $41.37 $43.24 $54.57
New York - Downtown $60.23 $59.67 $62.92 $63.72 $63.57 $67.88
New York - Midtown $76.94 $77.06 $77.44 $76.12 $75.03 $81.69
New York – Midtown South $68.87 $69.13 $71.07 $76.42 $76.82 $95.80
Northern VA $32.68 $32.63 $32.69 $32.79 $32.87 $35.46
Oakland/East Bay, CA* $31.06 $31.04 $31.99 $32.71 $33.39 $40.58
Omaha, NE $17.13 $20.15 $20.29 $20.76 $21.22 $27.38
Orange County, CA $31.82 $34.03 $34.36 $35.55 $35.66 $39.52
Orlando, FL $21.44 $21.57 $22.36 $22.46 $22.85 $26.48
Palm Beach, FL $37.15 $36.87 $36.79 $36.89 $37.04 $44.90
Philadelphia, PA $25.86 $25.64 $25.52 $26.07 $26.80 $28.89
Phoenix, AZ $25.11 $25.22 $25.28 $25.43 $25.83 $30.30
Pittsburgh, PA $19.76 $18.99 $19.20 $19.42 $19.92 $26.45
Portland, OR $27.35 $27.81 $27.99 $29.44 $29.45 $33.47
Providence, RI $18.58 $18.60 $18.62 $18.64 $18.65 $24.28
Puget Sound - Eastside $34.60 $34.65 $34.96 $35.78 $35.56 $40.31
Raleigh/Durham, NC $24.05 $24.35 $25.28 $25.60 $26.24 $28.36
Richmond, VA $18.89 $19.04 $18.94 $19.40 $19.14 $21.68
Roanoke, VA $15.97 $16.31 $15.50 $15.55 $15.51 $18.32
Rochester, NY $19.75 $18.00 $18.00 $18.00 $18.00 $20.66
Sacramento, CA $22.15 $22.16 $22.50 $22.84 $22.69 $28.19
Salt Lake City, UT $24.32 $24.18 $24.37 $24.66 $24.31 $30.52
San Antonio, TX $21.49 $22.05 $22.05 $22.43 $22.34 $25.93
San Diego, CA $35.52 $36.24 $36.24 $36.36 $36.96 $42.36
San Francisco North Bay, CA $29.71 $30.49 $31.32 $32.29 $32.53 $36.17
San Francisco, CA $71.02 $71.40 $72.30 $74.72 $75.57 $79.27
San Juan, PR $18.06 $19.92 $18.05 $18.11 $18.05 $19.99
San Mateo County, CA $57.15 $58.06 $58.69 $57.98 $60.82 $61.42
San Jose (Silicon Valley), CA* $38.32 $36.42 $36.71 $37.65 $39.23 $56.64
Savannah, GA $19.79 $19.79 $20.02 $20.02 $20.45 $24.23
Seattle, WA $35.34 $33.99 $34.40 $35.10 $34.68 $39.36
Southern New Hampshire $17.32 $17.09 $16.85 $16.96 $16.92 $17.88
St. Louis, MO $19.61 $18.75 $18.90 $19.11 $19.40 $22.46
St. Petersburg/Clearwater, FL $22.08 $22.00 $21.97 $22.97 $22.99 $25.95
Suburban MD $26.85 $26.92 $27.27 $27.85 $27.62 $30.78
Syracuse, NY $15.90 $15.82 $16.59 $16.93 $17.08 $18.87
Tampa, FL $24.88 $24.83 $25.39 $26.21 $26.07 $29.58
Tucson, AZ $18.93 $19.56 $18.85 $19.16 $19.16 $23.82
Tulsa, OK $13.43 $13.43 $15.27 $15.58 $15.26 $18.84
Washington, DC $55.00 $54.75 $55.01 $54.41 $54.34 $61.47
Westchester County, NY $29.06 $28.34 $27.85 $27.45 $27.59 $28.00
p = preliminary
*Includes R&D
MarketBeat U.S. Office Q4 2018 cushmanwakefield.com | 9
Inventory Inventory Deliveries 2018 Under Construction as of Q4 2018p
United States 5,342,556,912 52,724,147 114,218,412
Northeast 1,232,832,742 10,527,689 24,188,657
Midwest 846,895,079 6,652,802 13,666,860
South 1,775,443,697 18,813,783 41,648,392
West 1,487,385,394 16,729,873 34,714,503
U.S. Office Report Markets Inventory Deliveries 2018 Under Construction as of Q4 2018p
Atlanta, GA 142,829,213 1,744,777 3,487,709
Austin, TX 51,011,410 1,172,474 3,961,648
Baltimore, MD 76,842,023 962,566 1,013,858
Binghamton, NY 4,642,804 90,000 0
Birmingham, AL 19,841,737 242,000 138,000
Boston, MA 162,408,363 2,017,189 3,068,442
Buffalo, NY 22,183,301 0 185,000
Charleston, SC 25,523,105 893,520 711,134
Charlotte, NC 107,829,314 439,718 3,865,532
Chicago, IL 234,308,571 2,130,735 5,205,738
Cincinnati, OH 33,656,170 42,503 0
Cleveland, OH 150,313,936 1,237,524 671,733
Colorado Springs, CO 28,491,332 0 202,045
Columbus, OH 29,140,191 645,181 777,067
Dallas/Fort Worth, TX 234,573,006 3,574,141 3,240,813
Dayton, OH 13,752,128 39,000 136,634
Denver, CO 117,443,432 2,971,108 2,127,886
Detroit, MI 110,398,287 196,288 505,296
El Paso, TX 17,961,572 89,000 449,444
Fairfield County, CT 39,433,690 0 532,258
Fort Myers/Naples, FL 20,145,445 0 656,800
Fredericksburg, VA 9,473,538 10,059 0
Ft. Lauderdale, FL 27,671,960 205,984 707,557
Greenville, SC 26,784,146 0 143,057
Hampton Roads, VA 42,122,215 88,687 646,565
Hartford, CT 24,248,156 0 24,900
Houston, TX 185,418,562 852,395 2,162,557
Indianapolis, IN 37,187,007 202,775 639,470
Inland Empire CA 21,885,514 0 31,500
Jacksonville, FL 23,986,466 230,904 343,700
Kansas City, MO 50,209,170 274,440 515,603
Las Vegas, NV 60,786,360 606,080 456,878
Long Island, NY 34,672,781 0 48,000
Los Angeles CBD 27,574,918 0 0
Los Angeles Metro 173,104,709 629,788 2,385,668
Louisville, KY 20,319,201 198,237 260,000
Memphis, TN 30,339,948 55,000 120,000
Miami, FL 47,602,226 616,185 1,480,309
Milwaukee, WI 28,576,517 60,062 540,817
Minneapolis/St. Paul, MN 74,458,970 1,105,718 2,238,700
Nashville, TN 38,823,426 302,924 2,933,817
New Haven, CT 10,713,686 0 0
New Jersey - Central 82,408,311 97,500 0
Inventory
MarketBeat U.S. Office Q4 2018 cushmanwakefield.com | 10
Inventory Inventory Deliveries 2018 Under Construction as of Q4 2018p
New Jersey - Northern 108,828,105 130,000 1,000,000
New Orleans, LA 25,706,748 0 n/a
New York - Brooklyn 29,785,483 1,183,588 1,582,378
New York - Downtown 89,729,615 2,602,472 233,372
New York - Midtown 242,463,708 1,489,770 14,502,081
New York – Midtown South 68,835,415 605,576 623,656
Northern VA 132,821,779 700,000 2,100,223
Oakland/East Bay, CA* 108,510,205 590,000 2,015,122
Omaha, NE 36,062,071 535,076 1,026,686
Orange County, CA 90,500,748 1,409,661 1,056,183
Orlando, FL 36,818,039 386,700 368,744
Palm Beach, FL 23,896,055 0 333,176
Philadelphia, PA 132,561,666 1,484,921 440,000
Phoenix, AZ 102,920,586 1,280,547 2,712,626
Pittsburgh, PA 90,781,763 301,673 1,578,042
Portland, OR 50,190,631 1,455,770 930,149
Providence, RI 19,651,000 490,000 210,000
Puget Sound - Eastside 34,838,767 0 718,257
Raleigh/Durham, NC 53,153,342 1,685,834 2,385,981
Richmond, VA 53,607,063 245,852 1,268,249
Roanoke, VA 16,642,616 0 0
Rochester, NY 14,069,668 0 45,000
Sacramento, CA 89,394,532 218,092 1,976,962
Salt Lake City, UT 37,679,091 756,223 707,974
San Antonio, TX 31,114,389 1,056,647 1,641,615
San Diego, CA 77,575,560 718,615 1,721,457
San Francisco North Bay, CA 20,943,152 0 17,091
San Francisco, CA 82,280,598 3,666,015 3,094,500
San Juan, PR 10,323,867 0 0
San Mateo County, CA 56,122,109 996,200 4,495,299
San Jose (Silicon Valley), CA* 216,782,745 965,949 5,303,090
Savannah, GA 3,423,381 10,000 67,892
Seattle, WA 63,903,550 275,590 4,313,900
Southern New Hampshire 14,599,575 30,000 65,000
St. Louis, MO 48,832,061 183,500 1,409,116
St. Petersburg/Clearwater, FL 11,987,903 0 0
Suburban MD 60,007,405 75,000 2,201,787
Syracuse, NY 16,115,718 5,000 50,528
Tampa, FL 31,181,259 150,000 580,051
Tucson, AZ 26,456,855 190,235 447,916
Tulsa, OK 25,060,607 0 264,000
Washington, DC 110,600,731 2,825,179 4,114,174
Westchester County, NY 24,699,934 0 0
Inventory
p = preliminary
*Includes R&D
Methodology
Cushman & Wakefield’s quarterly estimates are derived from a variety of data sources, including its own proprietary database, and
historical data from third party data sources. The market statistics are calculated from a base building inventory made up of office
properties deemed to be competitive in the local office markets. Generally, owner-occupied and federally-owned buildings are not
included. Single tenant buildings and privately-owned buildings in which the federal government leases space are included. Older
buildings unfit for occupancy or ones that require substantial renovation before tenancy are generally not included in the
competitive inventory. The inventory is subject to revisions due to resampling. Vacant space is defined as space that is available
immediately or imminently after the end of the quarter. Sublet space still occupied by the tenant is not counted as available space.
The figures provided for the current quarter are preliminary, and all information contained in the report is subject to correction of
errors and revisions based on additional data received.
Regional Map
West
Midwest
South
Northeast
Explanation of Terms
Total Inventory: The total amount of office space (in buildings of a
predetermined size by market) that can be rented by a third party.
Overall Vacancy Rate: The amount of unoccupied space (new, relet, and
sublet) expressed as a percentage of total inventory.
Direct Vacancy Rate: The amount of unoccupied space available directly
through the landlord, excludes sublease space.
Absorption: The net change in occupied space between two points in time.
(Total occupied space in the present quarter minus total occupied space from
the previous quarter, quoted on a net, not gross, basis.)
Leasing Activity: The sum of all leases over a period of time. This includes
pre-leasing activity as well as expansions. It does not include renewals.
Overall Weighted Asking Rents: Gross average asking rents weighted by the
amount of available direct and sublease space in Class A, B and C properties.
Class A Asking Rents: Gross average asking rents weighted by the amount of
available Class A direct and sublease space.
Ken McCarthy
Principal Economist
Americas Head of Applied Research
Tel: +1 212.841.7500
cushmanwakefield.com
About Cushman & Wakefield
Cushman & Wakefield (NYSE: CWK) is a leading global real estate services firm that
delivers exceptional value by putting ideas into action for real estate occupiers and
owners. Cushman & Wakefield is among the largest real estate services firms with
48,000 employees in approximately 400 offices and 70 countries. In 2017, the firm
had revenue of $6.9 billion across core services of property, facilities and project
management, leasing, capital markets, valuation and other services. To learn
more, visit www.cushmanwakefield.com or follow @CushWake on Twitter.
©2019 Cushman & Wakefield. All rights reserved. The information contained within this report is gathered from multiple sources believed to be reliable. The information may contain errors or omissions and is presented
without any warranty or representations as to its accuracy.
Revathi Greenwood
Americas Head of Research
Tel: +1 202.463.2100
cushmanwakefield.com

More Related Content

Similar to C&W MARKETBEAT- U.S. Office Q4 2018

Mercer Capital's Value Focus: Real Estate Industry | Q1 2018 | Segment Focus:...
Mercer Capital's Value Focus: Real Estate Industry | Q1 2018 | Segment Focus:...Mercer Capital's Value Focus: Real Estate Industry | Q1 2018 | Segment Focus:...
Mercer Capital's Value Focus: Real Estate Industry | Q1 2018 | Segment Focus:...Mercer Capital
 
Q1 - 2015 North American Industrial Highlights
Q1 - 2015 North American Industrial HighlightsQ1 - 2015 North American Industrial Highlights
Q1 - 2015 North American Industrial HighlightsCoy Davidson
 
Downtown Calgary Office Insight Report - Q4 2015
Downtown Calgary Office Insight Report - Q4 2015Downtown Calgary Office Insight Report - Q4 2015
Downtown Calgary Office Insight Report - Q4 2015Trent Peterson
 
JLL Global Market Perspective - November 2018
JLL Global Market Perspective - November 2018JLL Global Market Perspective - November 2018
JLL Global Market Perspective - November 2018Harrison West
 
Austin’s industrial market closes 2018 with new buildings and high absorption
Austin’s industrial market closes 2018 with new buildings and high absorptionAustin’s industrial market closes 2018 with new buildings and high absorption
Austin’s industrial market closes 2018 with new buildings and high absorptionColliers International | Houston
 
C&W MARKETBEAT- U.S OFFICE Q4 2016 – #CRE #REALESTATE
C&W MARKETBEAT- U.S OFFICE Q4 2016 – #CRE #REALESTATEC&W MARKETBEAT- U.S OFFICE Q4 2016 – #CRE #REALESTATE
C&W MARKETBEAT- U.S OFFICE Q4 2016 – #CRE #REALESTATEGuy Masse
 
Q3 2015 Industrial Brief
Q3 2015 Industrial BriefQ3 2015 Industrial Brief
Q3 2015 Industrial BriefRyan Searle
 
Commercial Real Estate Market Overview August 2015_tcm78-50654
Commercial Real Estate Market Overview August 2015_tcm78-50654Commercial Real Estate Market Overview August 2015_tcm78-50654
Commercial Real Estate Market Overview August 2015_tcm78-50654Yirong Song
 
U.S. office market statistics (Q4 2014) and 2015 outlook
U.S. office market statistics (Q4 2014) and 2015 outlook U.S. office market statistics (Q4 2014) and 2015 outlook
U.S. office market statistics (Q4 2014) and 2015 outlook JLL
 
4Q_2015_RetailReport_email
4Q_2015_RetailReport_email4Q_2015_RetailReport_email
4Q_2015_RetailReport_emailPatrick Anthon
 
JLL Grand Rapids Office Insight & Statistics - Q1 2018
JLL Grand Rapids Office Insight & Statistics - Q1 2018JLL Grand Rapids Office Insight & Statistics - Q1 2018
JLL Grand Rapids Office Insight & Statistics - Q1 2018Harrison West
 
2014 Q4 NORTH AMERICAN INDUSTRIAL HIGHLIGHTS
2014 Q4 NORTH AMERICAN INDUSTRIAL HIGHLIGHTS2014 Q4 NORTH AMERICAN INDUSTRIAL HIGHLIGHTS
2014 Q4 NORTH AMERICAN INDUSTRIAL HIGHLIGHTSCoy Davidson
 
Colliers toronto office leasing market report 2014
Colliers toronto office leasing market report 2014Colliers toronto office leasing market report 2014
Colliers toronto office leasing market report 2014Chris Fyvie
 
US_Office_MarketBeat_Q4-2020 (1).pdf
US_Office_MarketBeat_Q4-2020 (1).pdfUS_Office_MarketBeat_Q4-2020 (1).pdf
US_Office_MarketBeat_Q4-2020 (1).pdfRavneetSehmbi
 
Mercer Capital's Value Focus: Real Estate Industry | Q2 2018 | Segment Focus:...
Mercer Capital's Value Focus: Real Estate Industry | Q2 2018 | Segment Focus:...Mercer Capital's Value Focus: Real Estate Industry | Q2 2018 | Segment Focus:...
Mercer Capital's Value Focus: Real Estate Industry | Q2 2018 | Segment Focus:...Mercer Capital
 

Similar to C&W MARKETBEAT- U.S. Office Q4 2018 (20)

Mercer Capital's Value Focus: Real Estate Industry | Q1 2018 | Segment Focus:...
Mercer Capital's Value Focus: Real Estate Industry | Q1 2018 | Segment Focus:...Mercer Capital's Value Focus: Real Estate Industry | Q1 2018 | Segment Focus:...
Mercer Capital's Value Focus: Real Estate Industry | Q1 2018 | Segment Focus:...
 
Cincinnati Industrial Insight - Q2 2015
Cincinnati Industrial Insight - Q2 2015Cincinnati Industrial Insight - Q2 2015
Cincinnati Industrial Insight - Q2 2015
 
Q1 - 2015 North American Industrial Highlights
Q1 - 2015 North American Industrial HighlightsQ1 - 2015 North American Industrial Highlights
Q1 - 2015 North American Industrial Highlights
 
Downtown Calgary Office Insight Report - Q4 2015
Downtown Calgary Office Insight Report - Q4 2015Downtown Calgary Office Insight Report - Q4 2015
Downtown Calgary Office Insight Report - Q4 2015
 
JLL Global Market Perspective - November 2018
JLL Global Market Perspective - November 2018JLL Global Market Perspective - November 2018
JLL Global Market Perspective - November 2018
 
Austin’s industrial market closes 2018 with new buildings and high absorption
Austin’s industrial market closes 2018 with new buildings and high absorptionAustin’s industrial market closes 2018 with new buildings and high absorption
Austin’s industrial market closes 2018 with new buildings and high absorption
 
C&W MARKETBEAT- U.S OFFICE Q4 2016 – #CRE #REALESTATE
C&W MARKETBEAT- U.S OFFICE Q4 2016 – #CRE #REALESTATEC&W MARKETBEAT- U.S OFFICE Q4 2016 – #CRE #REALESTATE
C&W MARKETBEAT- U.S OFFICE Q4 2016 – #CRE #REALESTATE
 
Q3 2015 Industrial Brief
Q3 2015 Industrial BriefQ3 2015 Industrial Brief
Q3 2015 Industrial Brief
 
Q2 2018 Austin Office Research & Forecast Report
Q2 2018 Austin Office Research & Forecast ReportQ2 2018 Austin Office Research & Forecast Report
Q2 2018 Austin Office Research & Forecast Report
 
Commercial Real Estate Market Overview August 2015_tcm78-50654
Commercial Real Estate Market Overview August 2015_tcm78-50654Commercial Real Estate Market Overview August 2015_tcm78-50654
Commercial Real Estate Market Overview August 2015_tcm78-50654
 
U.S. office market statistics (Q4 2014) and 2015 outlook
U.S. office market statistics (Q4 2014) and 2015 outlook U.S. office market statistics (Q4 2014) and 2015 outlook
U.S. office market statistics (Q4 2014) and 2015 outlook
 
Q4 2017 | Austin Office | Research & Forecast Report
Q4 2017 | Austin Office | Research & Forecast ReportQ4 2017 | Austin Office | Research & Forecast Report
Q4 2017 | Austin Office | Research & Forecast Report
 
4Q_2015_RetailReport_email
4Q_2015_RetailReport_email4Q_2015_RetailReport_email
4Q_2015_RetailReport_email
 
Q4 2019 | Austin Office | Research & Forecast Report
Q4 2019 | Austin Office | Research & Forecast ReportQ4 2019 | Austin Office | Research & Forecast Report
Q4 2019 | Austin Office | Research & Forecast Report
 
JLL Grand Rapids Office Insight & Statistics - Q1 2018
JLL Grand Rapids Office Insight & Statistics - Q1 2018JLL Grand Rapids Office Insight & Statistics - Q1 2018
JLL Grand Rapids Office Insight & Statistics - Q1 2018
 
2014 Q4 NORTH AMERICAN INDUSTRIAL HIGHLIGHTS
2014 Q4 NORTH AMERICAN INDUSTRIAL HIGHLIGHTS2014 Q4 NORTH AMERICAN INDUSTRIAL HIGHLIGHTS
2014 Q4 NORTH AMERICAN INDUSTRIAL HIGHLIGHTS
 
Colliers toronto office leasing market report 2014
Colliers toronto office leasing market report 2014Colliers toronto office leasing market report 2014
Colliers toronto office leasing market report 2014
 
US_Office_MarketBeat_Q4-2020 (1).pdf
US_Office_MarketBeat_Q4-2020 (1).pdfUS_Office_MarketBeat_Q4-2020 (1).pdf
US_Office_MarketBeat_Q4-2020 (1).pdf
 
Q3 office
Q3 officeQ3 office
Q3 office
 
Mercer Capital's Value Focus: Real Estate Industry | Q2 2018 | Segment Focus:...
Mercer Capital's Value Focus: Real Estate Industry | Q2 2018 | Segment Focus:...Mercer Capital's Value Focus: Real Estate Industry | Q2 2018 | Segment Focus:...
Mercer Capital's Value Focus: Real Estate Industry | Q2 2018 | Segment Focus:...
 

More from Guy Masse

North America Industrial Construction Cost Guide 2023
North America Industrial Construction Cost Guide 2023North America Industrial Construction Cost Guide 2023
North America Industrial Construction Cost Guide 2023Guy Masse
 
Cushman &Wakefield Canadian-Employment-Report.pdf
 Cushman &Wakefield Canadian-Employment-Report.pdf Cushman &Wakefield Canadian-Employment-Report.pdf
Cushman &Wakefield Canadian-Employment-Report.pdfGuy Masse
 
C&W Q3 2021 Canadian Cap Rate Report
 C&W Q3 2021 Canadian  Cap Rate Report  C&W Q3 2021 Canadian  Cap Rate Report
C&W Q3 2021 Canadian Cap Rate Report Guy Masse
 
C&W Greater Montreal Area Industrial Scorecard - Q1 2021
C&W Greater Montreal Area  Industrial Scorecard - Q1 2021 C&W Greater Montreal Area  Industrial Scorecard - Q1 2021
C&W Greater Montreal Area Industrial Scorecard - Q1 2021 Guy Masse
 
C&W Greater Montreal Area Office Scorecard - Q1 2021
C&W Greater Montreal Area Office Scorecard - Q1 2021C&W Greater Montreal Area Office Scorecard - Q1 2021
C&W Greater Montreal Area Office Scorecard - Q1 2021Guy Masse
 
Cushman & Wakefield Toronto Americas Marketbeat Office Q1 2019
Cushman & Wakefield Toronto Americas Marketbeat Office Q1 2019 Cushman & Wakefield Toronto Americas Marketbeat Office Q1 2019
Cushman & Wakefield Toronto Americas Marketbeat Office Q1 2019 Guy Masse
 
Cushman & Wakefield Montreal Americas Marketbeat Office Q12019 #CRE #RealEstate
Cushman & Wakefield Montreal Americas Marketbeat Office Q12019  #CRE #RealEstateCushman & Wakefield Montreal Americas Marketbeat Office Q12019  #CRE #RealEstate
Cushman & Wakefield Montreal Americas Marketbeat Office Q12019 #CRE #RealEstateGuy Masse
 
C&W-Canadian Office Stats -Q1 2019 - #cre #realestate
 C&W-Canadian Office Stats -Q1 2019 - #cre #realestate C&W-Canadian Office Stats -Q1 2019 - #cre #realestate
C&W-Canadian Office Stats -Q1 2019 - #cre #realestateGuy Masse
 
Headquarters Lessons Learned - Cushman & Wakefield Report #CRE #RealEstate
Headquarters Lessons Learned - Cushman & Wakefield Report #CRE #RealEstateHeadquarters Lessons Learned - Cushman & Wakefield Report #CRE #RealEstate
Headquarters Lessons Learned - Cushman & Wakefield Report #CRE #RealEstateGuy Masse
 
Cushman & Wakefield's Canadian Office Statistical Summary Q4 2018
Cushman & Wakefield's Canadian Office Statistical Summary Q4 2018Cushman & Wakefield's Canadian Office Statistical Summary Q4 2018
Cushman & Wakefield's Canadian Office Statistical Summary Q4 2018Guy Masse
 
C&W-Marketbeat-U.S.Shopping Center-Q3-2018 #CRE #REALESTATE #RETAIL
C&W-Marketbeat-U.S.Shopping Center-Q3-2018 #CRE #REALESTATE #RETAILC&W-Marketbeat-U.S.Shopping Center-Q3-2018 #CRE #REALESTATE #RETAIL
C&W-Marketbeat-U.S.Shopping Center-Q3-2018 #CRE #REALESTATE #RETAILGuy Masse
 
C&W REAL ESTATE MARKET REPORTS : WORKPLACE 2025 #CRE
C&W REAL ESTATE MARKET REPORTS : WORKPLACE 2025 #CREC&W REAL ESTATE MARKET REPORTS : WORKPLACE 2025 #CRE
C&W REAL ESTATE MARKET REPORTS : WORKPLACE 2025 #CREGuy Masse
 
Cushman & Wakefield Q12018 Canadian Office Statistical Summary
 Cushman & Wakefield Q12018 Canadian Office Statistical Summary Cushman & Wakefield Q12018 Canadian Office Statistical Summary
Cushman & Wakefield Q12018 Canadian Office Statistical SummaryGuy Masse
 
90,000 SF OF CLASS A OFFICE SPACE FOR SUBLEASE
90,000 SF OF CLASS A OFFICE SPACE  FOR SUBLEASE90,000 SF OF CLASS A OFFICE SPACE  FOR SUBLEASE
90,000 SF OF CLASS A OFFICE SPACE FOR SUBLEASEGuy Masse
 
Trump100 days- Implications for the Property Markets
Trump100 days-  Implications for the Property Markets Trump100 days-  Implications for the Property Markets
Trump100 days- Implications for the Property Markets Guy Masse
 
C&W MARKETBEAT- RETAIL Q4 2016 – #CRE #REALESTATE #CCIM #SIOR @YOURTENANTREP
C&W MARKETBEAT- RETAIL Q4 2016 – #CRE #REALESTATE #CCIM #SIOR @YOURTENANTREPC&W MARKETBEAT- RETAIL Q4 2016 – #CRE #REALESTATE #CCIM #SIOR @YOURTENANTREP
C&W MARKETBEAT- RETAIL Q4 2016 – #CRE #REALESTATE #CCIM #SIOR @YOURTENANTREPGuy Masse
 
C&W MARKETBEAT- CAPITAL MARKETS Q4 2016 – #CRE #REALESTATE #CCIM #SIOR @YOURT...
C&W MARKETBEAT- CAPITAL MARKETS Q4 2016 – #CRE #REALESTATE #CCIM #SIOR @YOURT...C&W MARKETBEAT- CAPITAL MARKETS Q4 2016 – #CRE #REALESTATE #CCIM #SIOR @YOURT...
C&W MARKETBEAT- CAPITAL MARKETS Q4 2016 – #CRE #REALESTATE #CCIM #SIOR @YOURT...Guy Masse
 
C&W MARKETBEAT- U.S INDUSTRIAL Q4 2016 – #CRE #REALESTATE #CCIM #SIOR
C&W MARKETBEAT- U.S INDUSTRIAL Q4 2016 – #CRE #REALESTATE #CCIM #SIORC&W MARKETBEAT- U.S INDUSTRIAL Q4 2016 – #CRE #REALESTATE #CCIM #SIOR
C&W MARKETBEAT- U.S INDUSTRIAL Q4 2016 – #CRE #REALESTATE #CCIM #SIORGuy Masse
 
Cushman & Wakefield Atlas outlook 2016
Cushman & Wakefield Atlas outlook 2016Cushman & Wakefield Atlas outlook 2016
Cushman & Wakefield Atlas outlook 2016Guy Masse
 
Atlas outlook 2016- Cushman & Wakefied
Atlas outlook 2016- Cushman & WakefiedAtlas outlook 2016- Cushman & Wakefied
Atlas outlook 2016- Cushman & WakefiedGuy Masse
 

More from Guy Masse (20)

North America Industrial Construction Cost Guide 2023
North America Industrial Construction Cost Guide 2023North America Industrial Construction Cost Guide 2023
North America Industrial Construction Cost Guide 2023
 
Cushman &Wakefield Canadian-Employment-Report.pdf
 Cushman &Wakefield Canadian-Employment-Report.pdf Cushman &Wakefield Canadian-Employment-Report.pdf
Cushman &Wakefield Canadian-Employment-Report.pdf
 
C&W Q3 2021 Canadian Cap Rate Report
 C&W Q3 2021 Canadian  Cap Rate Report  C&W Q3 2021 Canadian  Cap Rate Report
C&W Q3 2021 Canadian Cap Rate Report
 
C&W Greater Montreal Area Industrial Scorecard - Q1 2021
C&W Greater Montreal Area  Industrial Scorecard - Q1 2021 C&W Greater Montreal Area  Industrial Scorecard - Q1 2021
C&W Greater Montreal Area Industrial Scorecard - Q1 2021
 
C&W Greater Montreal Area Office Scorecard - Q1 2021
C&W Greater Montreal Area Office Scorecard - Q1 2021C&W Greater Montreal Area Office Scorecard - Q1 2021
C&W Greater Montreal Area Office Scorecard - Q1 2021
 
Cushman & Wakefield Toronto Americas Marketbeat Office Q1 2019
Cushman & Wakefield Toronto Americas Marketbeat Office Q1 2019 Cushman & Wakefield Toronto Americas Marketbeat Office Q1 2019
Cushman & Wakefield Toronto Americas Marketbeat Office Q1 2019
 
Cushman & Wakefield Montreal Americas Marketbeat Office Q12019 #CRE #RealEstate
Cushman & Wakefield Montreal Americas Marketbeat Office Q12019  #CRE #RealEstateCushman & Wakefield Montreal Americas Marketbeat Office Q12019  #CRE #RealEstate
Cushman & Wakefield Montreal Americas Marketbeat Office Q12019 #CRE #RealEstate
 
C&W-Canadian Office Stats -Q1 2019 - #cre #realestate
 C&W-Canadian Office Stats -Q1 2019 - #cre #realestate C&W-Canadian Office Stats -Q1 2019 - #cre #realestate
C&W-Canadian Office Stats -Q1 2019 - #cre #realestate
 
Headquarters Lessons Learned - Cushman & Wakefield Report #CRE #RealEstate
Headquarters Lessons Learned - Cushman & Wakefield Report #CRE #RealEstateHeadquarters Lessons Learned - Cushman & Wakefield Report #CRE #RealEstate
Headquarters Lessons Learned - Cushman & Wakefield Report #CRE #RealEstate
 
Cushman & Wakefield's Canadian Office Statistical Summary Q4 2018
Cushman & Wakefield's Canadian Office Statistical Summary Q4 2018Cushman & Wakefield's Canadian Office Statistical Summary Q4 2018
Cushman & Wakefield's Canadian Office Statistical Summary Q4 2018
 
C&W-Marketbeat-U.S.Shopping Center-Q3-2018 #CRE #REALESTATE #RETAIL
C&W-Marketbeat-U.S.Shopping Center-Q3-2018 #CRE #REALESTATE #RETAILC&W-Marketbeat-U.S.Shopping Center-Q3-2018 #CRE #REALESTATE #RETAIL
C&W-Marketbeat-U.S.Shopping Center-Q3-2018 #CRE #REALESTATE #RETAIL
 
C&W REAL ESTATE MARKET REPORTS : WORKPLACE 2025 #CRE
C&W REAL ESTATE MARKET REPORTS : WORKPLACE 2025 #CREC&W REAL ESTATE MARKET REPORTS : WORKPLACE 2025 #CRE
C&W REAL ESTATE MARKET REPORTS : WORKPLACE 2025 #CRE
 
Cushman & Wakefield Q12018 Canadian Office Statistical Summary
 Cushman & Wakefield Q12018 Canadian Office Statistical Summary Cushman & Wakefield Q12018 Canadian Office Statistical Summary
Cushman & Wakefield Q12018 Canadian Office Statistical Summary
 
90,000 SF OF CLASS A OFFICE SPACE FOR SUBLEASE
90,000 SF OF CLASS A OFFICE SPACE  FOR SUBLEASE90,000 SF OF CLASS A OFFICE SPACE  FOR SUBLEASE
90,000 SF OF CLASS A OFFICE SPACE FOR SUBLEASE
 
Trump100 days- Implications for the Property Markets
Trump100 days-  Implications for the Property Markets Trump100 days-  Implications for the Property Markets
Trump100 days- Implications for the Property Markets
 
C&W MARKETBEAT- RETAIL Q4 2016 – #CRE #REALESTATE #CCIM #SIOR @YOURTENANTREP
C&W MARKETBEAT- RETAIL Q4 2016 – #CRE #REALESTATE #CCIM #SIOR @YOURTENANTREPC&W MARKETBEAT- RETAIL Q4 2016 – #CRE #REALESTATE #CCIM #SIOR @YOURTENANTREP
C&W MARKETBEAT- RETAIL Q4 2016 – #CRE #REALESTATE #CCIM #SIOR @YOURTENANTREP
 
C&W MARKETBEAT- CAPITAL MARKETS Q4 2016 – #CRE #REALESTATE #CCIM #SIOR @YOURT...
C&W MARKETBEAT- CAPITAL MARKETS Q4 2016 – #CRE #REALESTATE #CCIM #SIOR @YOURT...C&W MARKETBEAT- CAPITAL MARKETS Q4 2016 – #CRE #REALESTATE #CCIM #SIOR @YOURT...
C&W MARKETBEAT- CAPITAL MARKETS Q4 2016 – #CRE #REALESTATE #CCIM #SIOR @YOURT...
 
C&W MARKETBEAT- U.S INDUSTRIAL Q4 2016 – #CRE #REALESTATE #CCIM #SIOR
C&W MARKETBEAT- U.S INDUSTRIAL Q4 2016 – #CRE #REALESTATE #CCIM #SIORC&W MARKETBEAT- U.S INDUSTRIAL Q4 2016 – #CRE #REALESTATE #CCIM #SIOR
C&W MARKETBEAT- U.S INDUSTRIAL Q4 2016 – #CRE #REALESTATE #CCIM #SIOR
 
Cushman & Wakefield Atlas outlook 2016
Cushman & Wakefield Atlas outlook 2016Cushman & Wakefield Atlas outlook 2016
Cushman & Wakefield Atlas outlook 2016
 
Atlas outlook 2016- Cushman & Wakefied
Atlas outlook 2016- Cushman & WakefiedAtlas outlook 2016- Cushman & Wakefied
Atlas outlook 2016- Cushman & Wakefied
 

Recently uploaded

Telibagh & Call Girls Lucknow - 450+ Call Girl Cash Payment 🎂 8923113531 🎪 Ne...
Telibagh & Call Girls Lucknow - 450+ Call Girl Cash Payment 🎂 8923113531 🎪 Ne...Telibagh & Call Girls Lucknow - 450+ Call Girl Cash Payment 🎂 8923113531 🎪 Ne...
Telibagh & Call Girls Lucknow - 450+ Call Girl Cash Payment 🎂 8923113531 🎪 Ne...gurkirankumar98700
 
Low Rate Call Girls in Tughlakabad Delhi Call 9990771857
Low Rate Call Girls in Tughlakabad Delhi Call 9990771857Low Rate Call Girls in Tughlakabad Delhi Call 9990771857
Low Rate Call Girls in Tughlakabad Delhi Call 9990771857delhimodel235
 
9990771857 Call Girls in Noida Sector 03 Noida (Call Girls) Delhi
9990771857 Call Girls in Noida Sector 03 Noida (Call Girls) Delhi9990771857 Call Girls in Noida Sector 03 Noida (Call Girls) Delhi
9990771857 Call Girls in Noida Sector 03 Noida (Call Girls) Delhidelhimodel235
 
Model Call Girl in Shastri Nagar Delhi reach out to us at 🔝8264348440🔝
Model Call Girl in Shastri Nagar Delhi reach out to us at 🔝8264348440🔝Model Call Girl in Shastri Nagar Delhi reach out to us at 🔝8264348440🔝
Model Call Girl in Shastri Nagar Delhi reach out to us at 🔝8264348440🔝soniya singh
 
SSPL The Strand Abodes Kharadi Pune Brochure.pdf
SSPL The Strand Abodes Kharadi Pune Brochure.pdfSSPL The Strand Abodes Kharadi Pune Brochure.pdf
SSPL The Strand Abodes Kharadi Pune Brochure.pdfabbu831446
 
Call Girls In Mayur Vihar-1 Delhi ❤️8860477959 Good Looking Escorts In 24/7 D...
Call Girls In Mayur Vihar-1 Delhi ❤️8860477959 Good Looking Escorts In 24/7 D...Call Girls In Mayur Vihar-1 Delhi ❤️8860477959 Good Looking Escorts In 24/7 D...
Call Girls In Mayur Vihar-1 Delhi ❤️8860477959 Good Looking Escorts In 24/7 D...lizamodels9
 
Call Girls in Khan Market 9654467111 ESCORTS SERVICE
Call Girls in Khan Market 9654467111 ESCORTS SERVICECall Girls in Khan Market 9654467111 ESCORTS SERVICE
Call Girls in Khan Market 9654467111 ESCORTS SERVICESapana Sha
 
Purva Palm Hills Devanahalli, Bangalore E- Brochure.pdf
Purva Palm Hills Devanahalli, Bangalore E- Brochure.pdfPurva Palm Hills Devanahalli, Bangalore E- Brochure.pdf
Purva Palm Hills Devanahalli, Bangalore E- Brochure.pdffaheemali990101
 
Building Dreams: Newman Leech's Visionary Approach to Real Estate Investment
Building Dreams: Newman Leech's Visionary Approach to Real Estate InvestmentBuilding Dreams: Newman Leech's Visionary Approach to Real Estate Investment
Building Dreams: Newman Leech's Visionary Approach to Real Estate InvestmentNewman George Leech
 
83770-87607 ۞Call Girls In Near The Park Hotel (Cp) Delhi
83770-87607 ۞Call Girls In Near The Park Hotel (Cp) Delhi83770-87607 ۞Call Girls In Near The Park Hotel (Cp) Delhi
83770-87607 ۞Call Girls In Near The Park Hotel (Cp) Delhidollysharma2066
 
Call Girls in Noida Sector 11 Noida 💯Call Us 🔝 9582086666 🔝 South Delhi Escor...
Call Girls in Noida Sector 11 Noida 💯Call Us 🔝 9582086666 🔝 South Delhi Escor...Call Girls in Noida Sector 11 Noida 💯Call Us 🔝 9582086666 🔝 South Delhi Escor...
Call Girls in Noida Sector 11 Noida 💯Call Us 🔝 9582086666 🔝 South Delhi Escor...delhimodel235
 
Omaxe Dwarka In Delhi E Brochure Pdf
Omaxe Dwarka In Delhi E Brochure     PdfOmaxe Dwarka In Delhi E Brochure     Pdf
Omaxe Dwarka In Delhi E Brochure Pdfashiyadav24
 
9711199012 Call {Girls Delhi} Very Low rate Vaishali DownLoad PDF
9711199012 Call {Girls Delhi} Very Low rate Vaishali DownLoad PDF9711199012 Call {Girls Delhi} Very Low rate Vaishali DownLoad PDF
9711199012 Call {Girls Delhi} Very Low rate Vaishali DownLoad PDFMs Riya
 
9990771857 Call Girls in Noida Sector 1 Noida (Call Girls) Delhi
9990771857 Call Girls in Noida Sector 1 Noida (Call Girls) Delhi9990771857 Call Girls in Noida Sector 1 Noida (Call Girls) Delhi
9990771857 Call Girls in Noida Sector 1 Noida (Call Girls) Delhidelhimodel235
 
9990771857 Call Girls in Noida Sector 06 Noida (Call Girls) Delhi
9990771857 Call Girls in Noida Sector 06 Noida (Call Girls) Delhi9990771857 Call Girls in Noida Sector 06 Noida (Call Girls) Delhi
9990771857 Call Girls in Noida Sector 06 Noida (Call Girls) Delhidelhimodel235
 
Low Rate Call Girls in Triveni Complex Delhi Call 9990771857
Low Rate Call Girls in Triveni Complex Delhi Call 9990771857Low Rate Call Girls in Triveni Complex Delhi Call 9990771857
Low Rate Call Girls in Triveni Complex Delhi Call 9990771857delhimodel235
 
Call Girls In Madipur Metro Delhi꧁ +91)8447779280꧂Low Rate 2 short 2000 full ...
Call Girls In Madipur Metro Delhi꧁ +91)8447779280꧂Low Rate 2 short 2000 full ...Call Girls In Madipur Metro Delhi꧁ +91)8447779280꧂Low Rate 2 short 2000 full ...
Call Girls In Madipur Metro Delhi꧁ +91)8447779280꧂Low Rate 2 short 2000 full ...asmaqueen5
 
Rustomjee The Panorama At Pali Hill, Bandra West, Mumbai - Brochure.pdf
Rustomjee The Panorama At Pali Hill, Bandra West, Mumbai - Brochure.pdfRustomjee The Panorama At Pali Hill, Bandra West, Mumbai - Brochure.pdf
Rustomjee The Panorama At Pali Hill, Bandra West, Mumbai - Brochure.pdfmonikasharma630
 
Eco-Efficient Living: Redefining Sustainability through Leech's Green Design ...
Eco-Efficient Living: Redefining Sustainability through Leech's Green Design ...Eco-Efficient Living: Redefining Sustainability through Leech's Green Design ...
Eco-Efficient Living: Redefining Sustainability through Leech's Green Design ...Newman George Leech
 

Recently uploaded (20)

Hot call girls in Moti Bagh🔝 9953056974 🔝 escort Service
Hot call girls in Moti Bagh🔝 9953056974 🔝 escort ServiceHot call girls in Moti Bagh🔝 9953056974 🔝 escort Service
Hot call girls in Moti Bagh🔝 9953056974 🔝 escort Service
 
Telibagh & Call Girls Lucknow - 450+ Call Girl Cash Payment 🎂 8923113531 🎪 Ne...
Telibagh & Call Girls Lucknow - 450+ Call Girl Cash Payment 🎂 8923113531 🎪 Ne...Telibagh & Call Girls Lucknow - 450+ Call Girl Cash Payment 🎂 8923113531 🎪 Ne...
Telibagh & Call Girls Lucknow - 450+ Call Girl Cash Payment 🎂 8923113531 🎪 Ne...
 
Low Rate Call Girls in Tughlakabad Delhi Call 9990771857
Low Rate Call Girls in Tughlakabad Delhi Call 9990771857Low Rate Call Girls in Tughlakabad Delhi Call 9990771857
Low Rate Call Girls in Tughlakabad Delhi Call 9990771857
 
9990771857 Call Girls in Noida Sector 03 Noida (Call Girls) Delhi
9990771857 Call Girls in Noida Sector 03 Noida (Call Girls) Delhi9990771857 Call Girls in Noida Sector 03 Noida (Call Girls) Delhi
9990771857 Call Girls in Noida Sector 03 Noida (Call Girls) Delhi
 
Model Call Girl in Shastri Nagar Delhi reach out to us at 🔝8264348440🔝
Model Call Girl in Shastri Nagar Delhi reach out to us at 🔝8264348440🔝Model Call Girl in Shastri Nagar Delhi reach out to us at 🔝8264348440🔝
Model Call Girl in Shastri Nagar Delhi reach out to us at 🔝8264348440🔝
 
SSPL The Strand Abodes Kharadi Pune Brochure.pdf
SSPL The Strand Abodes Kharadi Pune Brochure.pdfSSPL The Strand Abodes Kharadi Pune Brochure.pdf
SSPL The Strand Abodes Kharadi Pune Brochure.pdf
 
Call Girls In Mayur Vihar-1 Delhi ❤️8860477959 Good Looking Escorts In 24/7 D...
Call Girls In Mayur Vihar-1 Delhi ❤️8860477959 Good Looking Escorts In 24/7 D...Call Girls In Mayur Vihar-1 Delhi ❤️8860477959 Good Looking Escorts In 24/7 D...
Call Girls In Mayur Vihar-1 Delhi ❤️8860477959 Good Looking Escorts In 24/7 D...
 
Call Girls in Khan Market 9654467111 ESCORTS SERVICE
Call Girls in Khan Market 9654467111 ESCORTS SERVICECall Girls in Khan Market 9654467111 ESCORTS SERVICE
Call Girls in Khan Market 9654467111 ESCORTS SERVICE
 
Purva Palm Hills Devanahalli, Bangalore E- Brochure.pdf
Purva Palm Hills Devanahalli, Bangalore E- Brochure.pdfPurva Palm Hills Devanahalli, Bangalore E- Brochure.pdf
Purva Palm Hills Devanahalli, Bangalore E- Brochure.pdf
 
Building Dreams: Newman Leech's Visionary Approach to Real Estate Investment
Building Dreams: Newman Leech's Visionary Approach to Real Estate InvestmentBuilding Dreams: Newman Leech's Visionary Approach to Real Estate Investment
Building Dreams: Newman Leech's Visionary Approach to Real Estate Investment
 
83770-87607 ۞Call Girls In Near The Park Hotel (Cp) Delhi
83770-87607 ۞Call Girls In Near The Park Hotel (Cp) Delhi83770-87607 ۞Call Girls In Near The Park Hotel (Cp) Delhi
83770-87607 ۞Call Girls In Near The Park Hotel (Cp) Delhi
 
Call Girls in Noida Sector 11 Noida 💯Call Us 🔝 9582086666 🔝 South Delhi Escor...
Call Girls in Noida Sector 11 Noida 💯Call Us 🔝 9582086666 🔝 South Delhi Escor...Call Girls in Noida Sector 11 Noida 💯Call Us 🔝 9582086666 🔝 South Delhi Escor...
Call Girls in Noida Sector 11 Noida 💯Call Us 🔝 9582086666 🔝 South Delhi Escor...
 
Omaxe Dwarka In Delhi E Brochure Pdf
Omaxe Dwarka In Delhi E Brochure     PdfOmaxe Dwarka In Delhi E Brochure     Pdf
Omaxe Dwarka In Delhi E Brochure Pdf
 
9711199012 Call {Girls Delhi} Very Low rate Vaishali DownLoad PDF
9711199012 Call {Girls Delhi} Very Low rate Vaishali DownLoad PDF9711199012 Call {Girls Delhi} Very Low rate Vaishali DownLoad PDF
9711199012 Call {Girls Delhi} Very Low rate Vaishali DownLoad PDF
 
9990771857 Call Girls in Noida Sector 1 Noida (Call Girls) Delhi
9990771857 Call Girls in Noida Sector 1 Noida (Call Girls) Delhi9990771857 Call Girls in Noida Sector 1 Noida (Call Girls) Delhi
9990771857 Call Girls in Noida Sector 1 Noida (Call Girls) Delhi
 
9990771857 Call Girls in Noida Sector 06 Noida (Call Girls) Delhi
9990771857 Call Girls in Noida Sector 06 Noida (Call Girls) Delhi9990771857 Call Girls in Noida Sector 06 Noida (Call Girls) Delhi
9990771857 Call Girls in Noida Sector 06 Noida (Call Girls) Delhi
 
Low Rate Call Girls in Triveni Complex Delhi Call 9990771857
Low Rate Call Girls in Triveni Complex Delhi Call 9990771857Low Rate Call Girls in Triveni Complex Delhi Call 9990771857
Low Rate Call Girls in Triveni Complex Delhi Call 9990771857
 
Call Girls In Madipur Metro Delhi꧁ +91)8447779280꧂Low Rate 2 short 2000 full ...
Call Girls In Madipur Metro Delhi꧁ +91)8447779280꧂Low Rate 2 short 2000 full ...Call Girls In Madipur Metro Delhi꧁ +91)8447779280꧂Low Rate 2 short 2000 full ...
Call Girls In Madipur Metro Delhi꧁ +91)8447779280꧂Low Rate 2 short 2000 full ...
 
Rustomjee The Panorama At Pali Hill, Bandra West, Mumbai - Brochure.pdf
Rustomjee The Panorama At Pali Hill, Bandra West, Mumbai - Brochure.pdfRustomjee The Panorama At Pali Hill, Bandra West, Mumbai - Brochure.pdf
Rustomjee The Panorama At Pali Hill, Bandra West, Mumbai - Brochure.pdf
 
Eco-Efficient Living: Redefining Sustainability through Leech's Green Design ...
Eco-Efficient Living: Redefining Sustainability through Leech's Green Design ...Eco-Efficient Living: Redefining Sustainability through Leech's Green Design ...
Eco-Efficient Living: Redefining Sustainability through Leech's Green Design ...
 

C&W MARKETBEAT- U.S. Office Q4 2018

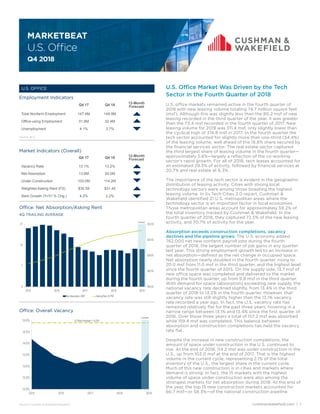
  • 1. cushmanwakefield.com | 1 U.S. Office Q4 2018 MARKETBEAT U.S. Office Market Was Driven by the Tech Sector in the Fourth Quarter of 2018 U.S. office markets remained active in the fourth quarter of 2018 with new leasing volume totaling 74.7 million square feet (msf). Although this was slightly less than the 80.2 msf of new leasing recorded in the third quarter of the year, it was greater than the 73.4 msf recorded in the fourth quarter of 2017. New leasing volume for 2018 was 311.9 msf, only slightly lower than the cyclical high of 314.8 msf in 2017. In the fourth quarter the tech sector accounted for slightly more than one-third (34.4%) of the leasing volume, well ahead of the 18.8% share secured by the financial services sector. The real estate sector captured the third largest share of leasing volume in the fourth quarter— approximately 5.6%—largely a reflection of the co-working sector’s rapid growth. For all of 2018, tech leases accounted for an estimated 29.3% of activity, followed by financial services at 20.7% and real estate at 6.3%. The importance of the tech sector is evident in the geographic distribution of leasing activity. Cities with strong local technology sectors were among those boasting the highest leasing volume. In its Tech Cities 2.0 report, Cushman & Wakefield identified 21 U.S. metropolitan areas where the technology sector is an important factor in local economies. Those metropolitan areas account for approximately 59.2% of the total inventory tracked by Cushman & Wakefield. In the fourth quarter of 2018, they captured 72.5% of the new leasing activity, and 70.7% of activity for the year. Absorption exceeds construction completions, vacancy declines and the pipeline grows: The U.S. economy added 762,000 net new nonfarm payroll jobs during the fourth quarter of 2018, the largest number of job gains in any quarter last year. This strong employment growth led to an increase in net absorption—defined as the net change in occupied space. Net absorption nearly doubled in the fourth quarter, rising to 20.0 msf from 11.0 msf in the third quarter, and the highest level since the fourth quarter of 2015. On the supply side, 13.7 msf of new office space was completed and delivered to the market during the fourth quarter, up from 9.8 msf in the third quarter. With demand for space (absorption) exceeding new supply, the national vacancy rate declined slightly, from 13.4% in the third quarter of 2018 to 13.2% in the fourth quarter. However, that vacancy rate was still slightly higher than the 13.1% vacancy rate recorded a year ago. In fact, the U.S. vacancy rate has remained relatively flat for the past three years, hovering in a narrow range between 13.1% and 13.4% since the first quarter of 2016. Over those three years a total of 157.2 msf was absorbed while 159.4 msf was completed. This balance between absorption and construction completions has held the vacancy rate flat. Despite the increase in new construction completions, the amount of space under construction in the U.S. continued to rise. At the end of 2018, 114.2 msf was under construction in the U.S., up from 103.0 msf at the end of 2017. That is the highest volume in the current cycle, representing 2.1% of the total inventory of the U.S., the largest share in the current cycle. Much of this new construction is in cities and markets where demand is strong. In fact, the 15 markets with the highest volume of space under construction were also among the strongest markets for net absorption during 2018. At the end of the year, the top 15 new construction markets accounted for 66.7 msf—or 58.3%—of the national construction pipeline. U.S. OFFICE Office: Overall Vacancy Office: Net Absorption/Asking Rent 4Q TRAILING AVERAGE Market Indicators (Overall) Q4 17 Q4 18 12-Month Forecast Vacancy Rate 13.1% 13.2% Net Absorption 13.8M 20.0M Under Construction 103.0M 114.2M Weighted Asking Rent (FS) $30.59 $31.45 Rent Growth (Yr/Yr % Chg.) 4.2% 2.2% Employment Indicators Q4 17 Q4 18 12-Month Forecast Total Nonfarm Employment 147.4M 149.9M Office-using Employment 31.8M 32.4M Unemployment 4.1% 3.7% $24.00 $26.00 $28.00 $30.00 $32.00 0 7 14 21 2015 2016 2017 2018 2019 Net Absorption, MSF Asking Rent, $ PSF Forecast 12.0% 12.5% 13.0% 13.5% 14.0% 14.5% 15.0% 2015 2016 2017 2018 2019 10Year Average= 14.9% Forecast Source: Cushman & Wakefield Research Source: BLS
  • 2. cushmanwakefield.com | 2 U.S. Office Q4 2018 MARKETBEAT Office: Vacancy by Market Select Markets in the U.S. Office: Asking Rent by Market Highest Priced U.S. Markets Office: New Supply Looking Ahead The U.S. economy accelerated in 2018 fueled by tax cuts, rising optimism and synchronized global growth. This led to faster job growth and greater demand for office space as absorption increased. At the center of this growth was the tech sector which dominated new leasing. Tech-driv- en markets also experienced strong absorption during the year. Offsetting the impact of strong demand growth was rising new construction: 52.7 msf of new office space was completed in 2018—a fourth consecutive year during which completions topped 50.0 msf. The pipeline con- tinues to build, reaching a cyclical high of 114 msf. This new supply will weigh on markets during 2019. While Cushman & Wakefield expects continuing job growth, the overall trend in vacancy is expected to be flat. That will create pockets of opportunity for occupiers in some mar- kets across the U.S. this year where the supply/demand balance is tilted more toward tenants. Overall, 2019 is expected to be another year of balanced growth in both supply and demand. 6.2% 6.4% 7.2% 7.5% 7.6% 7.7% 8.0% 8.0% 8.9% 9.0% 9.2% 9.3% 9.6% 9.7% 9.7% 9.9% 10.6% 10.7% 10.8% 11.0% 2% 4% 6% 8% 10% 12% 14% National Average 13.2% 0 5 10 15 20 25 2015 2016 2017 2018 2019 MSF 10 Year Average = 10.7 MSF Forecast $76.82 $75.57 $75.03 $63.57 $60.82 $54.34 $43.24 $42.45 $39.59 $39.23 $38.69 $37.04 $36.97 $36.96 $36.26 $35.66 $0 $20 $40 $60 $80 $PSF National Average = $31.45 Source: Cushman & Wakefield Research Source: Cushman & Wakefield Research Source: Cushman & Wakefield Research These same markets accounted for 29.5 msf—or 54.8%—of net absorption during the year. Markets where the construction pipeline represents a significant share of existing inventory include San Mateo County CA (8.0%), Austin TX (7.8%), Nashville TN (7.6%), Seattle WA (6.8%) and Midtown Manhattan (6.0%). Tech markets tighten: Given these leasing and absorption data, it is not surprising that the markets with the lowest vacancy were also a “Who’s Who” of tech-driven regions. Among major markets, those with the lowest vacancy rate were Puget Sound-Eastside (Seattle) with a 6.2% vacancy rate, San Francisco (6.4%), Midtown South Manhattan (7.2%), Charlotte, NC (7.6%) and Raleigh/Durham, NC (7.7%). But the low vacancy environment was not limited to a few tech markets. In the fourth quarter of 2018, 29 markets registered vacancy rates below 10%—the highest number of sub-10% vacancy rate markets since the end of 2000. Rents rise, but the pace slows: The average asking rent for office space in the U.S. increased to a record $31.45 per square foot (psf) in the fourth quarter of 2018. While average asking rent was 2.2% higher than a year ago, it was the smallest year-over-year increase since 2014 when rents rose only 2.0%. Fifty markets recorded an increase in asking rents from the third to the fourth quarter of 2018, the smallest number of quarter-over-quarter increases since the first quarter of 2018. Among major markets, the largest year-over-year rent growth was in Orange County CA—average asking rents in that market rose 12.1%. The second-fastest growth was in Midtown South/Manhattan (+11.5%), followed by San Francisco/North Bay (+9.5%), Raleigh/Durham (+9.1%) and Portland OR (+7.7%). For a second consecutive quarter Midtown South/Manhattan boasted the highest average asking rent—a weighted average of $76.82 psf. Following was San Francisco at $75.57 psf, Midtown Manhattan ($75.03 psf), Downtown Manhattan ($63.57 psf) and San Mateo County CA ($60.82 psf).
  • 3. MarketBeat U.S. Office Q4 2018 cushmanwakefield.com | 3 Net Absorption Leasing Activity** Demand Indicators (Overall) Q4 2017 Q1 2018 Q2 2018 Q3 2018 Q4 2018p Q4 2018p United States 13,849,881 7,986,723 14,815,061 10,967,950 19,962,916 381,613,730 Northeast 3,370,397 265,018 4,924,632 3,175,502 5,089,338 91,829,836 Midwest 566,234 1,032,599 2,095,426 522,205 2,436,889 45,006,275 South 3,793,716 115,183 2,795,455 1,790,705 6,869,380 107,840,769 West 6,119,534 6,573,923 4,999,548 5,479,538 5,567,309 136,936,850 U.S. Office Market Reports Q4 2017 Q1 2018 Q2 2018 Q3 2018 Q4 2018p Q4 2018p Atlanta, GA 905,671 482,191 89,712 -261,207 755,561 12,092,543 Austin, TX -90,292 -86,161 -64,368 306,487 368,237 6,820,256 Baltimore, MD 63,522 -48,425 301,945 164,112 575,384 2,237,006 Binghamton, NY 29,482 8,358 7,353 8,955 32,272 62,083 Birmingham, AL -271,466 -387,710 -292,771 38,965 89,026 887,400 Boston, MA 1,714,728 789,664 941,612 406,307 648,484 14,835,950 Buffalo, NY 180,711 118,058 -36,832 85,402 67,165 825,652 Charleston, SC -31,793 83,627 382,982 -196,512 114,905 846,496 Charlotte, NC -277,551 120,129 -133,684 764,464 712,520 3,466,337 Chicago, IL -87,431 375,861 521,090 -527,647 485,721 19,088,075 Cincinnati, OH 6,132 -688,648 1,471 6,195 -27,870 1,632,570 Cleveland, OH -33,348 652,292 -132,832 370,957 489,376 1,478,727 Colorado Springs, CO 41,005 -7,799 33,513 213,379 25,815 1,101,348 Columbus, OH 121,938 74,995 356,075 -245,428 238,716 1,662,328 Dallas/Fort Worth, TX 651,472 463,512 758,161 -235,488 519,116 10,489,562 Dayton, OH 34,949 26,733 47,703 -4,415 13,368 478,495 Denver, CO 276,809 108,343 1,420,416 884,176 300,795 12,376,523 Detroit, MI -149,900 -23,504 297,216 522,848 401,123 3,593,693 El Paso, TX 206,180 174,753 171,857 117,053 317,200 331,756 Fairfield County, CT 158,904 -444,060 425,403 -626,483 -433,700 3,353,129 Fort Myers/Naples, FL 5,296 -88,290 -108,726 56,437 34,437 958,763 Fredericksburg, VA -41,100 -1,039 25,319 -66,929 12,514 256,657 Ft. Lauderdale, FL 192,477 83,852 -92,109 22,571 -52,844 2,337,029 Greenville, SC -29,702 63,980 -88,102 77,102 -43,267 553,766 Hampton Roads, VA 182,887 218,483 194,768 -458,431 57,116 1,112,329 Hartford, CT -22,471 66,356 -180,443 -32,143 113,825 1,515,472 Houston, TX -76,018 -1,595,091 -729,169 403,426 1,730,319 13,914,400 Indianapolis, IN 106,407 21,164 148,105 32,059 144,335 2,878,933 Inland Empire CA 63,707 20,591 111,838 59,723 52,156 1,233,329 Jacksonville, FL -177,795 26,678 43,424 170,171 -145,545 1,484,634 Kansas City, MO 12,877 391,484 291,917 136,082 -18,375 5,042,654 Las Vegas, NV 753,700 531,433 194,925 -320,868 167,055 2,646,384 Long Island, NY 635,282 -155,834 348,898 432,891 -99,580 1,287,723 Los Angeles CBD 125,536 100,825 259,229 158,952 361,710 2,216,429 Los Angeles Metro 324,649 41,751 588,956 561,367 926,389 14,452,526 Louisville, KY 56,968 -12,944 41,464 242,750 41,622 905,348 Memphis, TN 45,706 115,130 21,427 215,645 100,214 883,564 Miami, FL 149,150 517,999 272,523 -84,811 92,445 3,071,809 Milwaukee, WI 6,799 209,598 111,563 18,087 13,851 1,186,070 Minneapolis/St. Paul, MN 372,274 -163,970 437,958 -30,768 296,227 3,635,117 Demand Indicators
  • 4. MarketBeat U.S. Office Q4 2018 cushmanwakefield.com | 4 Net Absorption Leasing Activity** Demand Indicators (Overall) Q4 2017 Q1 2018 Q2 2018 Q3 2018 Q4 2018p Q4 2018p Nashville, TN -31,019 -72,654 158,854 75,668 71,024 2,324,658 New Haven, CT -420,840 -28,419 -11,991 96,508 -110,000 419,181 New Jersey - Central -200,094 -452,358 476,621 -154,026 537,844 4,991,706 New Jersey - Northern -679,405 -581,449 -57,951 561,162 370,423 6,623,405 New Orleans, LA -153,754 -69,504 51,339 -90,201 18,875 357,024 New York - Brooklyn 452,500 233,807 -145,636 -505,871 108,773 1,152,217 New York - Downtown 161,963 84,629 876,759 -452,177 606,368 6,206,240 New York - Midtown 1,497,959 1,316,820 1,332,041 2,382,020 2,290,165 28,301,624 New York – Midtown South 551,254 272,498 858,204 219,171 616,356 7,582,878 Northern VA 1,011,923 359,647 328,468 110,109 404,533 11,472,870 Oakland/East Bay, CA* 418,281 -422,906 -175,361 419,804 224,951 9,103,788 Omaha, NE -106,784 97,553 94,072 69,799 327,021 1,131,751 Orange County, CA 176,349 46,496 200,568 -81,668 131,191 8,164,796 Orlando, FL 165,766 -101,696 303,625 189,122 -168,210 2,713,749 Palm Beach, FL 74,486 17,790 -137,318 353 79,692 1,560,715 Philadelphia, PA -726,020 -105,205 -319,417 271,168 1,009,196 7,590,878 Phoenix, AZ 383,458 865,326 786,100 493,857 639,948 8,117,957 Pittsburgh, PA -72,103 -448,378 139,838 142,285 -85,436 2,915,365 Portland, OR 228,906 -167,524 294,961 -80,102 -65,276 2,325,479 Providence, RI 40,000 7,000 20,000 20,000 25,000 1,093,500 Puget Sound - Eastside 13,064 536,624 -80,388 347,223 247,205 5,314,113 Raleigh/Durham, NC 480,412 189,060 362,984 33,222 169,029 1,801,768 Richmond, VA 262,192 -277,478 230,435 131,145 6,193 2,262,230 Roanoke, VA 5,235 -85,873 -60,413 990 117,743 375,362 Rochester, NY 147,176 -307,934 180,621 142,101 -91,663 375,108 Sacramento, CA 428,813 273,859 142,513 167,273 -51,127 5,115,744 Salt Lake City, UT 543,049 50,079 287,769 76,732 869,962 2,432,492 San Antonio, TX -128,901 -162,460 -36,626 -7,640 146,943 1,233,552 San Diego, CA 393,547 349,859 212,717 -235,062 -49,525 6,074,794 San Francisco North Bay, CA 106,126 -51,112 62,728 -46,843 115,114 1,120,851 San Francisco, CA 253,149 2,201,032 1,392,816 1,028,671 216,148 10,470,028 San Juan, PR n/a n/a n/a n/a n/a n/a San Mateo County, CA -51,390 76,484 -293,965 737,191 16,742 8,481,786 San Jose (Silicon Valley), CA* -95,694 605,427 -760,178 852,071 1,068,450 29,641,560 Savannah, GA 38,194 n/a 98,334 n/a -36,340 65,000 Seattle, WA 1,618,836 1,357,121 232,029 201,498 411,728 6,000,285 Southern New Hampshire 14,847 -63,798 2,340 56,833 3,879 589,870 St. Louis, MO 282,321 59,041 -78,912 174,436 73,396 3,197,862 St. Petersburg/Clearwater, FL 67,506 61,279 163,941 -62,901 43,523 805,889 Suburban MD 90,173 -101,457 456,704 -6,225 54,697 3,640,642 Syracuse, NY 17,895 -983 167,651 17,747 -57,597 784,553 Tampa, FL 214,245 70,402 153,413 -20,049 -67,575 4,361,569 Tucson, AZ 117,634 58,014 88,362 42,164 -42,122 546,638 Tulsa, OK n/a -107,618 -197,655 171,636 296,457 841,453 Washington, DC 233,646 265,071 124,717 -10,329 453,836 11,374,633 Westchester County, NY -111,371 -43,754 -100,439 103,652 -462,436 1,323,302 Demand Indicators p = preliminary *Includes R&D **Leasing activity includes renewals
  • 5. MarketBeat U.S. Office Q4 2018 cushmanwakefield.com | 5 Vacancy Rates Overall Direct Vacancy Rate (All Classes) Q4 2017 Q1 2018 Q2 2018 Q3 2018 Q4 2018p Q4 2018p United States 13.1% 13.2% 13.4% 13.4% 13.2% 12.0% Northeast 12.2% 12.5% 12.6% 12.6% 12.6% 11.1% Midwest 14.5% 14.3% 14.5% 14.6% 14.3% 13.5% South 14.0% 14.4% 14.6% 14.6% 14.5% 13.4% West 12.0% 11.9% 11.8% 11.7% 11.4% 10.1% U.S. Office Report Markets Q4 2017 Q1 2018 Q2 2018 Q3 2018 Q4 2018p Q4 2018p Atlanta, GA 16.5% 16.2% 16.2% 16.4% 16.2% 15.2% Austin, TX 10.4% 10.5% 11.2% 11.4% 10.6% 8.4% Baltimore, MD 12.7% 13.2% 13.1% 13.6% 13.4% 12.8% Binghamton, NY 9.0% 8.9% 8.6% 8.6% 7.9% 7.9% Birmingham, AL 12.9% 15.9% 17.1% 16.9% 16.5% 13.9% Boston, MA 10.1% 10.0% 9.7% 9.5% 9.7% 8.5% Buffalo, NY 17.3% 17.3% 17.4% 17.0% 16.8% 16.0% Charleston, SC 6.3% 5.6% 5.7% 6.2% 6.2% 5.9% Charlotte, NC 8.0% 8.1% 8.2% 7.5% 7.6% 7.2% Chicago, IL 16.8% 17.2% 18.4% 18.8% 18.3% 16.7% Cincinnati, OH 21.1% 21.6% 20.1% 19.9% 20.2% 19.3% Cleveland, OH 9.6% 8.5% 8.6% 8.6% 8.2% 8.0% Colorado Springs, CO 18.1% 10.4% 10.1% 9.7% 9.7% 9.3% Columbus, OH 14.3% 13.7% 14.0% 14.9% 14.5% 13.1% Dallas/Fort Worth, TX 16.7% 17.7% 18.5% 18.8% 18.5% 17.2% Dayton, OH 21.9% 22.6% 22.1% 22.3% 22.0% 21.9% Denver, CO 15.6% 16.3% 16.1% 15.7% 15.2% 13.9% Detroit, MI 13.6% 13.5% 12.6% 12.4% 11.9% 11.7% El Paso, TX 6.3% 7.2% 7.2% 7.2% 7.3% 7.1% Fairfield County, CT 23.1% 24.2% 24.5% 24.6% 25.3% 22.1% Fort Myers/Naples, FL 6.2% 5.8% 6.4% 5.6% 6.0% 5.8% Fredericksburg, VA 12.4% 12.1% 11.6% 11.8% 11.6% 11.1% Ft. Lauderdale, FL 11.6% 12.0% 11.7% 12.2% 12.8% 12.0% Greenville, SC 7.8% 8.2% 9.3% 10.6% 8.1% 7.6% Hampton Roads, VA 9.8% 9.6% 8.9% 9.6% 8.9% 8.8% Hartford, CT 16.1% 16.4% 17.2% 17.3% 16.7% 14.9% Houston, TX 20.2% 22.0% 22.4% 22.3% 21.7% 19.2% Indianapolis, IN 14.3% 14.3% 17.2% 16.9% 15.9% 15.4% Inland Empire CA 8.8% 8.7% 8.0% 7.8% 7.5% 7.3% Jacksonville, FL 13.5% 13.0% 12.8% 12.6% 12.9% 12.3% Kansas City, MO 16.3% 15.5% 14.4% 14.4% 14.4% 13.5% Las Vegas, NV 12.3% 11.9% 11.9% 12.4% 12.4% 11.7% Long Island, NY 12.3% 12.7% 11.7% 10.5% 10.7% 8.5% Los Angeles CBD 21.2% 21.2% 20.3% 20.2% 18.6% 17.9% Los Angeles Metro 14.1% 14.5% 14.6% 14.4% 13.9% 12.9% Louisville, KY 13.2% 13.5% 13.5% 12.2% 12.6% 11.9% Memphis, TN 20.0% 14.2% 14.4% 13.6% 13.5% 13.1% Miami, FL 12.1% 12.1% 12.4% 12.9% 13.8% 13.0% Milwaukee, WI 16.8% 16.2% 15.3% 15.0% 15.0% 14.6% Minneapolis/St. Paul, MN 17.4% 17.6% 17.1% 17.5% 17.6% 16.8%
  • 6. MarketBeat U.S. Office Q4 2018 cushmanwakefield.com | 6 Vacancy Rates Overall Direct Vacancy Rate (All Classes) Q4 2017 Q1 2018 Q2 2018 Q3 2018 Q4 2018p Q4 2018p Nashville, TN 8.5% 8.5% 8.6% 9.8% 9.7% 9.1% New Haven, CT 14.6% 13.7% 13.4% 13.0% 13.1% 12.3% New Jersey - Central 16.5% 17.2% 16.5% 16.7% 16.0% 13.8% New Jersey - Northern 18.4% 19.7% 19.8% 19.2% 18.8% 17.2% New Orleans, LA 8.8% 9.5% 9.3% 9.3% 9.6% 9.5% New York - Brooklyn 10.5% 10.5% 11.1% 13.2% 15.2% 13.5% New York - Downtown 8.7% 9.0% 11.3% 12.0% 10.8% 9.4% New York - Midtown 9.5% 9.3% 9.2% 9.2% 9.3% 7.5% New York – Midtown South 6.9% 6.5% 6.7% 7.4% 7.2% 5.6% Northern VA 21.6% 21.1% 20.5% 20.6% 20.3% 19.2% Oakland/East Bay, CA* 10.6% 11.0% 11.4% 11.2% 11.0% 9.3% Omaha, NE 7.7% 6.8% 6.6% 6.8% 6.6% 6.2% Orange County, CA 11.1% 11.6% 11.3% 11.8% 11.5% 11.0% Orlando, FL 9.3% 9.5% 9.3% 8.6% 8.9% 8.7% Palm Beach, FL 12.9% 14.5% 13.7% 14.0% 13.7% 13.0% Philadelphia, PA 11.4% 12.0% 12.6% 12.5% 12.5% 11.9% Phoenix, AZ 17.4% 16.8% 16.1% 15.6% 15.6% 14.5% Pittsburgh, PA 10.4% 10.7% 11.0% 11.1% 10.8% 9.8% Portland, OR 10.3% 10.5% 10.5% 11.4% 11.8% 11.2% Providence, RI 12.0% 12.1% 12.0% 11.6% 11.4% 11.2% Puget Sound - Eastside 8.4% 8.1% 8.1% 7.0% 6.2% 5.1% Raleigh/Durham, NC 8.1% 8.1% 7.6% 7.4% 7.7% 7.2% Richmond, VA 7.1% 6.7% 6.7% 6.6% 6.8% 6.4% Roanoke, VA 6.2% 6.8% 6.8% 6.8% 6.1% 6.1% Rochester, NY 13.3% 15.4% 14.2% 13.2% 13.8% 13.8% Sacramento, CA 9.6% 9.6% 9.6% 9.5% 9.2% 9.1% Salt Lake City, UT 13.9% 14.0% 13.3% 13.5% 12.4% 10.9% San Antonio, TX 13.9% 13.9% 13.5% 13.2% 13.0% 12.6% San Diego, CA 13.3% 12.9% 12.6% 13.4% 13.8% 11.4% San Francisco North Bay, CA 8.4% 8.7% 8.4% 8.6% 8.0% 6.8% San Francisco, CA 8.6% 7.6% 7.4% 6.8% 6.4% 5.0% San Juan, PR 11.2% 11.6% 12.8% 12.9% 12.6% 12.6% San Mateo County, CA 8.5% 8.1% 8.8% 8.5% 9.0% 6.9% San Jose (Silicon Valley), CA* 11.0% 10.6% 10.7% 10.5% 9.9% 7.6% Savannah, GA 15.8% 15.8% 12.9% 12.9% 14.0% 14.0% Seattle, WA 7.3% 8.1% 8.7% 8.4% 8.0% 7.1% Southern New Hampshire 9.9% 9.9% 10.3% 10.1% 9.6% 8.8% St. Louis, MO 11.7% 11.4% 12.3% 12.0% 11.8% 11.2% St. Petersburg/Clearwater, FL 13.1% 12.6% 11.7% 12.7% 11.9% 11.7% Suburban MD 19.4% 19.4% 19.0% 18.7% 18.4% 17.5% Syracuse, NY 14.2% 14.0% 12.4% 12.3% 12.7% 11.6% Tampa, FL 11.7% 11.3% 10.9% 10.9% 11.9% 10.9% Tucson, AZ 9.0% 8.9% 8.1% 8.1% 8.4% 8.2% Tulsa, OK 22.0% 22.2% 23.2% 24.1% 23.2% 21.4% Washington, DC 12.4% 12.4% 14.0% 14.1% 14.1% 13.1% Westchester County, NY 19.6% 24.6% 25.7% 25.1% 26.5% 24.5% p = preliminary *Includes R&D.
  • 7. MarketBeat U.S. Office Q4 2018 cushmanwakefield.com | 7 Asking Rents Overall (All Classes) Class A Weighted Average Asking Rent Q4 2017 Q1 2018 Q2 2018 Q3 2018 Q4 2018p Q4 2018p United States $30.78 $30.72 $31.03 $31.29 $31.45 $37.56 Northeast $38.37 $37.65 $38.41 $38.89 $38.92 $45.26 Midwest $23.23 $23.46 $23.60 $23.62 $23.82 $27.42 South $27.92 $28.16 $28.32 $28.52 $28.50 $38.05 West $33.61 $33.33 $33.67 $34.11 $34.53 $41.70 U.S. Office Report Markets Q4 2017 Q1 2018 Q2 2018 Q3 2018 Q4 2018p Q4 2018p Atlanta, GA $24.78 $25.79 $26.53 $26.74 $26.64 $30.31 Austin, TX $36.13 $36.39 $36.54 $35.81 $36.26 $41.09 Baltimore, MD $23.37 $23.14 $23.41 $23.52 $23.45 $26.63 Binghamton, NY $12.84 $12.84 $12.84 $12.93 $13.20 $13.20 Birmingham, AL $19.31 $19.35 $18.94 $18.63 $18.57 $19.66 Boston, MA $37.08 $35.82 $36.05 $36.87 $36.97 $41.94 Buffalo, NY $17.70 $17.70 $17.70 $17.70 $17.70 $23.60 Charleston, SC $21.67 $22.11 $23.35 $25.50 $23.55 $26.52 Charlotte, NC $24.45 $25.18 $25.46 $26.14 $26.25 $30.16 Chicago, IL $30.48 $30.57 $30.24 $29.94 $30.23 $33.66 Cincinnati, OH $18.53 $18.66 $19.09 $18.95 $19.00 $21.59 Cleveland, OH $17.35 $17.25 $17.50 $17.31 $17.66 $21.96 Colorado Springs, CO $13.92 $15.51 $15.52 $15.73 $16.72 $20.04 Columbus, OH $20.74 $20.77 $20.94 $20.96 $20.92 $23.02 Dallas/Fort Worth, TX $26.49 $27.31 $26.43 $26.47 $26.39 $29.76 Dayton, OH $15.04 $15.00 $14.98 $14.86 $14.90 $18.20 Denver, CO $26.86 $27.41 $27.50 $27.72 $28.21 $31.89 Detroit, MI $19.42 $19.52 $19.61 $19.59 $19.65 $22.18 El Paso, TX $16.26 $16.25 $16.50 $16.50 $16.50 $17.00 Fairfield County, CT $33.00 $32.55 $32.47 $32.21 $32.47 $37.70 Fort Myers/Naples, FL $15.63 $14.97 $14.85 $15.09 $15.02 $18.03 Fredericksburg, VA $19.07 $20.12 $22.83 $22.46 $22.55 $24.88 Ft. Lauderdale, FL $29.24 $30.35 $30.48 $30.72 $30.18 $37.23 Greenville, SC $18.54 $19.39 $19.25 $19.11 $19.37 $23.53 Hampton Roads, VA $17.67 $17.75 $18.19 $18.82 $18.37 $21.54 Hartford, CT $20.72 $20.55 $20.59 $20.91 $20.99 $22.24 Houston, TX $29.80 $29.44 $29.04 $29.37 $29.25 $36.48 Indianapolis, IN $19.35 $19.53 $19.24 $19.60 $19.74 $22.07 Inland Empire CA $22.21 $22.36 $22.72 $22.91 $22.92 $27.44 Jacksonville, FL $19.02 $19.07 $19.00 $19.64 $19.50 $22.93 Kansas City, MO $19.85 $19.73 $20.20 $20.26 $20.69 $24.01 Las Vegas, NV $19.56 $19.80 $19.44 $19.92 $20.40 $28.44 Long Island, NY $29.75 $29.46 $29.96 $29.78 $29.22 $32.46 Los Angeles CBD $42.39 $42.23 $42.25 $42.35 $42.45 $43.36 Los Angeles Metro $38.74 $39.24 $39.31 $39.72 $39.59 $43.16 Louisville, KY $17.15 $16.96 $16.82 $16.40 $16.70 $20.23 Memphis, TN $18.13 $17.87 $17.82 $17.91 $18.10 $19.66 Miami, FL $38.16 $38.49 $38.03 $38.86 $38.69 $43.96 Milwaukee, WI $19.00 $19.00 $19.00 $20.13 $20.27 $23.81 Minneapolis/St. Paul, MN $25.38 $25.49 $25.32 $25.65 $25.48 $30.83
  • 8. MarketBeat U.S. Office Q4 2018 cushmanwakefield.com | 8 Asking Rents Overall (All Classes) Class A Weighted Average Asking Rent Q4 2017 Q1 2018 Q2 2018 Q3 2018 Q4 2018p Q4 2018p Nashville, TN $26.99 $26.45 $26.20 $26.78 $26.71 $29.74 New Haven, CT $21.42 $21.35 $21.37 $21.56 $21.72 $23.16 New Jersey - Central $25.75 $26.45 $26.58 $26.57 $26.71 $29.59 New Jersey - Northern $29.84 $30.13 $30.79 $30.84 $31.09 $35.95 New Orleans, LA $18.63 $18.57 $18.69 $18.86 $18.63 $19.65 New York - Brooklyn $41.31 $41.15 $42.56 $41.37 $43.24 $54.57 New York - Downtown $60.23 $59.67 $62.92 $63.72 $63.57 $67.88 New York - Midtown $76.94 $77.06 $77.44 $76.12 $75.03 $81.69 New York – Midtown South $68.87 $69.13 $71.07 $76.42 $76.82 $95.80 Northern VA $32.68 $32.63 $32.69 $32.79 $32.87 $35.46 Oakland/East Bay, CA* $31.06 $31.04 $31.99 $32.71 $33.39 $40.58 Omaha, NE $17.13 $20.15 $20.29 $20.76 $21.22 $27.38 Orange County, CA $31.82 $34.03 $34.36 $35.55 $35.66 $39.52 Orlando, FL $21.44 $21.57 $22.36 $22.46 $22.85 $26.48 Palm Beach, FL $37.15 $36.87 $36.79 $36.89 $37.04 $44.90 Philadelphia, PA $25.86 $25.64 $25.52 $26.07 $26.80 $28.89 Phoenix, AZ $25.11 $25.22 $25.28 $25.43 $25.83 $30.30 Pittsburgh, PA $19.76 $18.99 $19.20 $19.42 $19.92 $26.45 Portland, OR $27.35 $27.81 $27.99 $29.44 $29.45 $33.47 Providence, RI $18.58 $18.60 $18.62 $18.64 $18.65 $24.28 Puget Sound - Eastside $34.60 $34.65 $34.96 $35.78 $35.56 $40.31 Raleigh/Durham, NC $24.05 $24.35 $25.28 $25.60 $26.24 $28.36 Richmond, VA $18.89 $19.04 $18.94 $19.40 $19.14 $21.68 Roanoke, VA $15.97 $16.31 $15.50 $15.55 $15.51 $18.32 Rochester, NY $19.75 $18.00 $18.00 $18.00 $18.00 $20.66 Sacramento, CA $22.15 $22.16 $22.50 $22.84 $22.69 $28.19 Salt Lake City, UT $24.32 $24.18 $24.37 $24.66 $24.31 $30.52 San Antonio, TX $21.49 $22.05 $22.05 $22.43 $22.34 $25.93 San Diego, CA $35.52 $36.24 $36.24 $36.36 $36.96 $42.36 San Francisco North Bay, CA $29.71 $30.49 $31.32 $32.29 $32.53 $36.17 San Francisco, CA $71.02 $71.40 $72.30 $74.72 $75.57 $79.27 San Juan, PR $18.06 $19.92 $18.05 $18.11 $18.05 $19.99 San Mateo County, CA $57.15 $58.06 $58.69 $57.98 $60.82 $61.42 San Jose (Silicon Valley), CA* $38.32 $36.42 $36.71 $37.65 $39.23 $56.64 Savannah, GA $19.79 $19.79 $20.02 $20.02 $20.45 $24.23 Seattle, WA $35.34 $33.99 $34.40 $35.10 $34.68 $39.36 Southern New Hampshire $17.32 $17.09 $16.85 $16.96 $16.92 $17.88 St. Louis, MO $19.61 $18.75 $18.90 $19.11 $19.40 $22.46 St. Petersburg/Clearwater, FL $22.08 $22.00 $21.97 $22.97 $22.99 $25.95 Suburban MD $26.85 $26.92 $27.27 $27.85 $27.62 $30.78 Syracuse, NY $15.90 $15.82 $16.59 $16.93 $17.08 $18.87 Tampa, FL $24.88 $24.83 $25.39 $26.21 $26.07 $29.58 Tucson, AZ $18.93 $19.56 $18.85 $19.16 $19.16 $23.82 Tulsa, OK $13.43 $13.43 $15.27 $15.58 $15.26 $18.84 Washington, DC $55.00 $54.75 $55.01 $54.41 $54.34 $61.47 Westchester County, NY $29.06 $28.34 $27.85 $27.45 $27.59 $28.00 p = preliminary *Includes R&D
  • 9. MarketBeat U.S. Office Q4 2018 cushmanwakefield.com | 9 Inventory Inventory Deliveries 2018 Under Construction as of Q4 2018p United States 5,342,556,912 52,724,147 114,218,412 Northeast 1,232,832,742 10,527,689 24,188,657 Midwest 846,895,079 6,652,802 13,666,860 South 1,775,443,697 18,813,783 41,648,392 West 1,487,385,394 16,729,873 34,714,503 U.S. Office Report Markets Inventory Deliveries 2018 Under Construction as of Q4 2018p Atlanta, GA 142,829,213 1,744,777 3,487,709 Austin, TX 51,011,410 1,172,474 3,961,648 Baltimore, MD 76,842,023 962,566 1,013,858 Binghamton, NY 4,642,804 90,000 0 Birmingham, AL 19,841,737 242,000 138,000 Boston, MA 162,408,363 2,017,189 3,068,442 Buffalo, NY 22,183,301 0 185,000 Charleston, SC 25,523,105 893,520 711,134 Charlotte, NC 107,829,314 439,718 3,865,532 Chicago, IL 234,308,571 2,130,735 5,205,738 Cincinnati, OH 33,656,170 42,503 0 Cleveland, OH 150,313,936 1,237,524 671,733 Colorado Springs, CO 28,491,332 0 202,045 Columbus, OH 29,140,191 645,181 777,067 Dallas/Fort Worth, TX 234,573,006 3,574,141 3,240,813 Dayton, OH 13,752,128 39,000 136,634 Denver, CO 117,443,432 2,971,108 2,127,886 Detroit, MI 110,398,287 196,288 505,296 El Paso, TX 17,961,572 89,000 449,444 Fairfield County, CT 39,433,690 0 532,258 Fort Myers/Naples, FL 20,145,445 0 656,800 Fredericksburg, VA 9,473,538 10,059 0 Ft. Lauderdale, FL 27,671,960 205,984 707,557 Greenville, SC 26,784,146 0 143,057 Hampton Roads, VA 42,122,215 88,687 646,565 Hartford, CT 24,248,156 0 24,900 Houston, TX 185,418,562 852,395 2,162,557 Indianapolis, IN 37,187,007 202,775 639,470 Inland Empire CA 21,885,514 0 31,500 Jacksonville, FL 23,986,466 230,904 343,700 Kansas City, MO 50,209,170 274,440 515,603 Las Vegas, NV 60,786,360 606,080 456,878 Long Island, NY 34,672,781 0 48,000 Los Angeles CBD 27,574,918 0 0 Los Angeles Metro 173,104,709 629,788 2,385,668 Louisville, KY 20,319,201 198,237 260,000 Memphis, TN 30,339,948 55,000 120,000 Miami, FL 47,602,226 616,185 1,480,309 Milwaukee, WI 28,576,517 60,062 540,817 Minneapolis/St. Paul, MN 74,458,970 1,105,718 2,238,700 Nashville, TN 38,823,426 302,924 2,933,817 New Haven, CT 10,713,686 0 0 New Jersey - Central 82,408,311 97,500 0 Inventory
  • 10. MarketBeat U.S. Office Q4 2018 cushmanwakefield.com | 10 Inventory Inventory Deliveries 2018 Under Construction as of Q4 2018p New Jersey - Northern 108,828,105 130,000 1,000,000 New Orleans, LA 25,706,748 0 n/a New York - Brooklyn 29,785,483 1,183,588 1,582,378 New York - Downtown 89,729,615 2,602,472 233,372 New York - Midtown 242,463,708 1,489,770 14,502,081 New York – Midtown South 68,835,415 605,576 623,656 Northern VA 132,821,779 700,000 2,100,223 Oakland/East Bay, CA* 108,510,205 590,000 2,015,122 Omaha, NE 36,062,071 535,076 1,026,686 Orange County, CA 90,500,748 1,409,661 1,056,183 Orlando, FL 36,818,039 386,700 368,744 Palm Beach, FL 23,896,055 0 333,176 Philadelphia, PA 132,561,666 1,484,921 440,000 Phoenix, AZ 102,920,586 1,280,547 2,712,626 Pittsburgh, PA 90,781,763 301,673 1,578,042 Portland, OR 50,190,631 1,455,770 930,149 Providence, RI 19,651,000 490,000 210,000 Puget Sound - Eastside 34,838,767 0 718,257 Raleigh/Durham, NC 53,153,342 1,685,834 2,385,981 Richmond, VA 53,607,063 245,852 1,268,249 Roanoke, VA 16,642,616 0 0 Rochester, NY 14,069,668 0 45,000 Sacramento, CA 89,394,532 218,092 1,976,962 Salt Lake City, UT 37,679,091 756,223 707,974 San Antonio, TX 31,114,389 1,056,647 1,641,615 San Diego, CA 77,575,560 718,615 1,721,457 San Francisco North Bay, CA 20,943,152 0 17,091 San Francisco, CA 82,280,598 3,666,015 3,094,500 San Juan, PR 10,323,867 0 0 San Mateo County, CA 56,122,109 996,200 4,495,299 San Jose (Silicon Valley), CA* 216,782,745 965,949 5,303,090 Savannah, GA 3,423,381 10,000 67,892 Seattle, WA 63,903,550 275,590 4,313,900 Southern New Hampshire 14,599,575 30,000 65,000 St. Louis, MO 48,832,061 183,500 1,409,116 St. Petersburg/Clearwater, FL 11,987,903 0 0 Suburban MD 60,007,405 75,000 2,201,787 Syracuse, NY 16,115,718 5,000 50,528 Tampa, FL 31,181,259 150,000 580,051 Tucson, AZ 26,456,855 190,235 447,916 Tulsa, OK 25,060,607 0 264,000 Washington, DC 110,600,731 2,825,179 4,114,174 Westchester County, NY 24,699,934 0 0 Inventory p = preliminary *Includes R&D
  • 11. Methodology Cushman & Wakefield’s quarterly estimates are derived from a variety of data sources, including its own proprietary database, and historical data from third party data sources. The market statistics are calculated from a base building inventory made up of office properties deemed to be competitive in the local office markets. Generally, owner-occupied and federally-owned buildings are not included. Single tenant buildings and privately-owned buildings in which the federal government leases space are included. Older buildings unfit for occupancy or ones that require substantial renovation before tenancy are generally not included in the competitive inventory. The inventory is subject to revisions due to resampling. Vacant space is defined as space that is available immediately or imminently after the end of the quarter. Sublet space still occupied by the tenant is not counted as available space. The figures provided for the current quarter are preliminary, and all information contained in the report is subject to correction of errors and revisions based on additional data received. Regional Map West Midwest South Northeast Explanation of Terms Total Inventory: The total amount of office space (in buildings of a predetermined size by market) that can be rented by a third party. Overall Vacancy Rate: The amount of unoccupied space (new, relet, and sublet) expressed as a percentage of total inventory. Direct Vacancy Rate: The amount of unoccupied space available directly through the landlord, excludes sublease space. Absorption: The net change in occupied space between two points in time. (Total occupied space in the present quarter minus total occupied space from the previous quarter, quoted on a net, not gross, basis.) Leasing Activity: The sum of all leases over a period of time. This includes pre-leasing activity as well as expansions. It does not include renewals. Overall Weighted Asking Rents: Gross average asking rents weighted by the amount of available direct and sublease space in Class A, B and C properties. Class A Asking Rents: Gross average asking rents weighted by the amount of available Class A direct and sublease space. Ken McCarthy Principal Economist Americas Head of Applied Research Tel: +1 212.841.7500 cushmanwakefield.com About Cushman & Wakefield Cushman & Wakefield (NYSE: CWK) is a leading global real estate services firm that delivers exceptional value by putting ideas into action for real estate occupiers and owners. Cushman & Wakefield is among the largest real estate services firms with 48,000 employees in approximately 400 offices and 70 countries. In 2017, the firm had revenue of $6.9 billion across core services of property, facilities and project management, leasing, capital markets, valuation and other services. To learn more, visit www.cushmanwakefield.com or follow @CushWake on Twitter. ©2019 Cushman & Wakefield. All rights reserved. The information contained within this report is gathered from multiple sources believed to be reliable. The information may contain errors or omissions and is presented without any warranty or representations as to its accuracy. Revathi Greenwood Americas Head of Research Tel: +1 202.463.2100 cushmanwakefield.com