Download to read offline


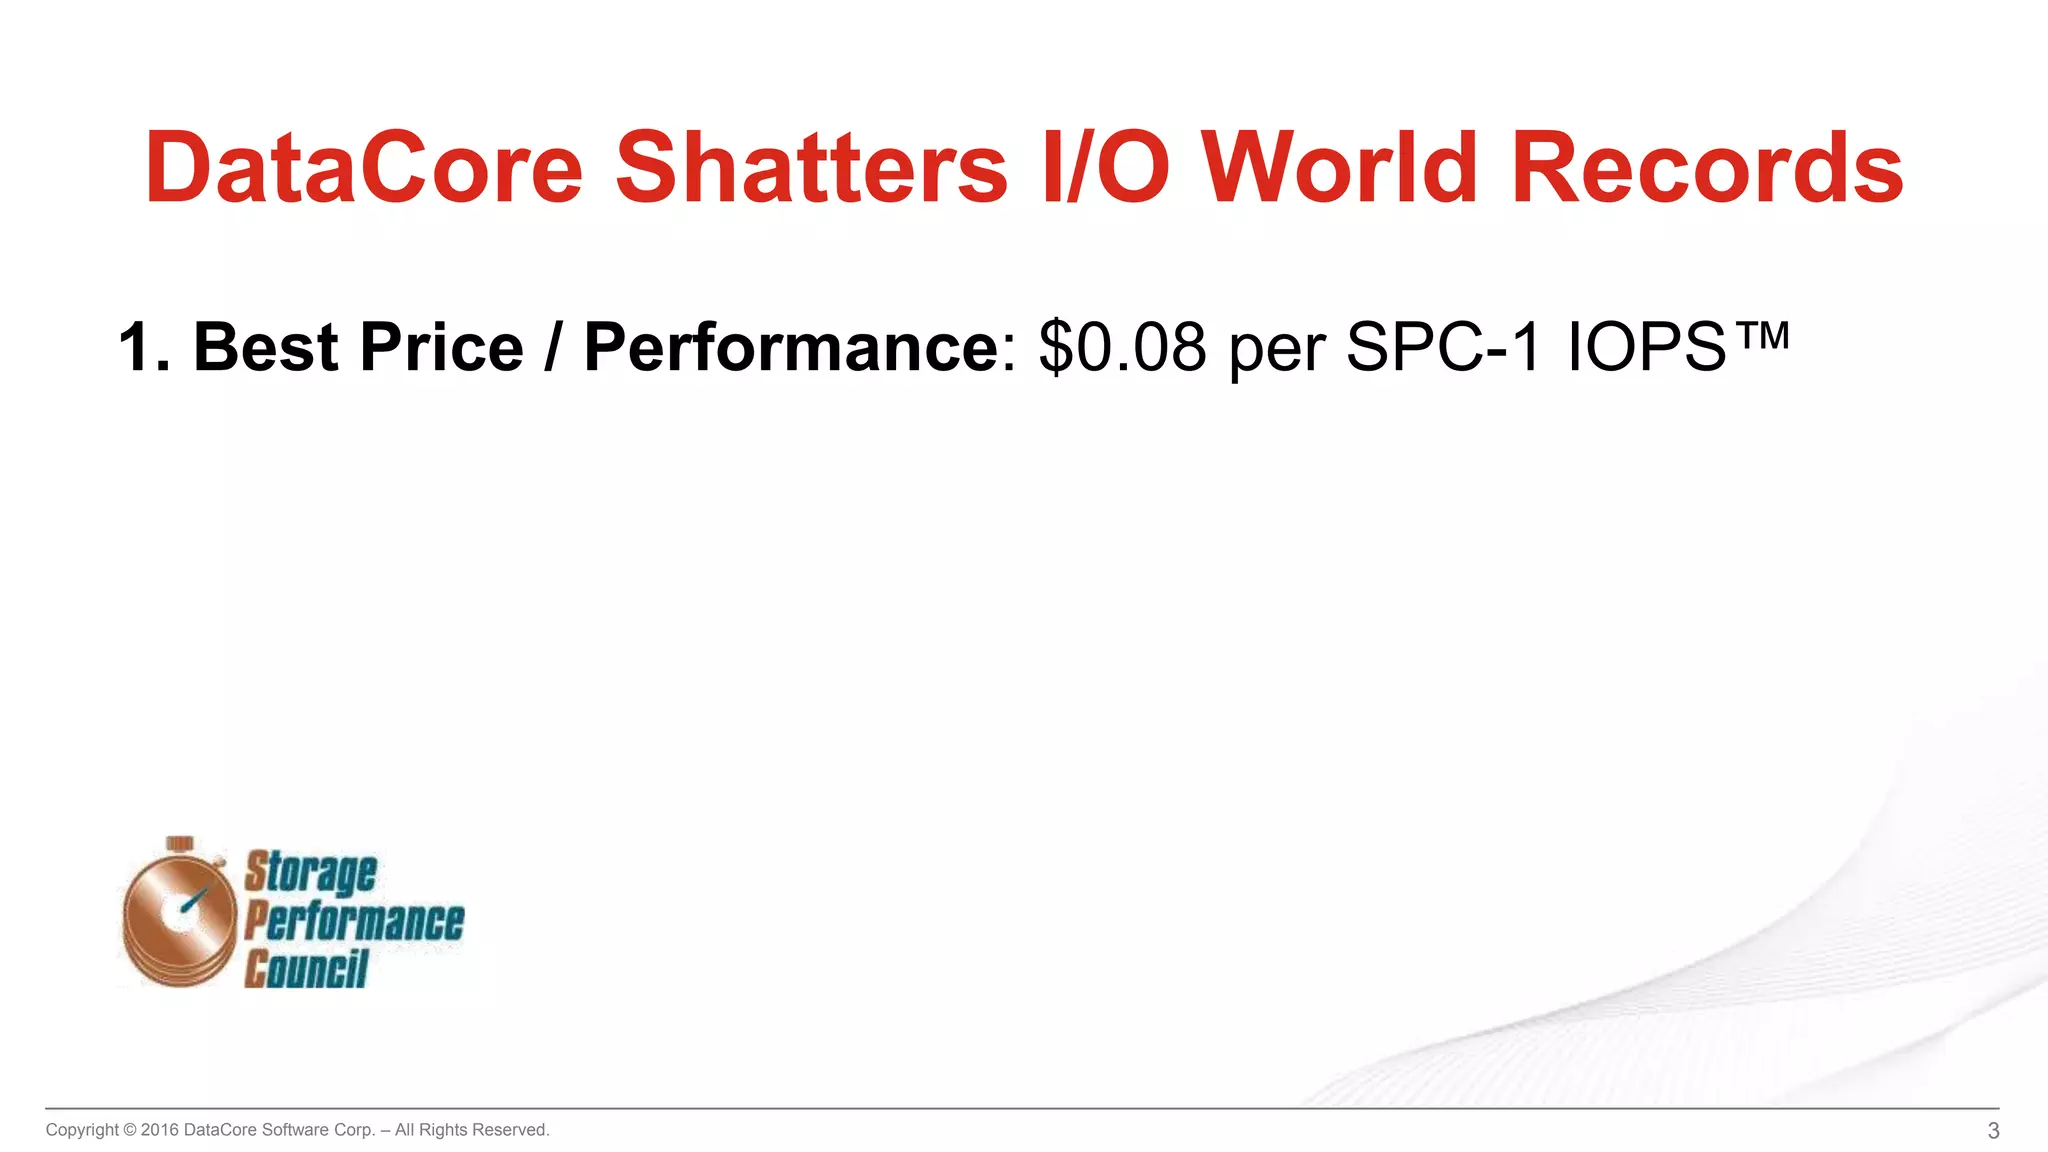
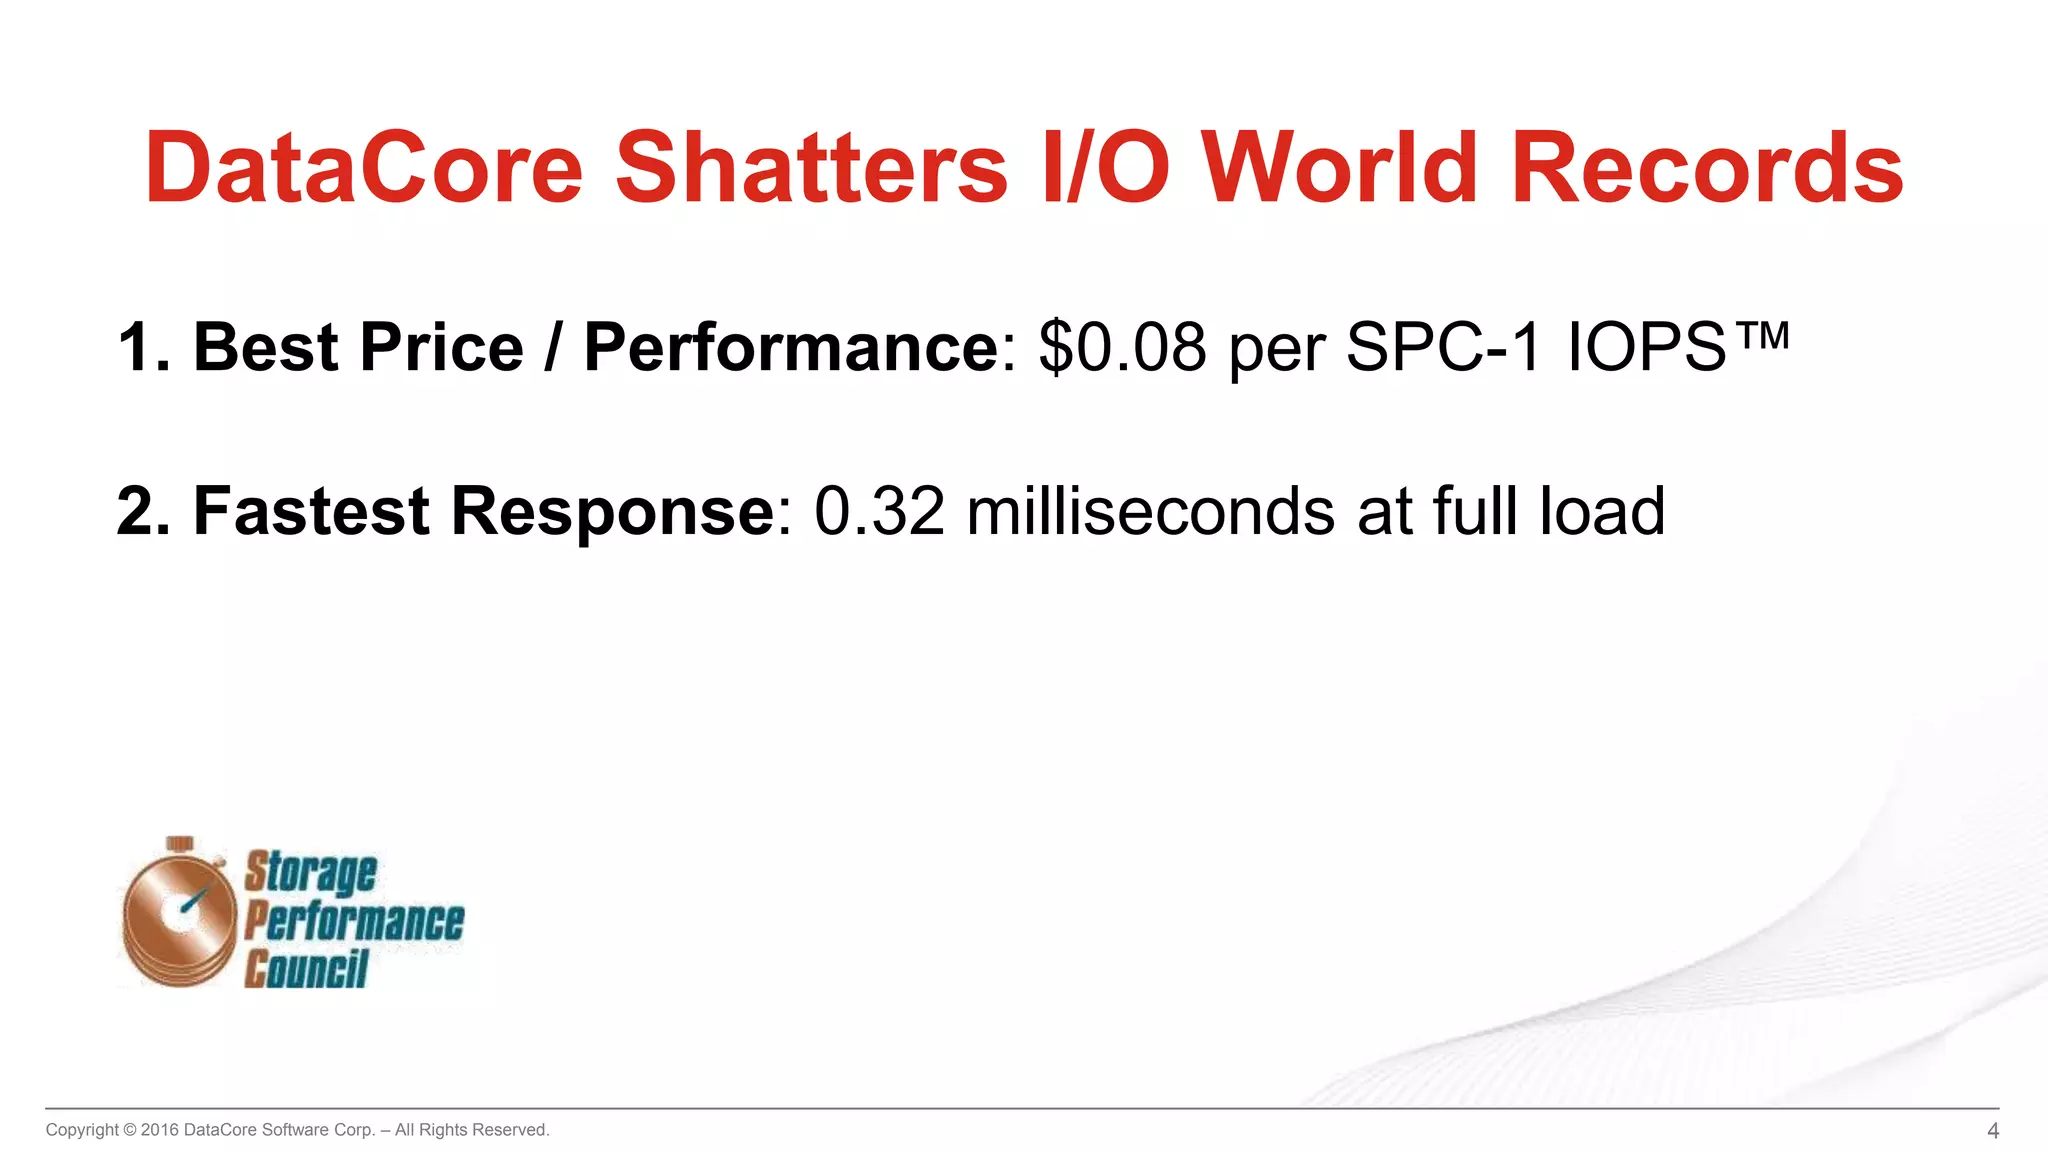
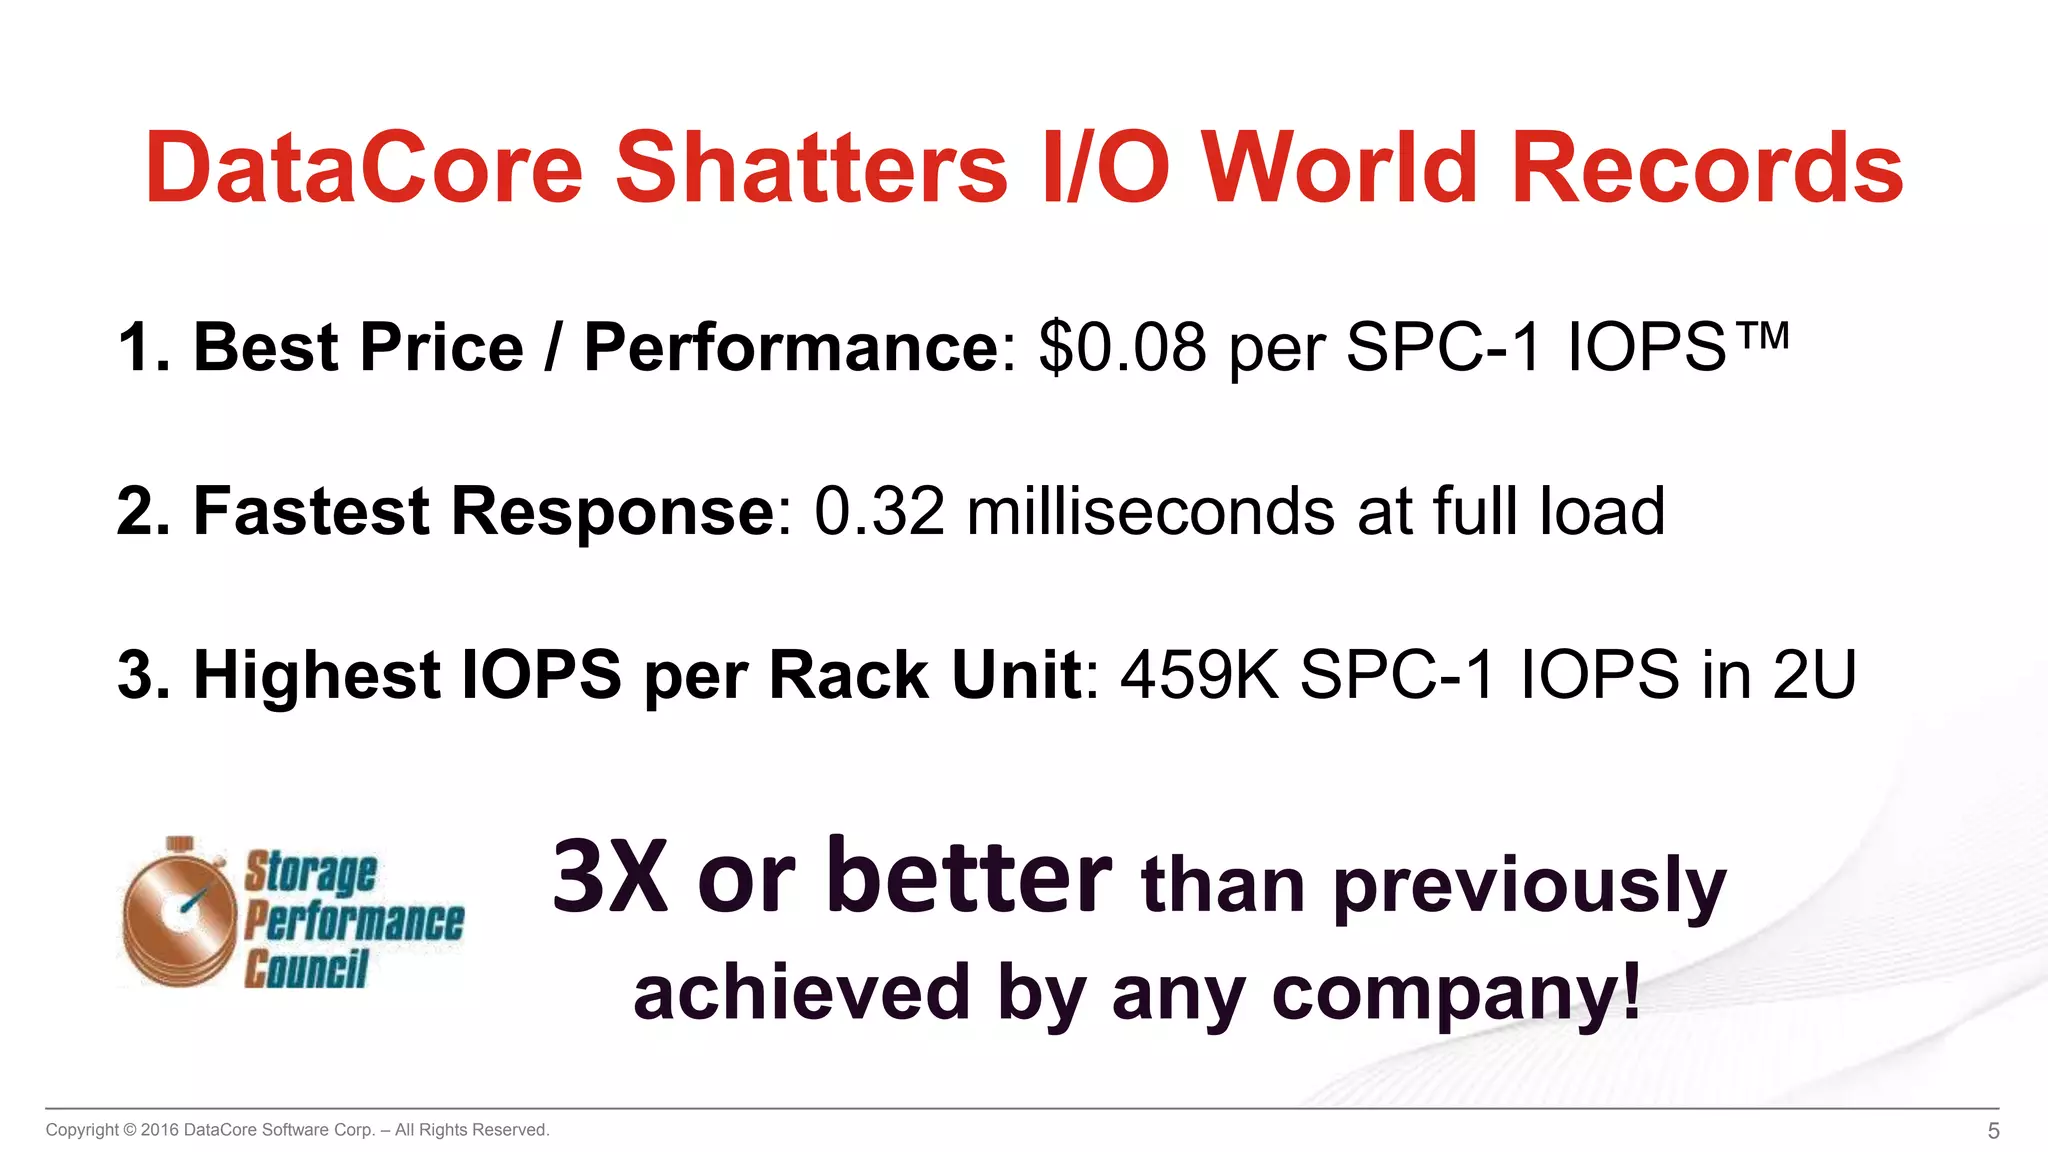
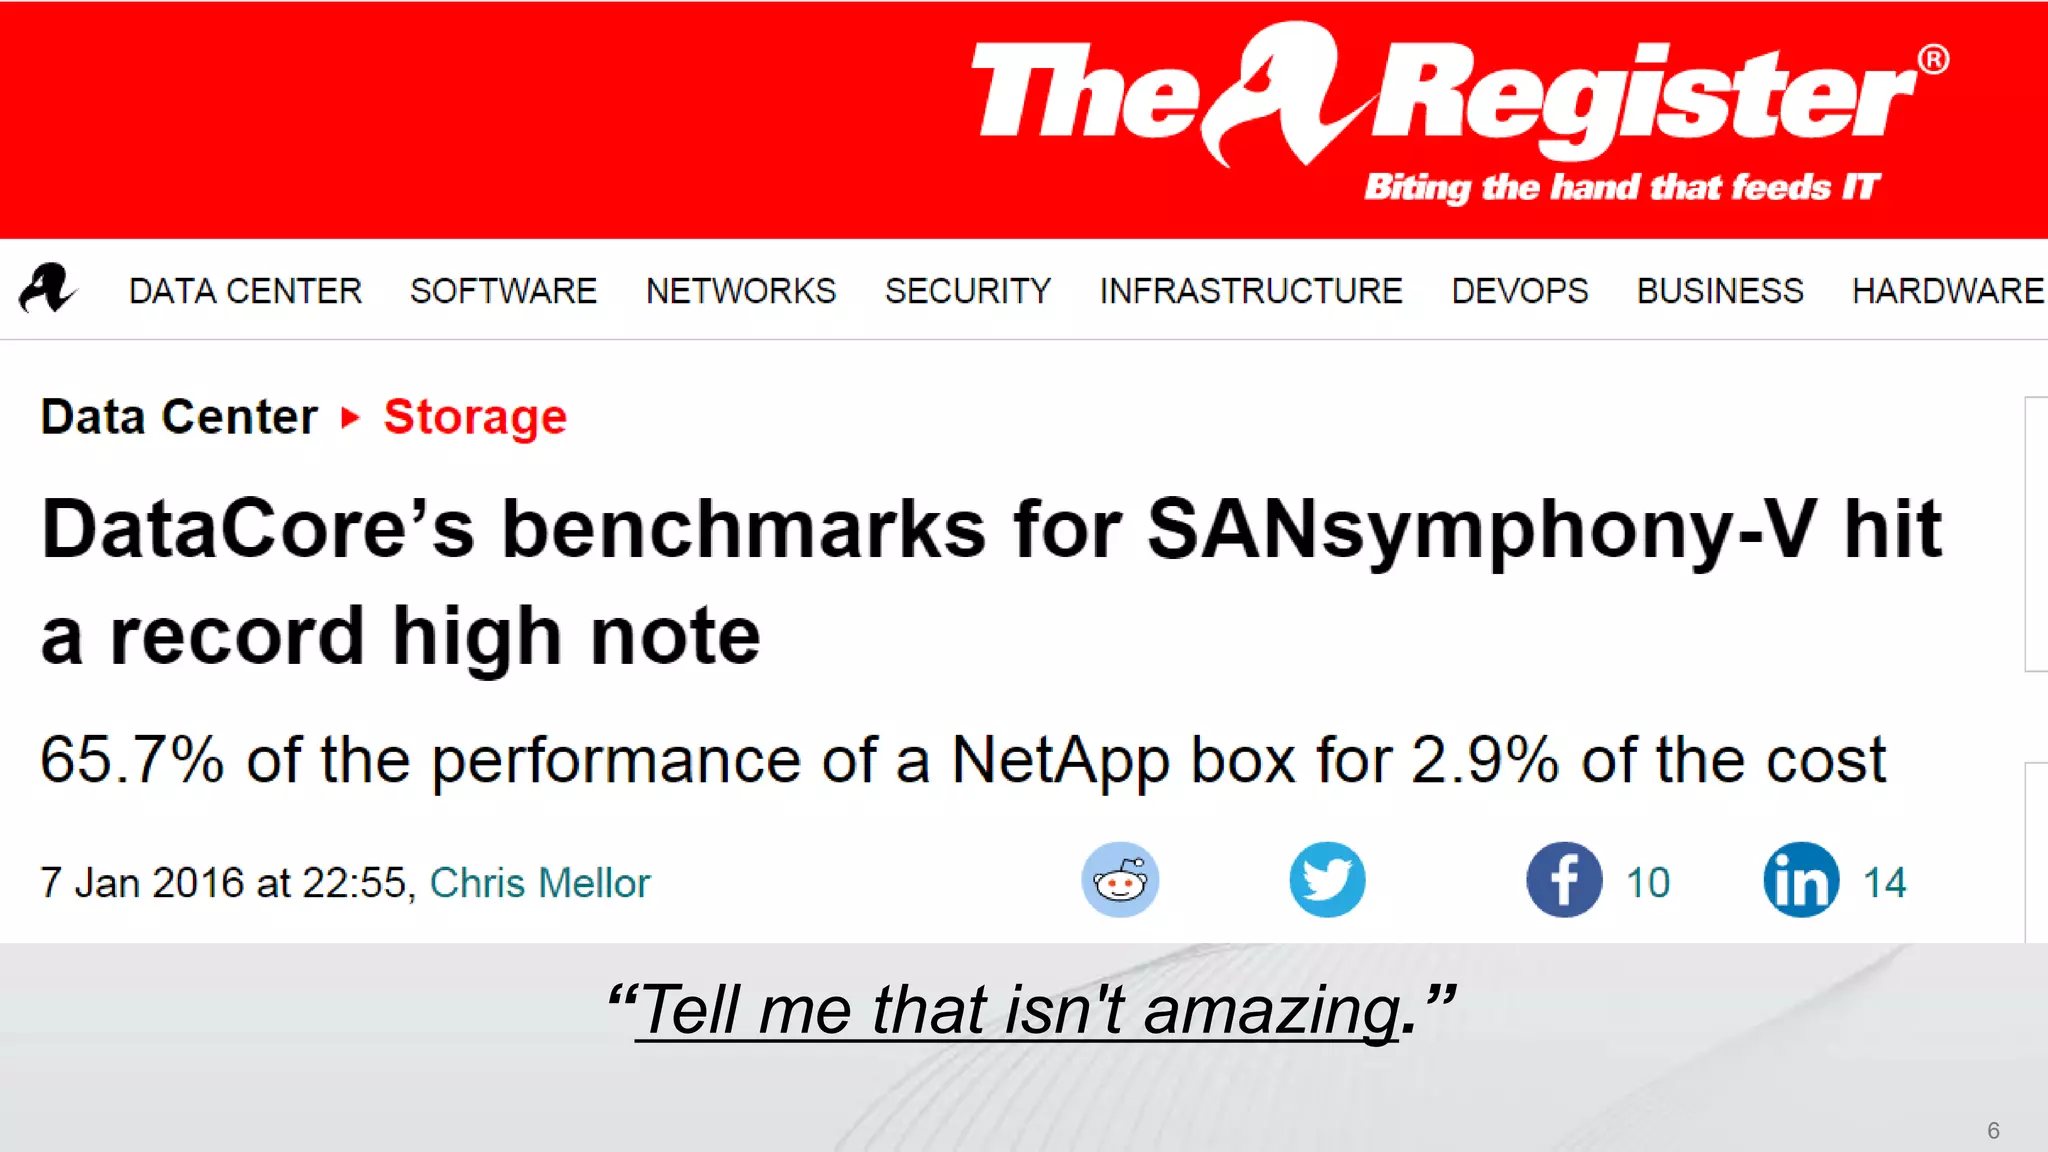
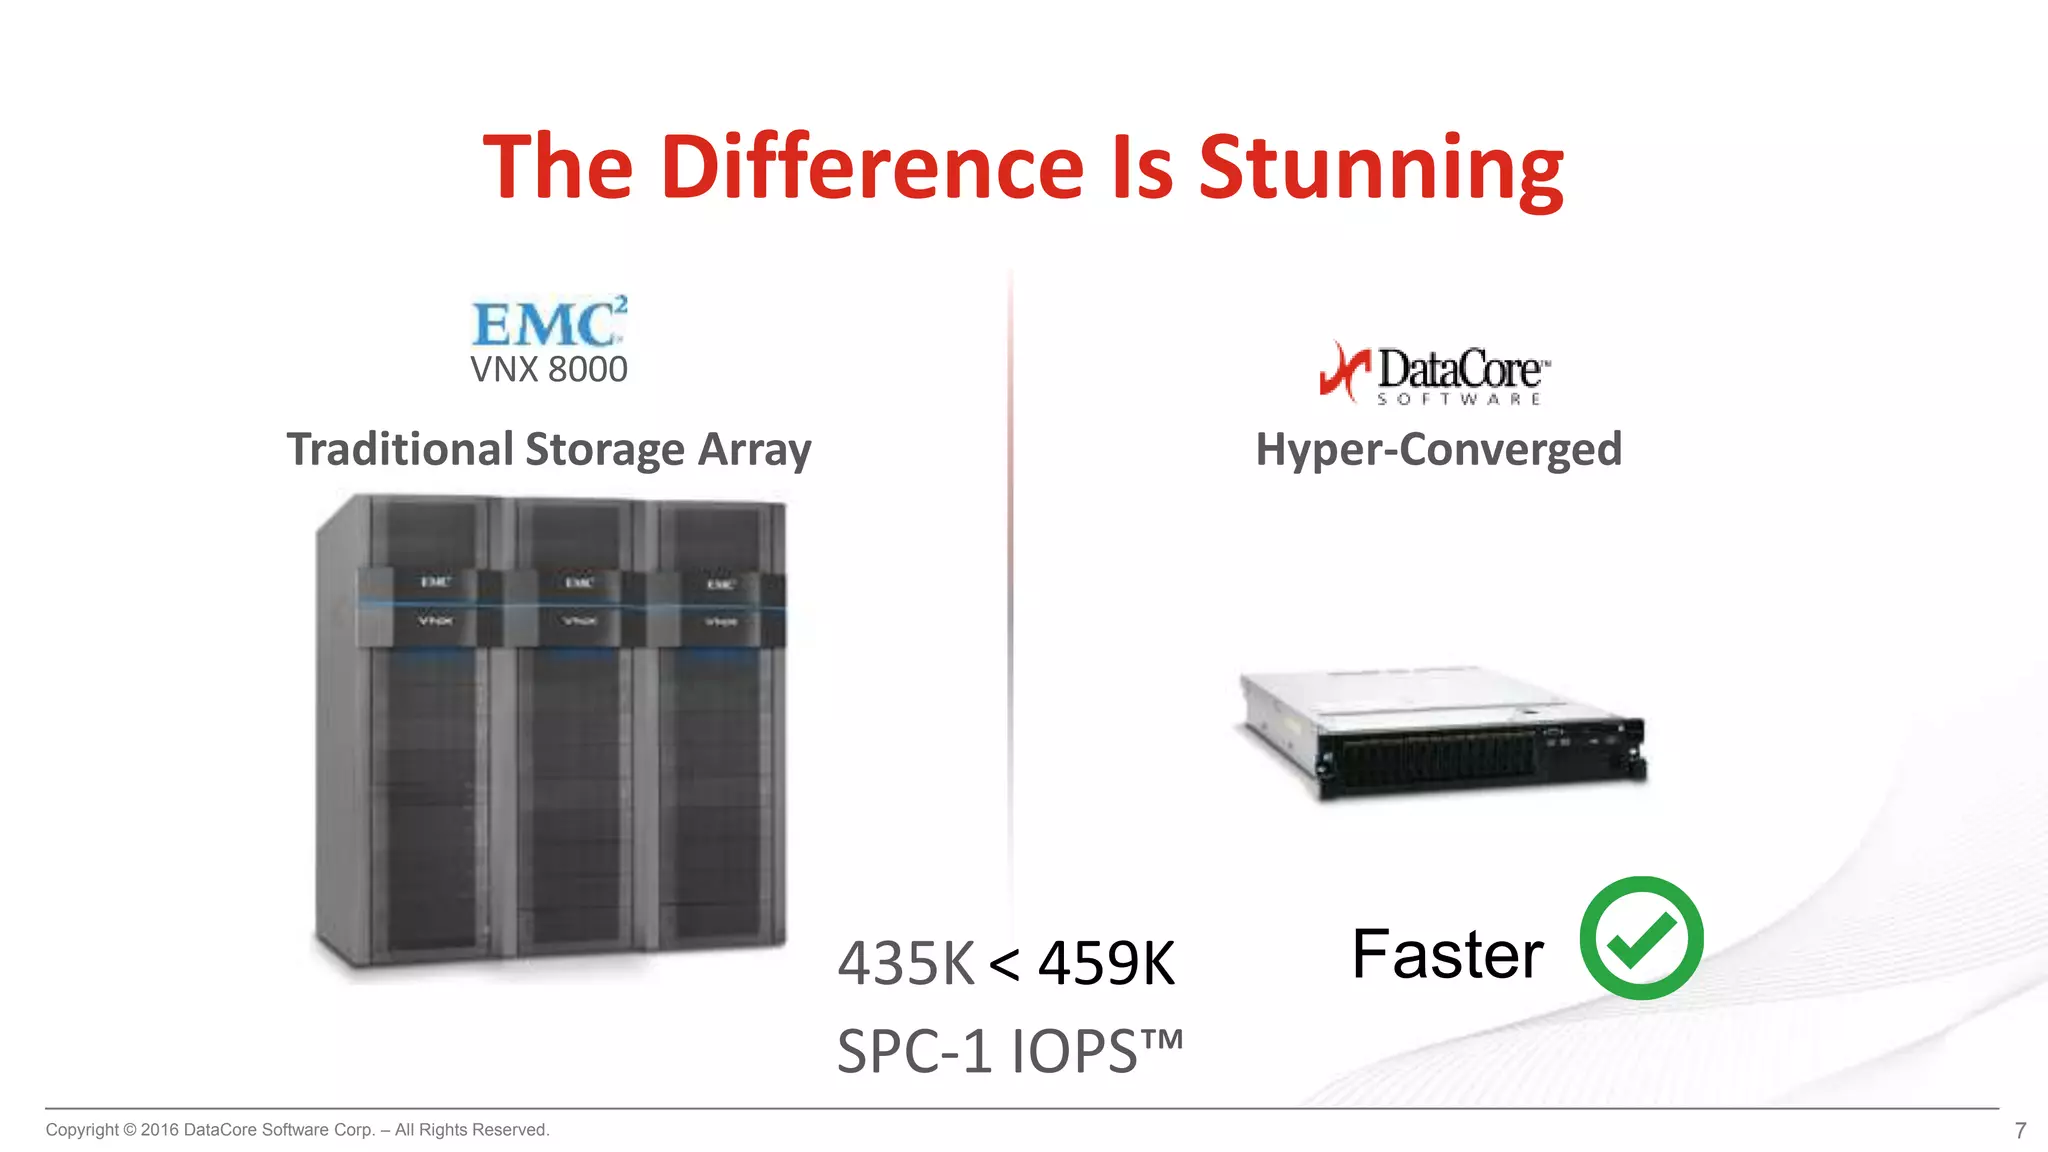
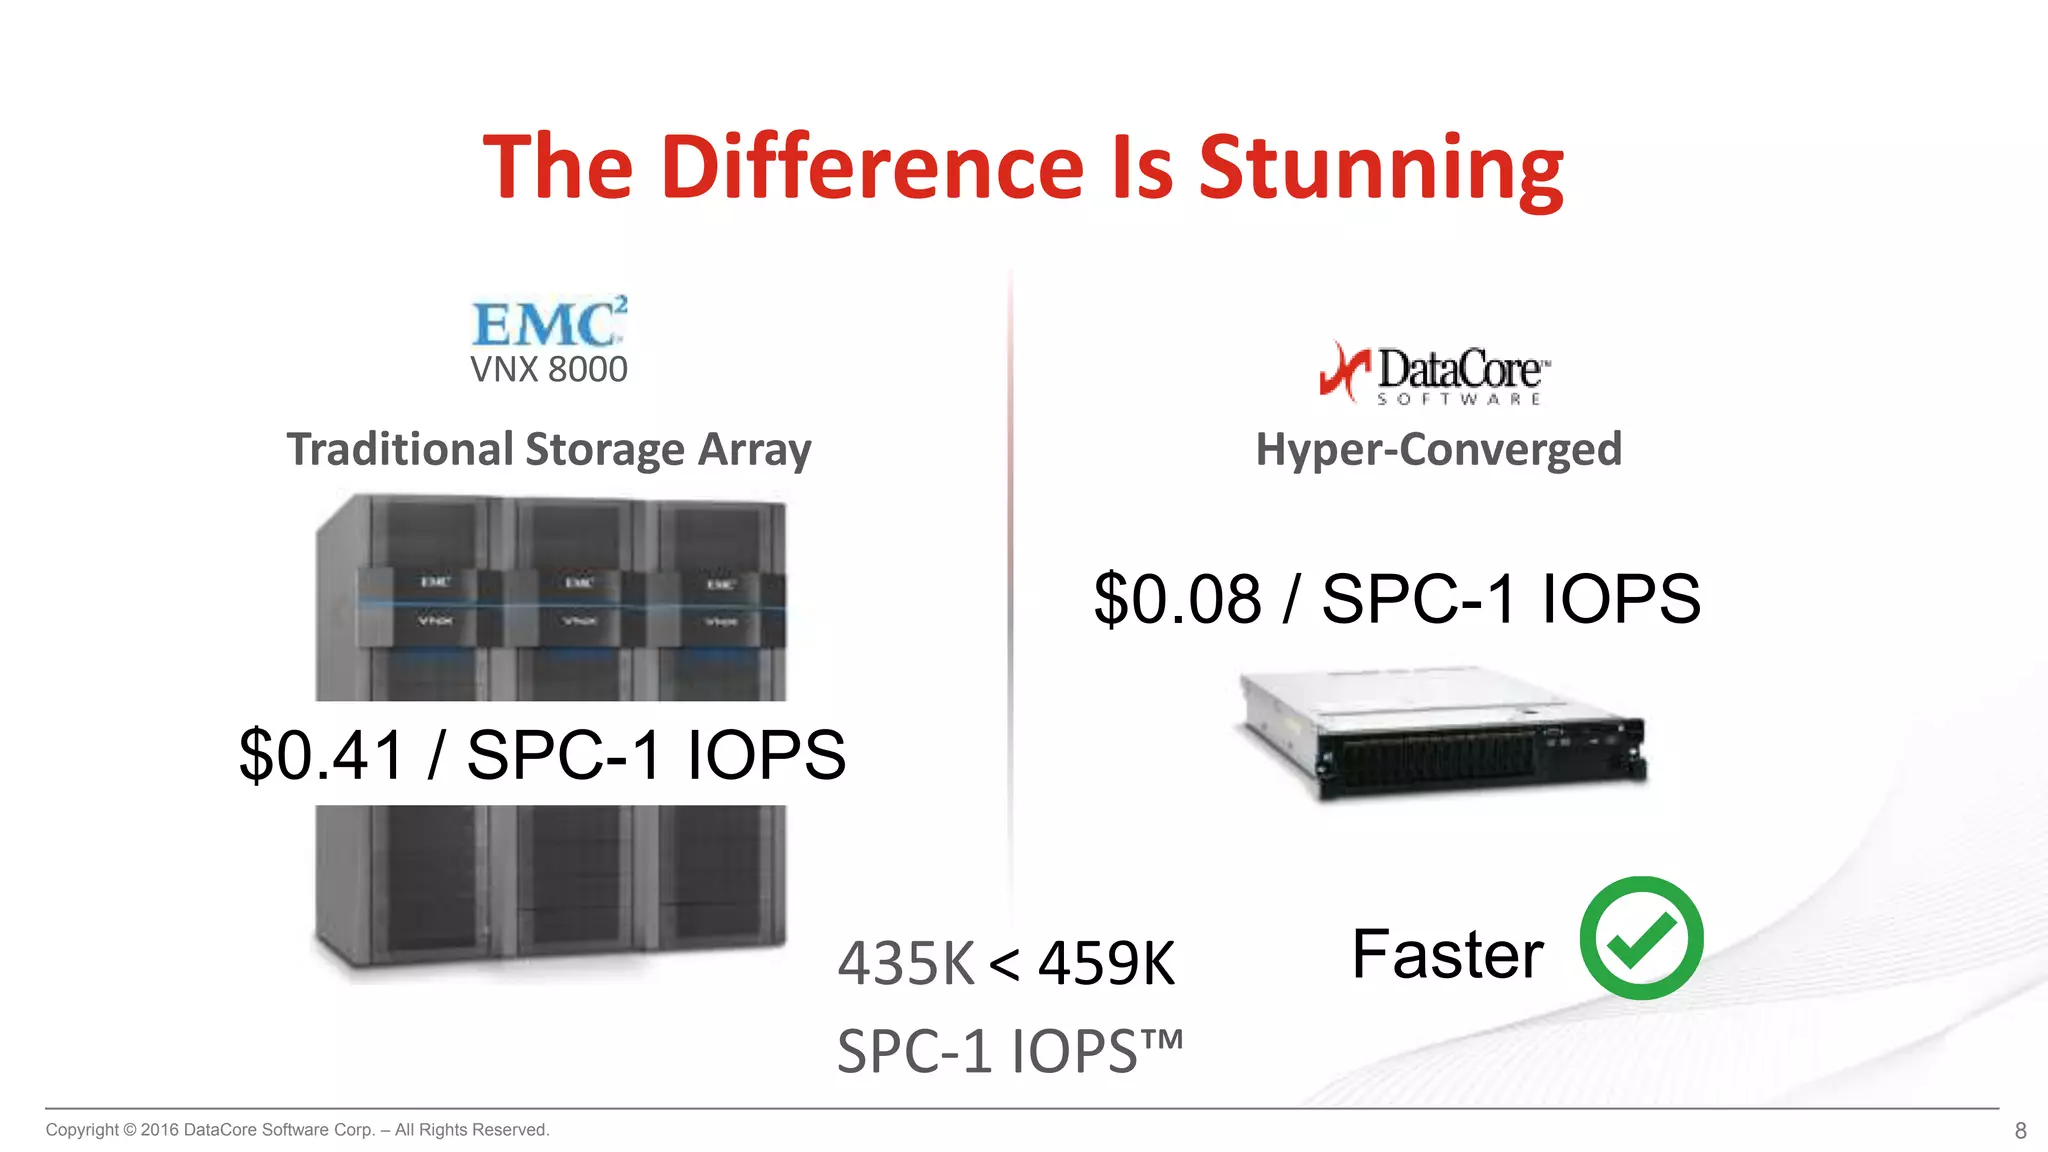
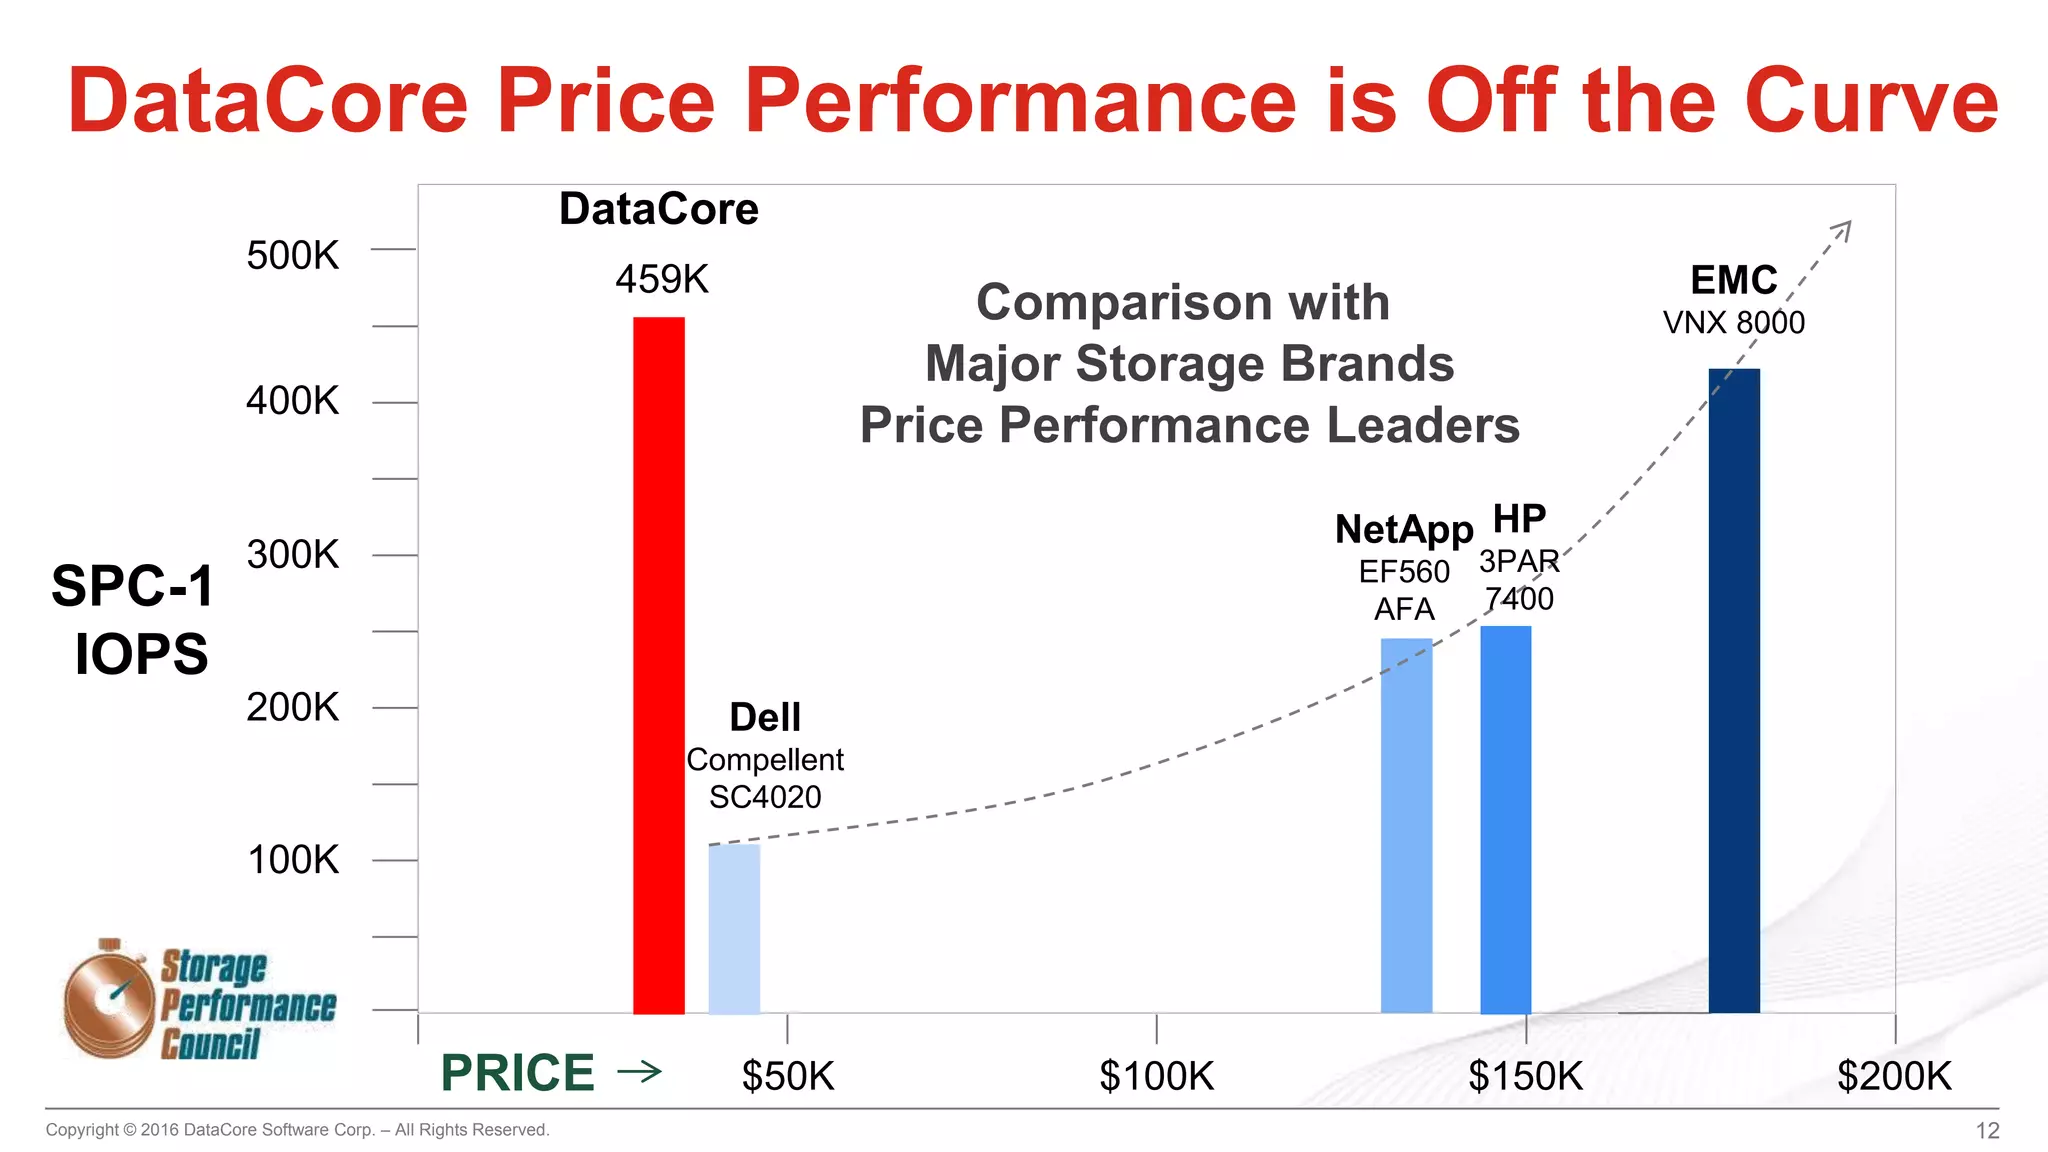
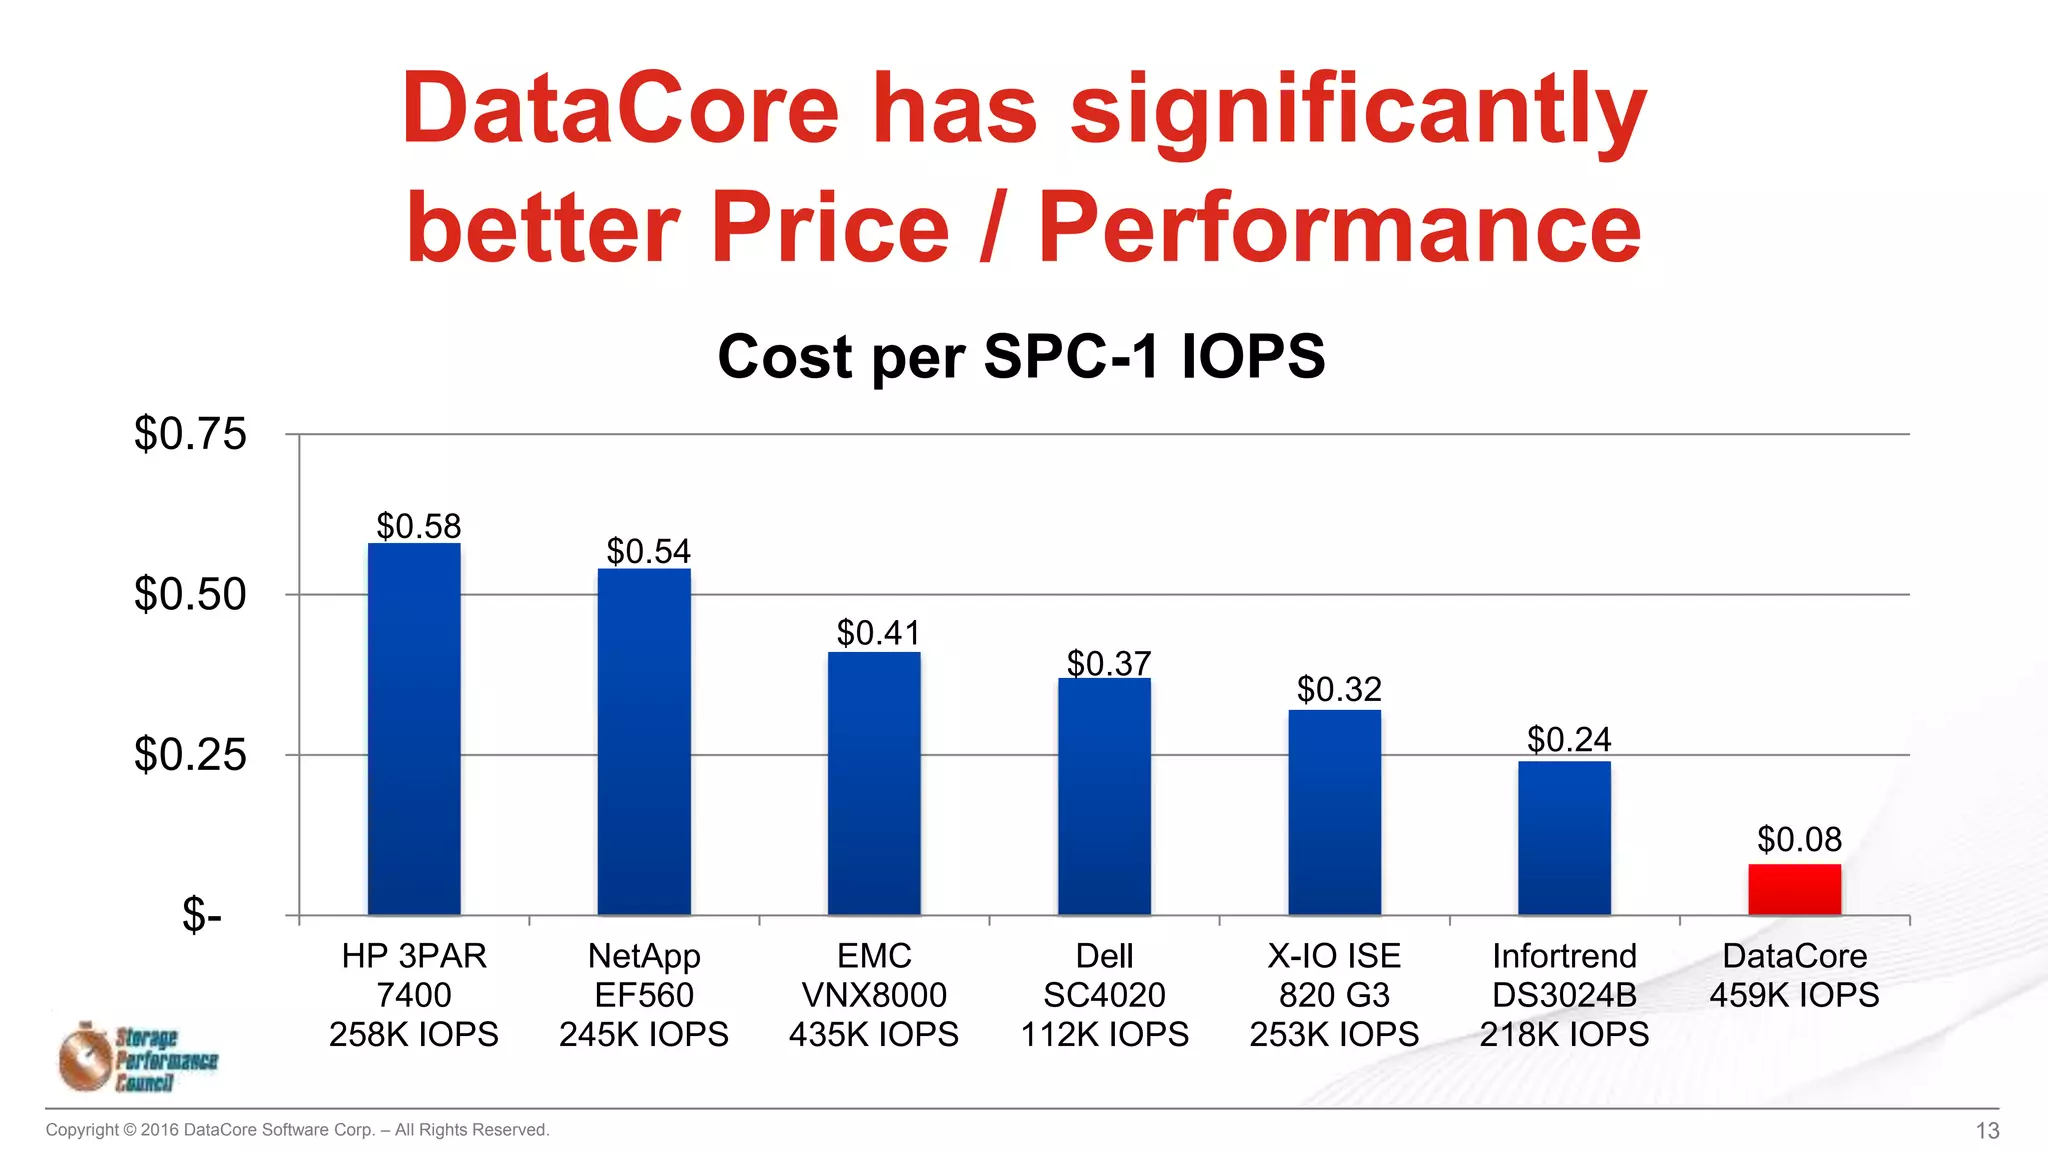
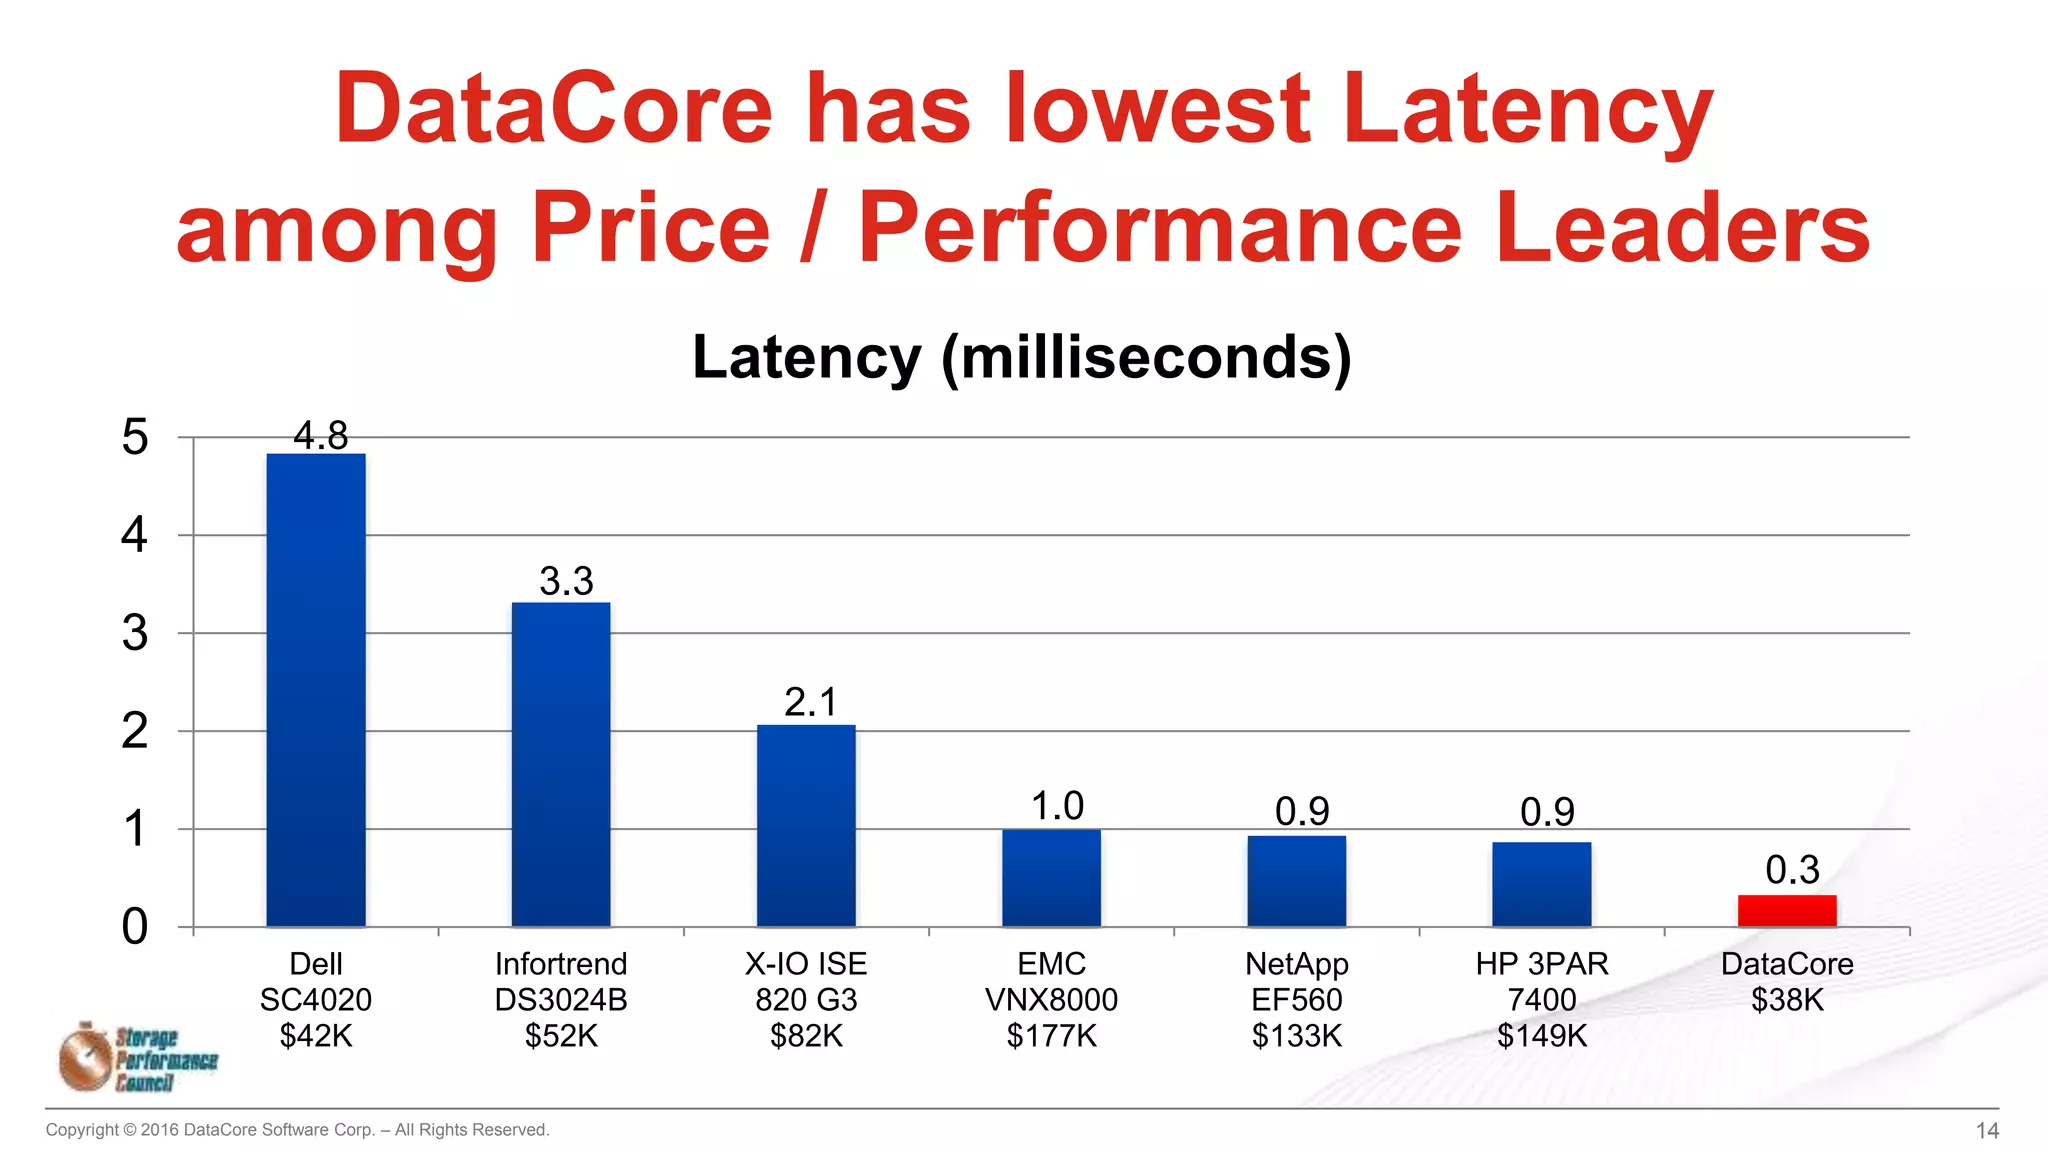
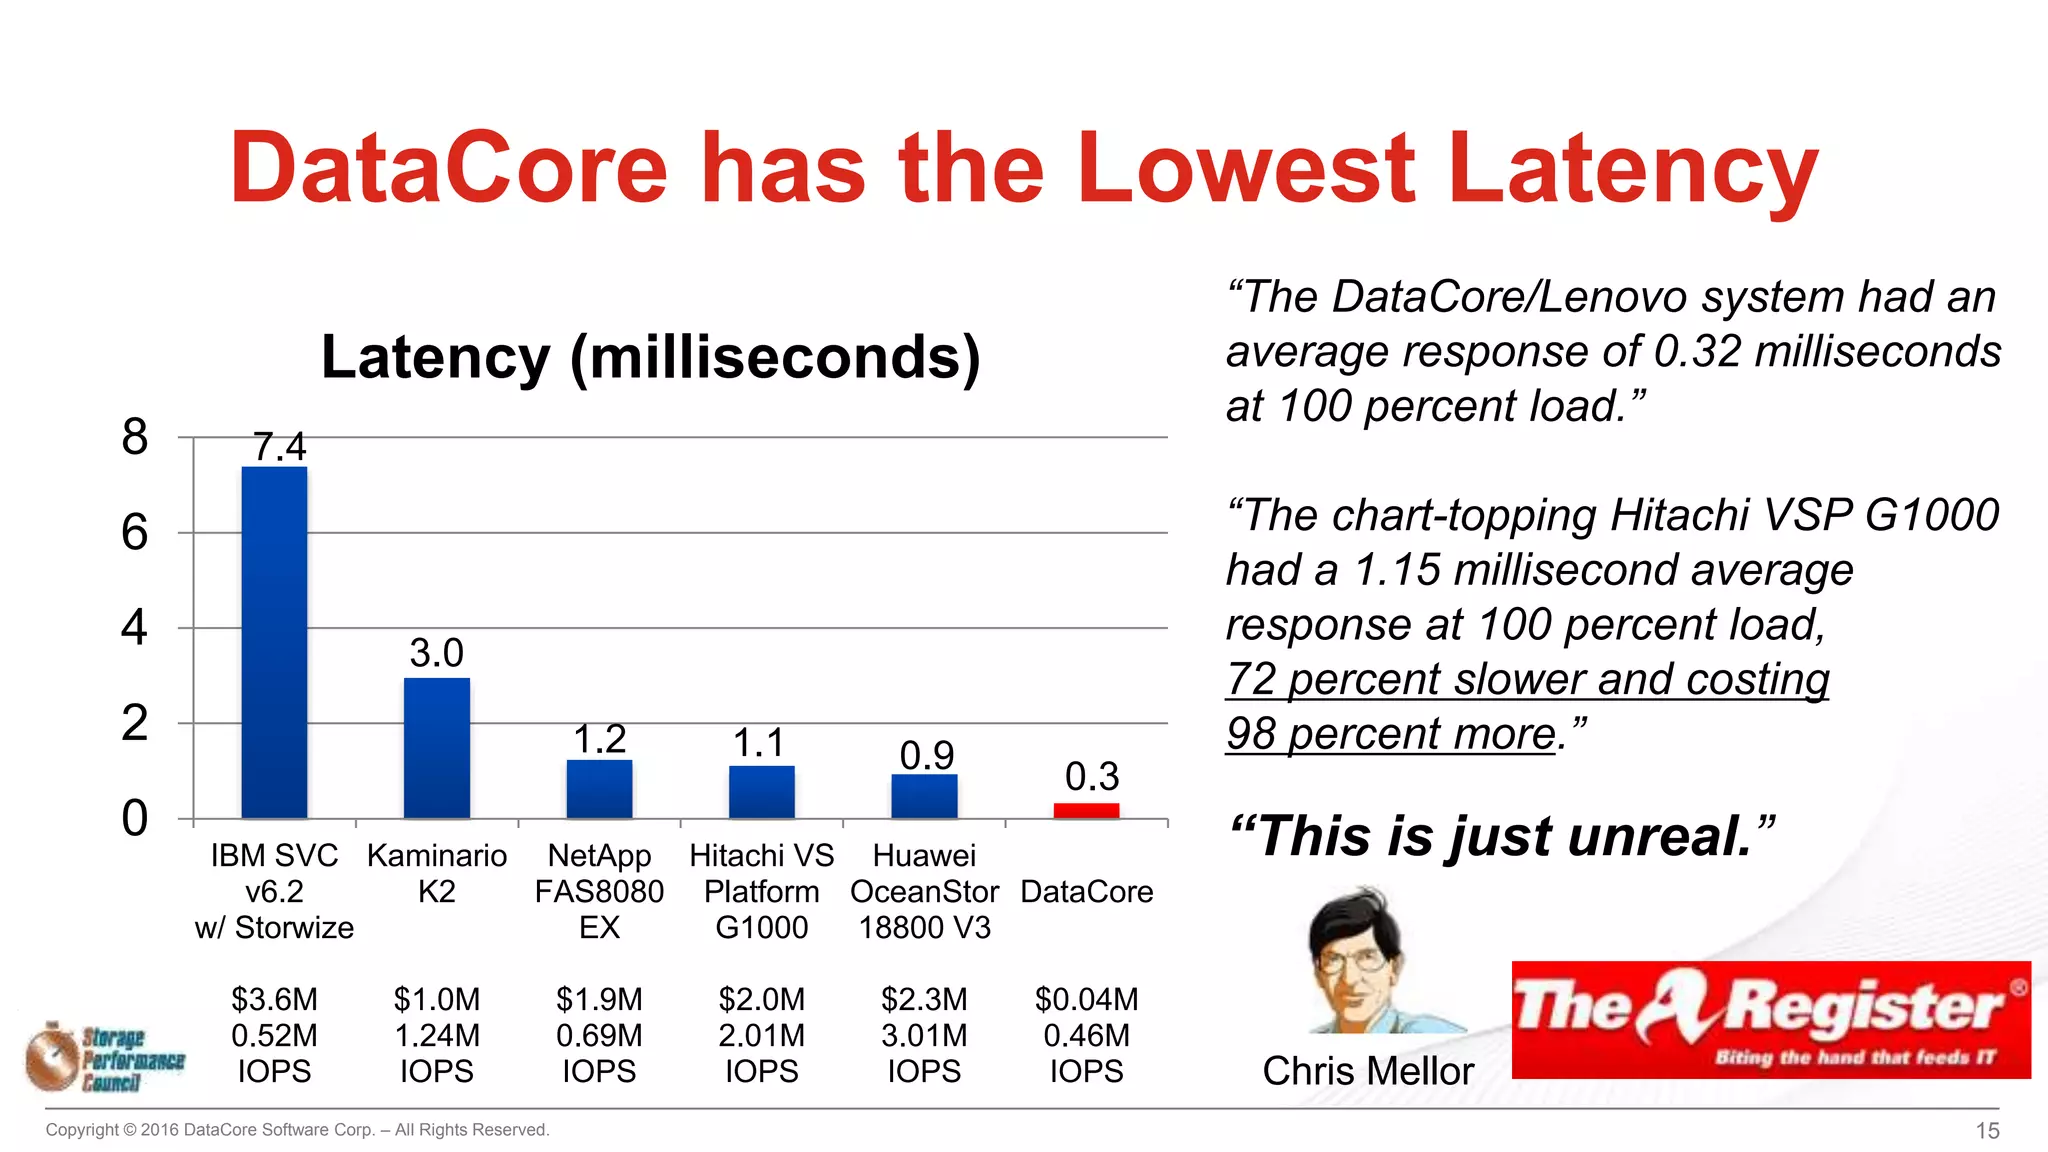
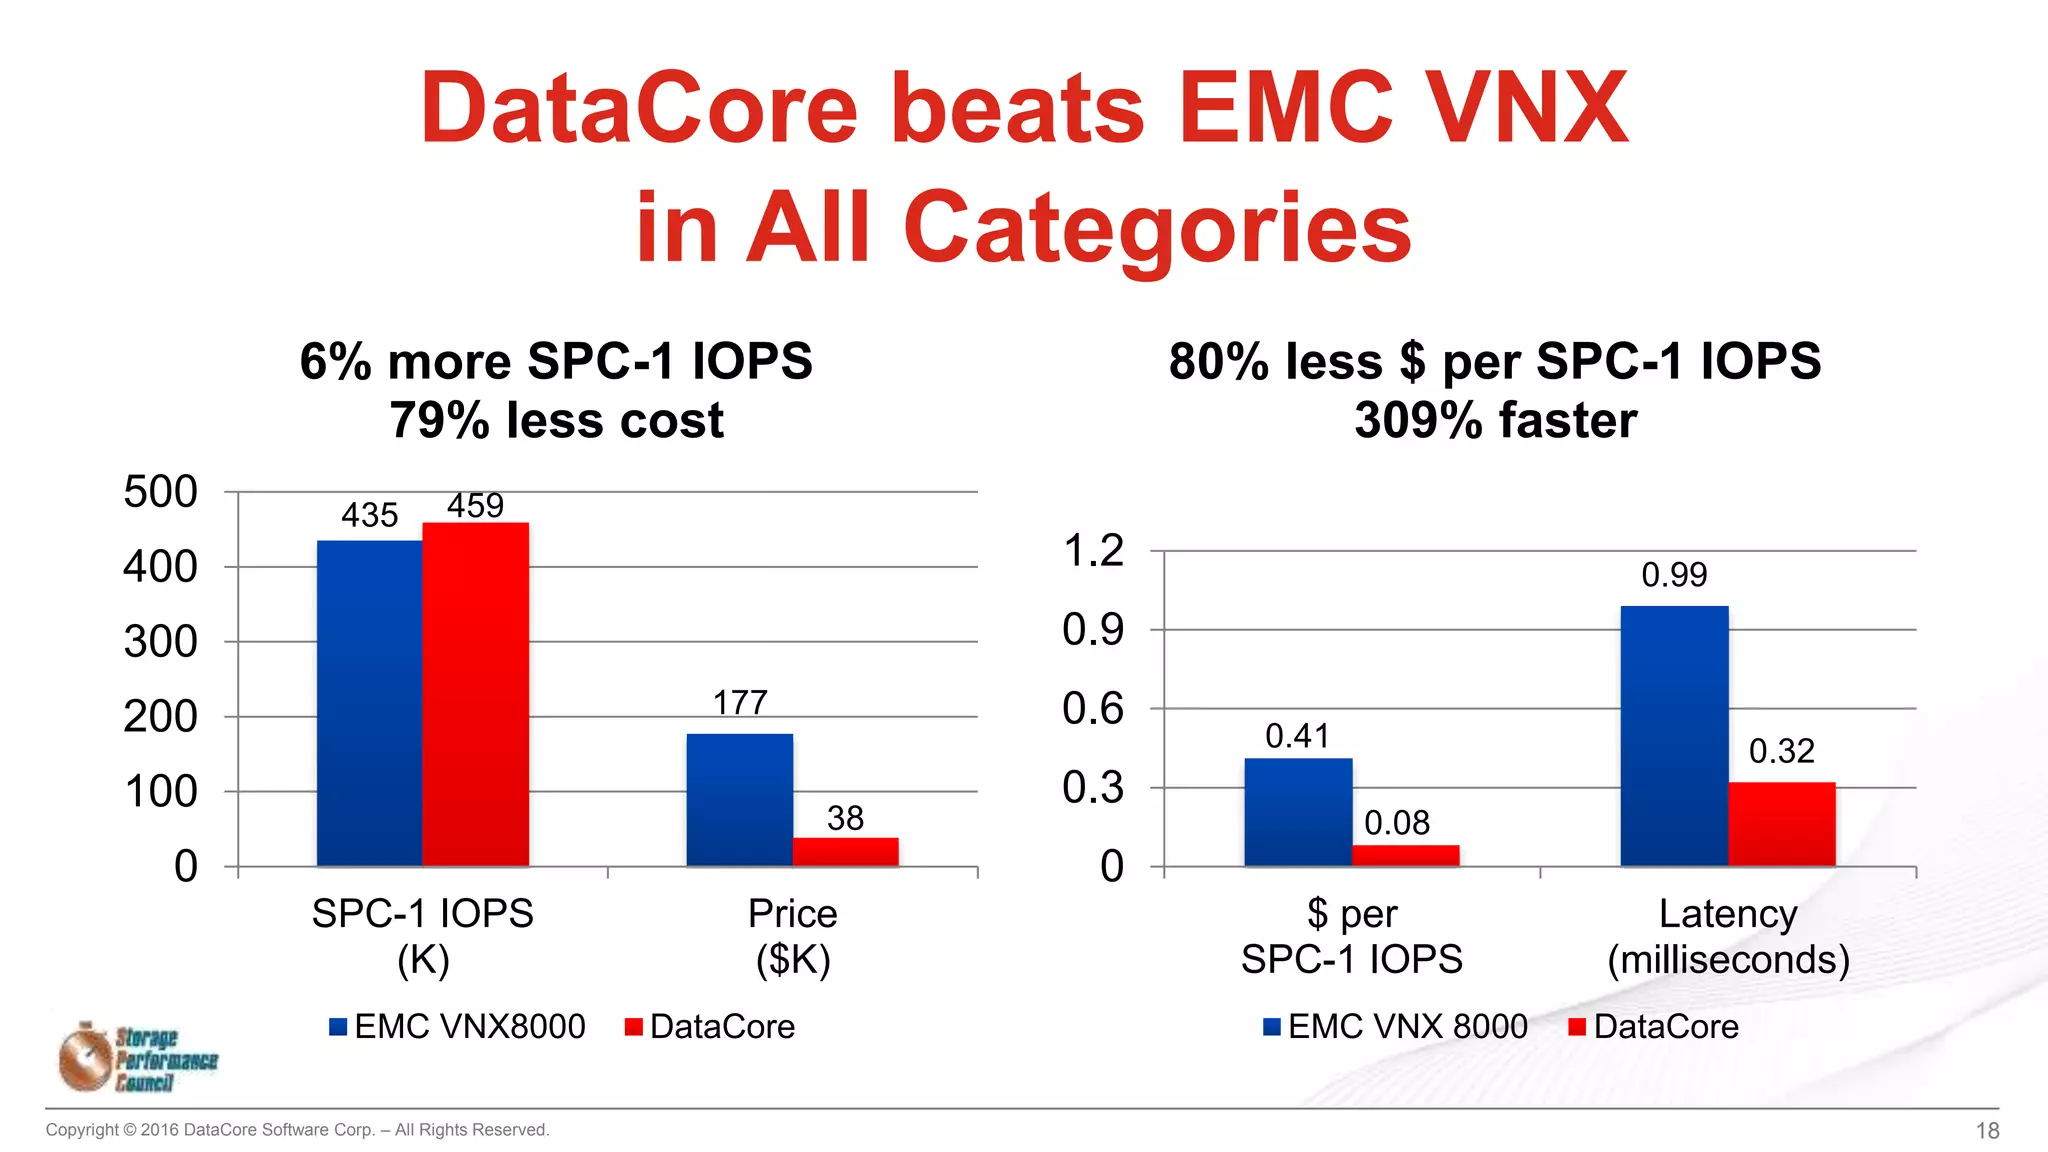
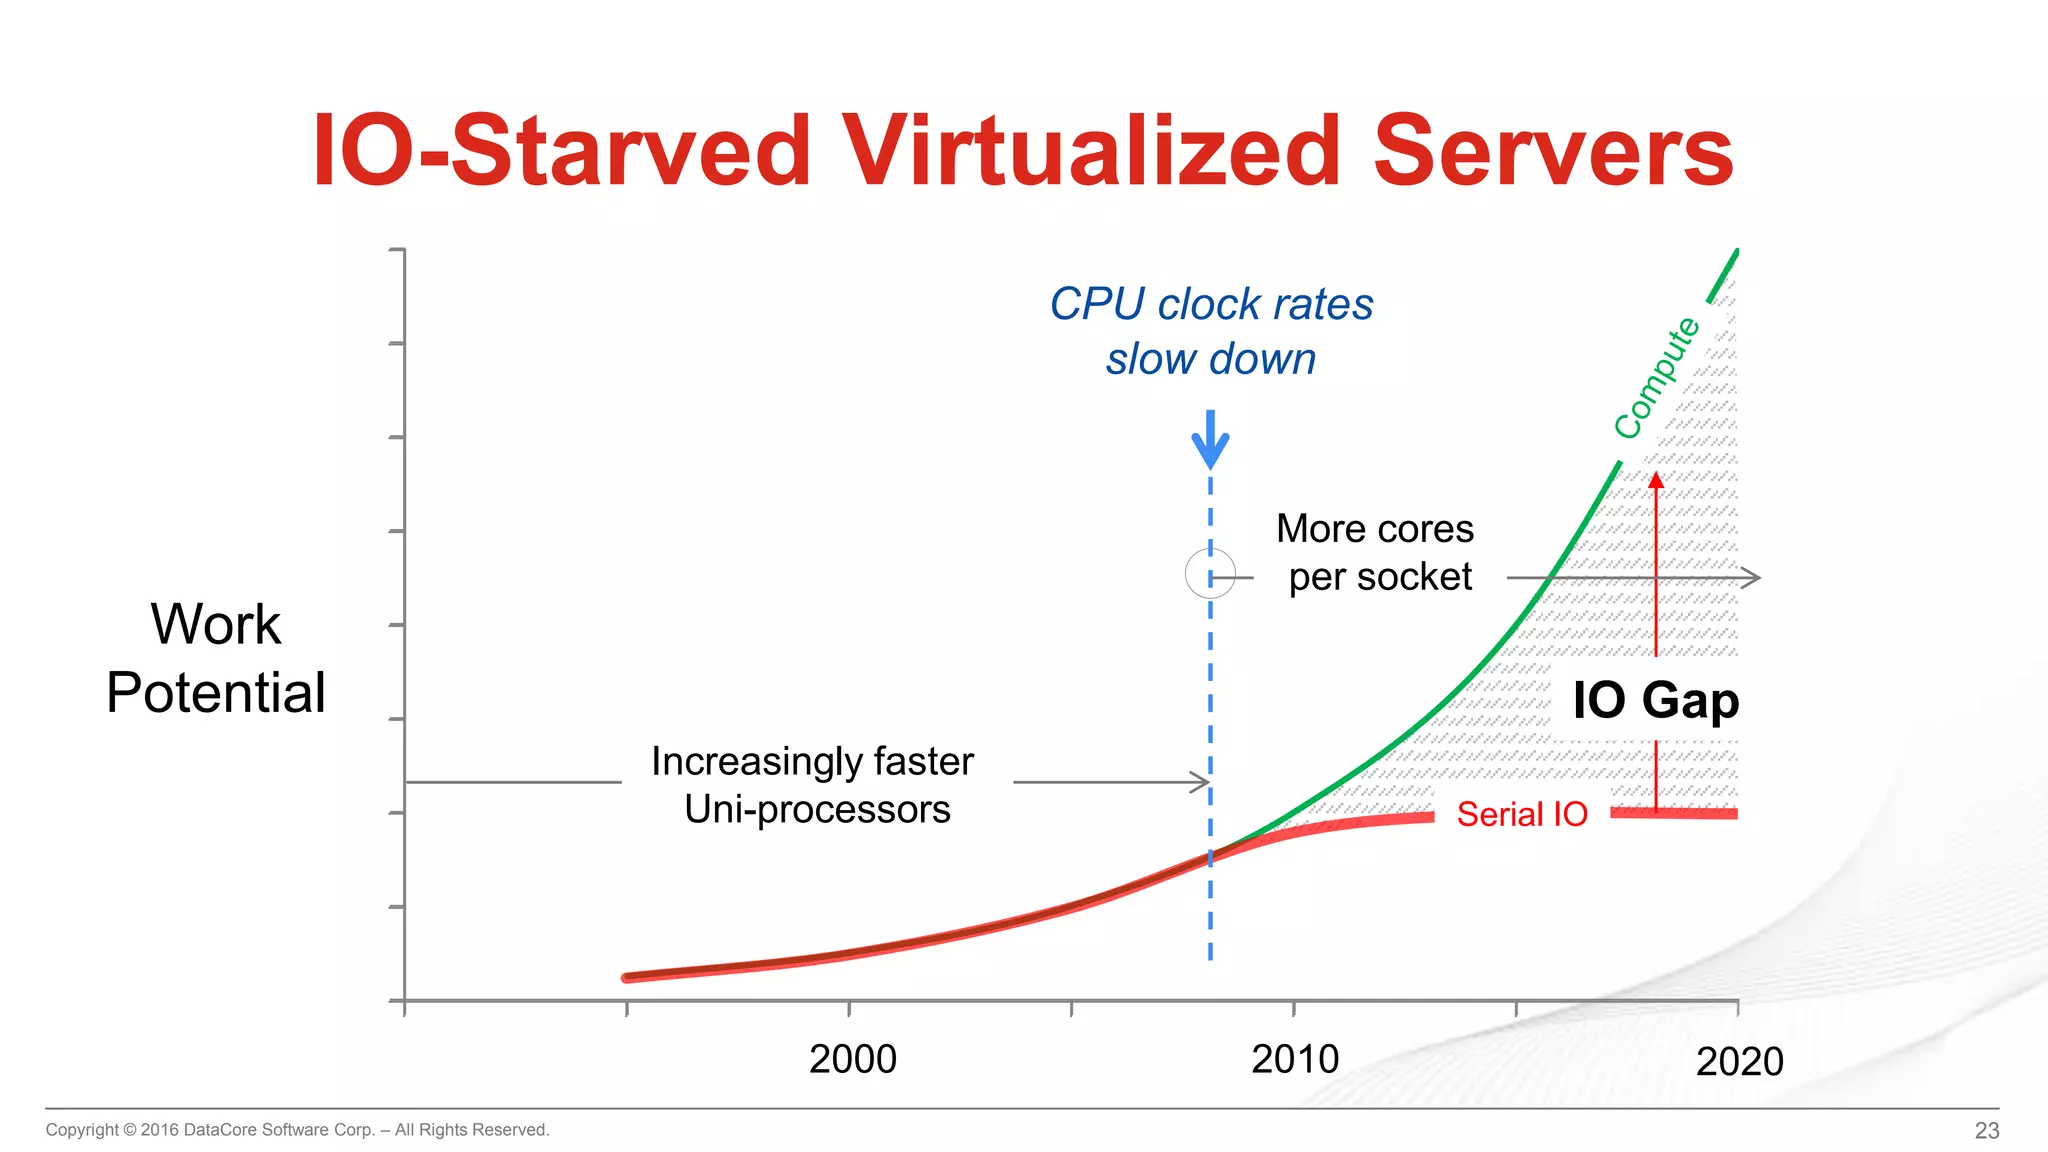
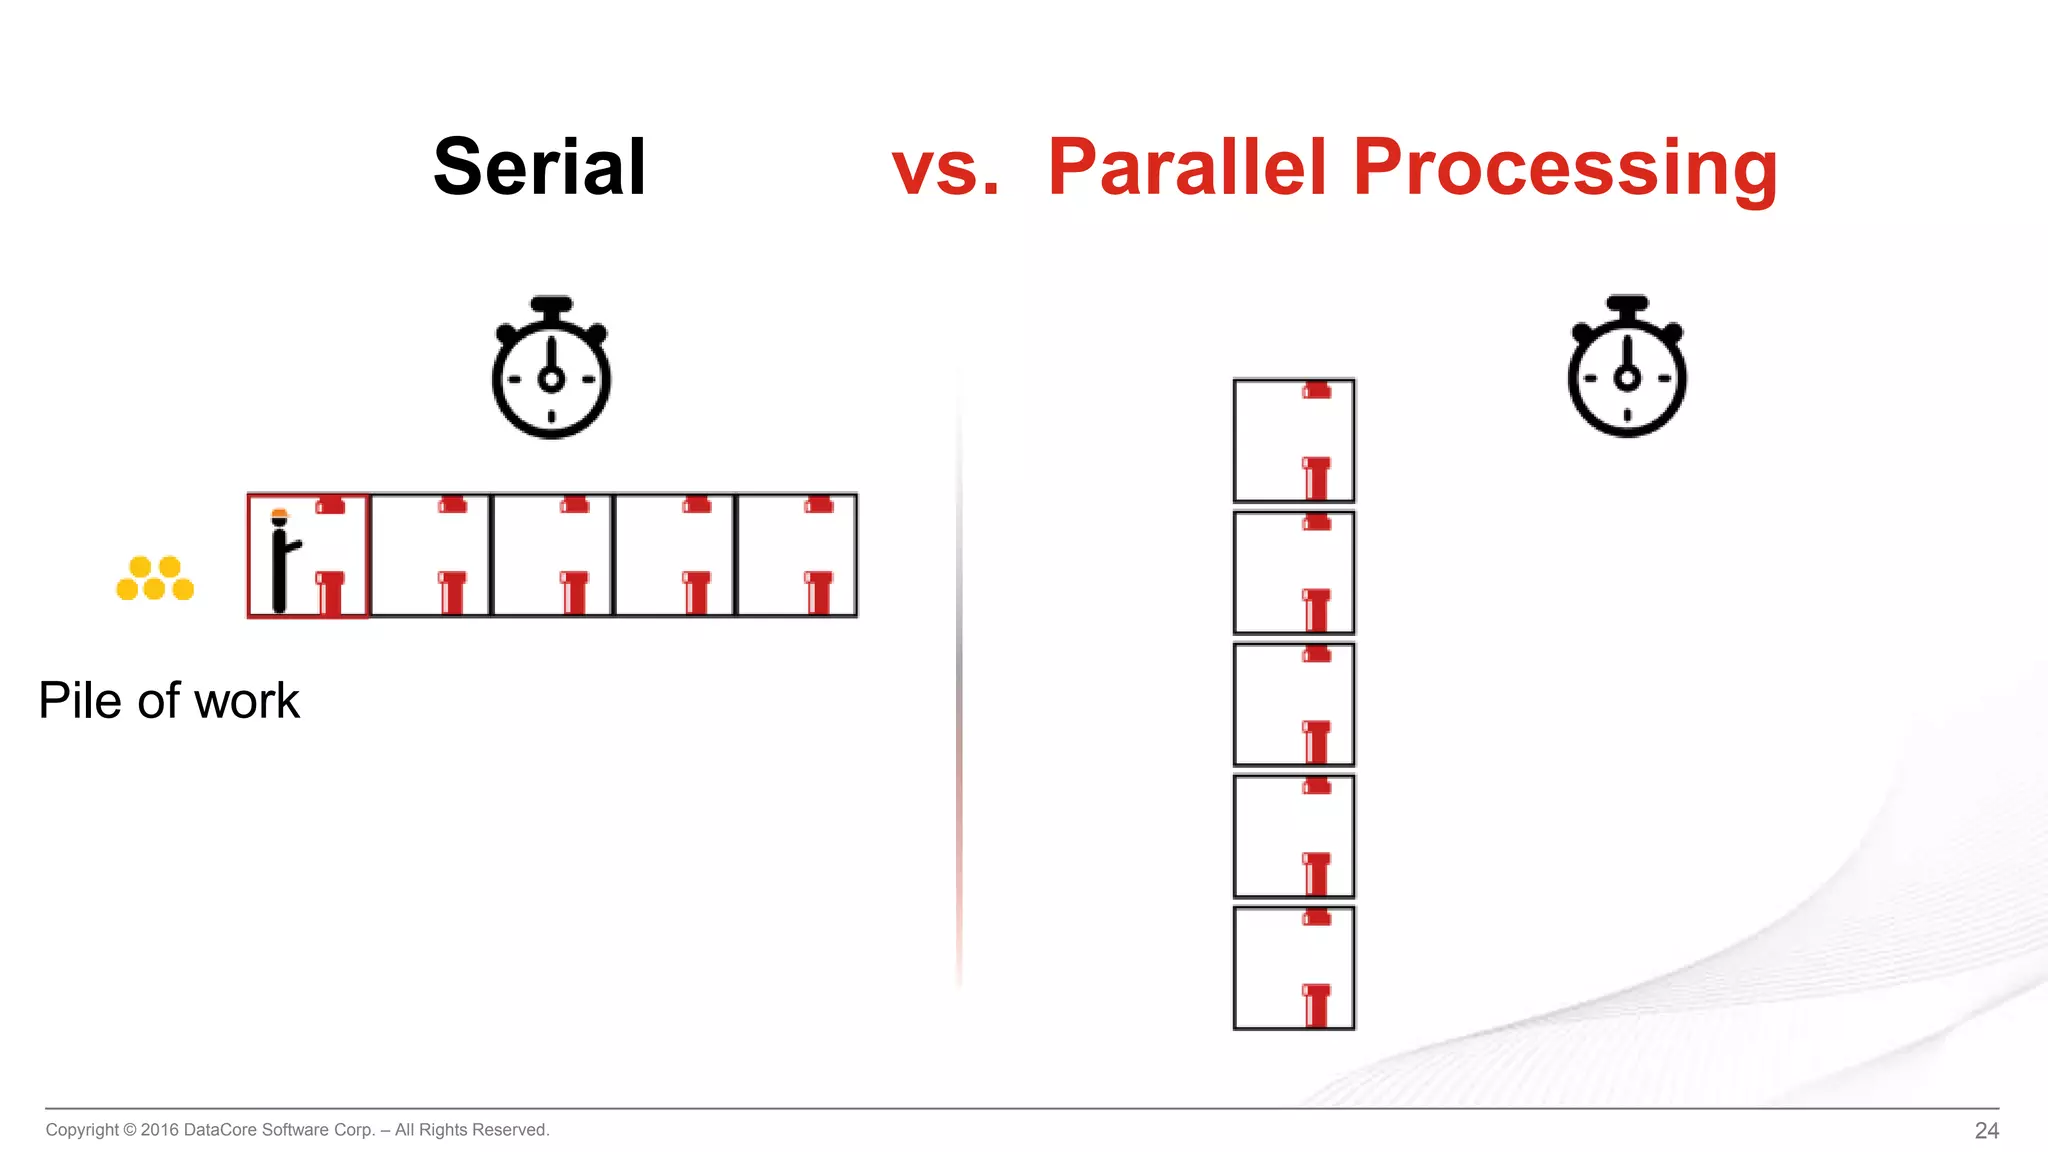
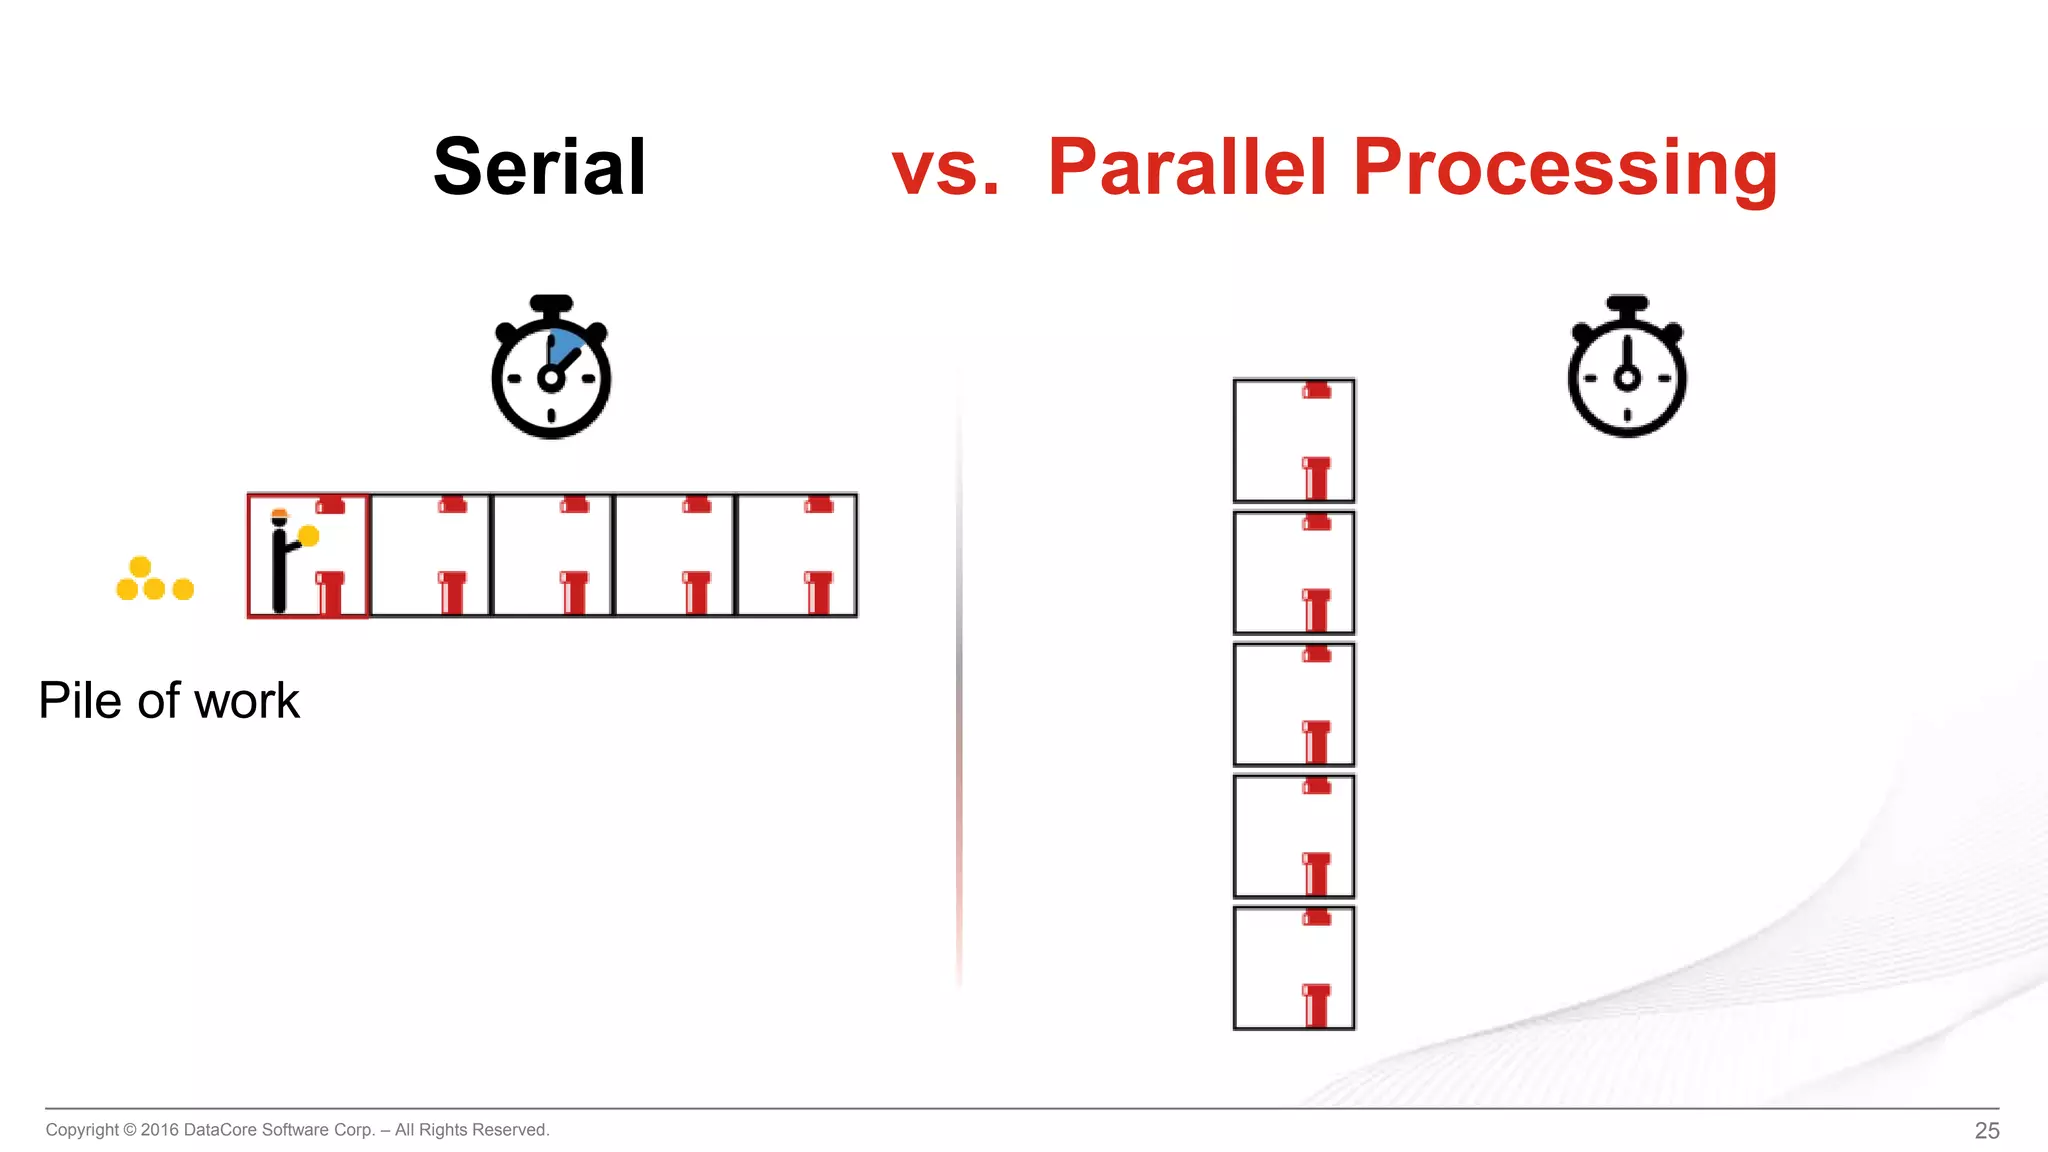
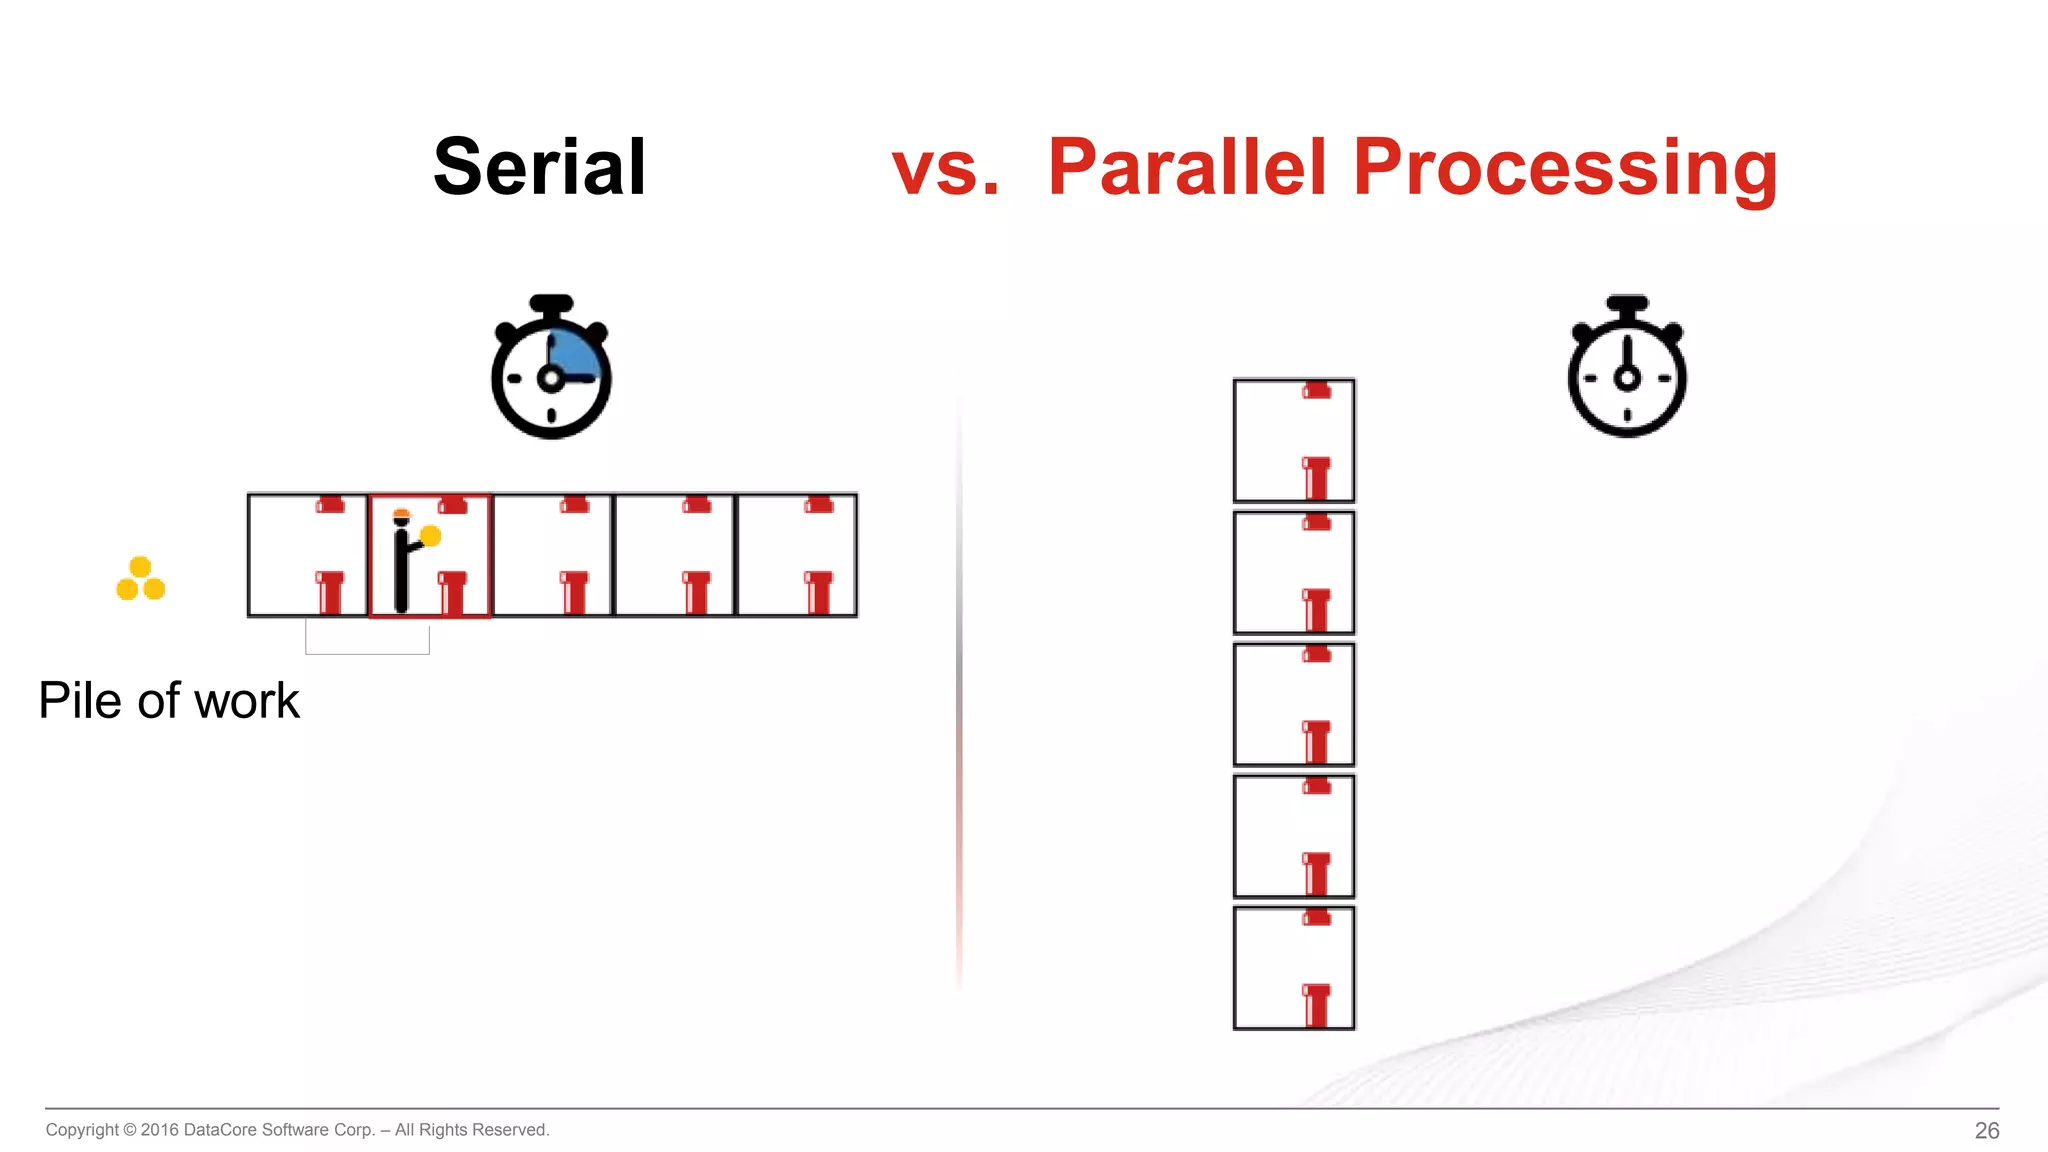
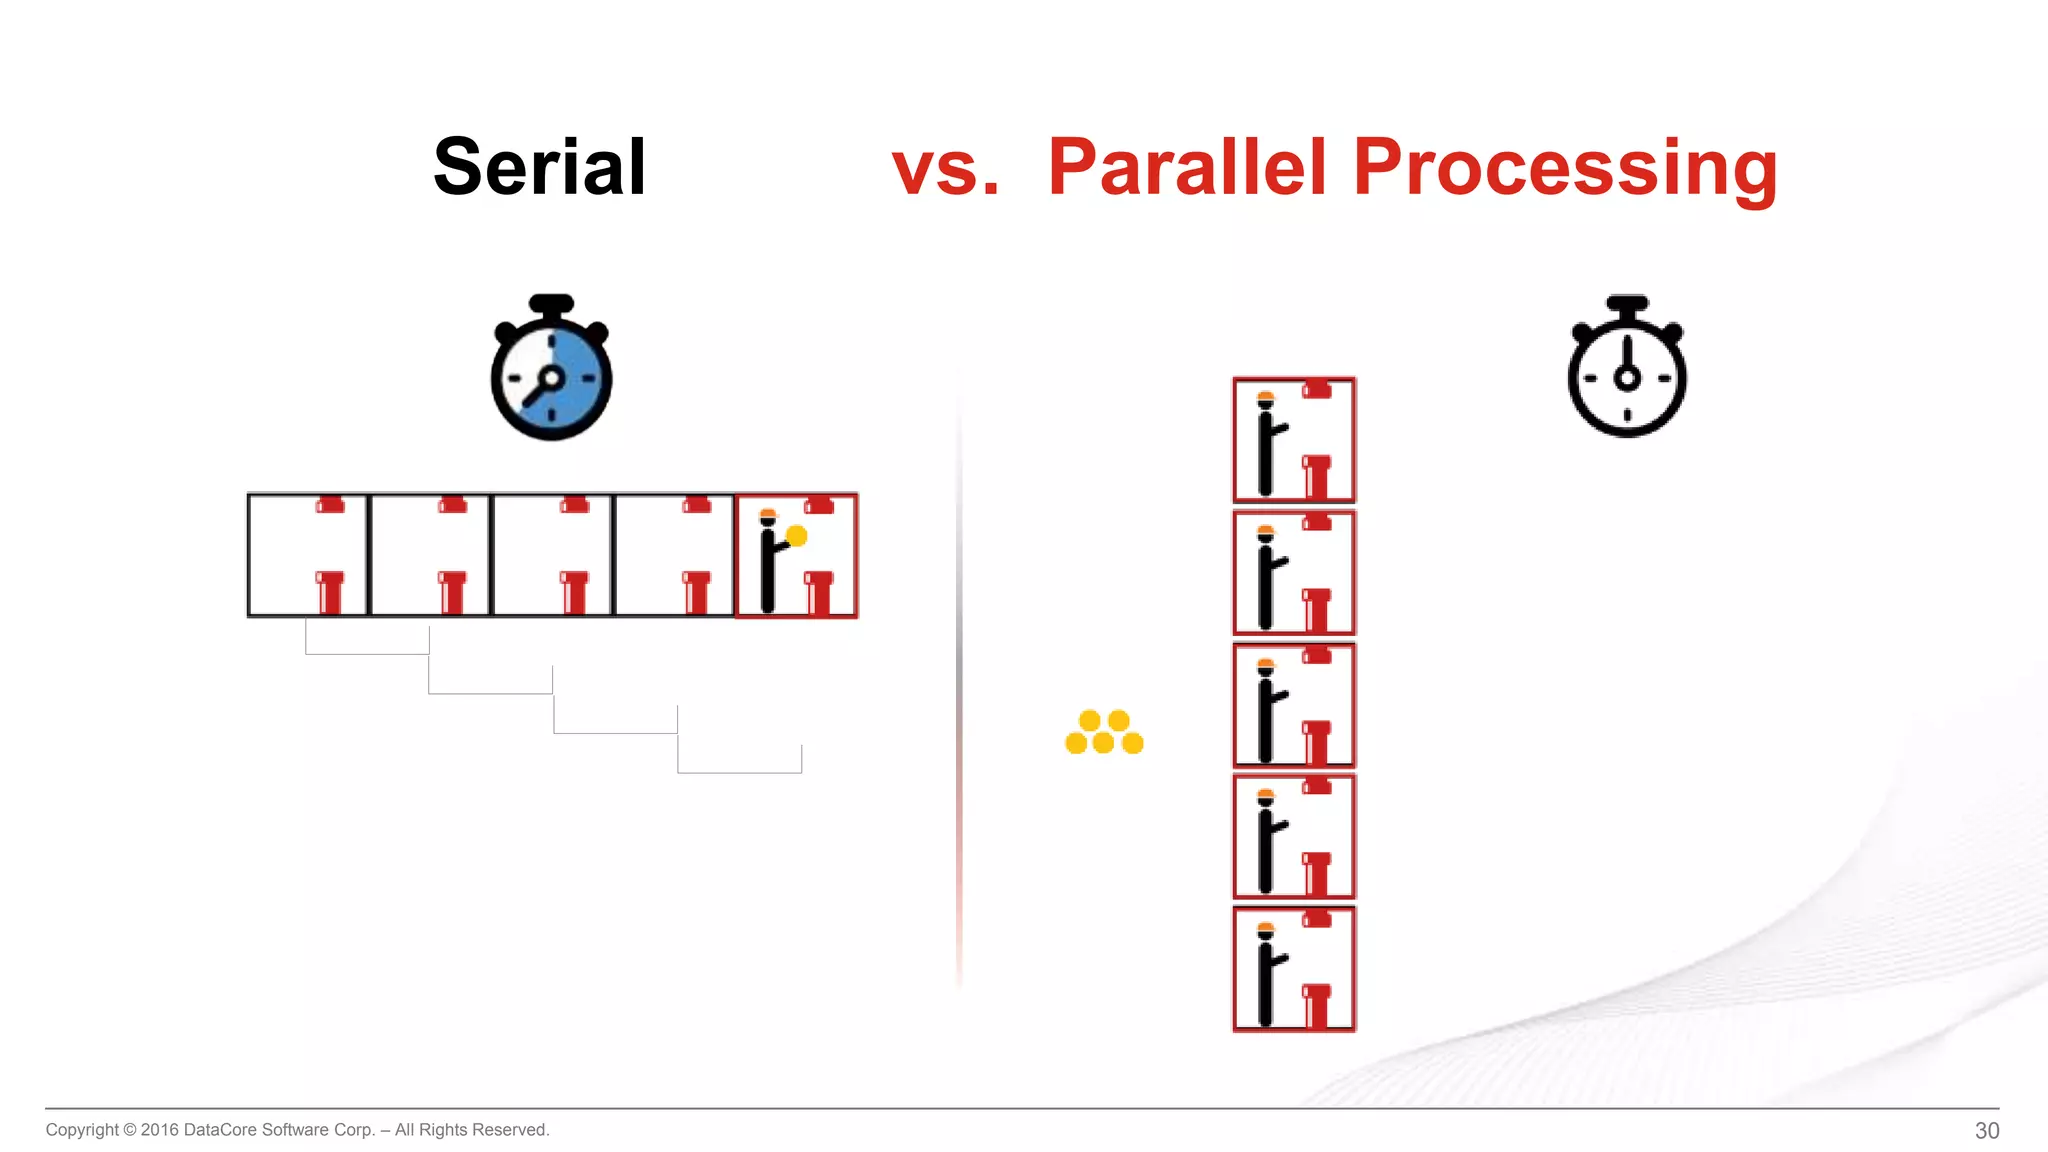
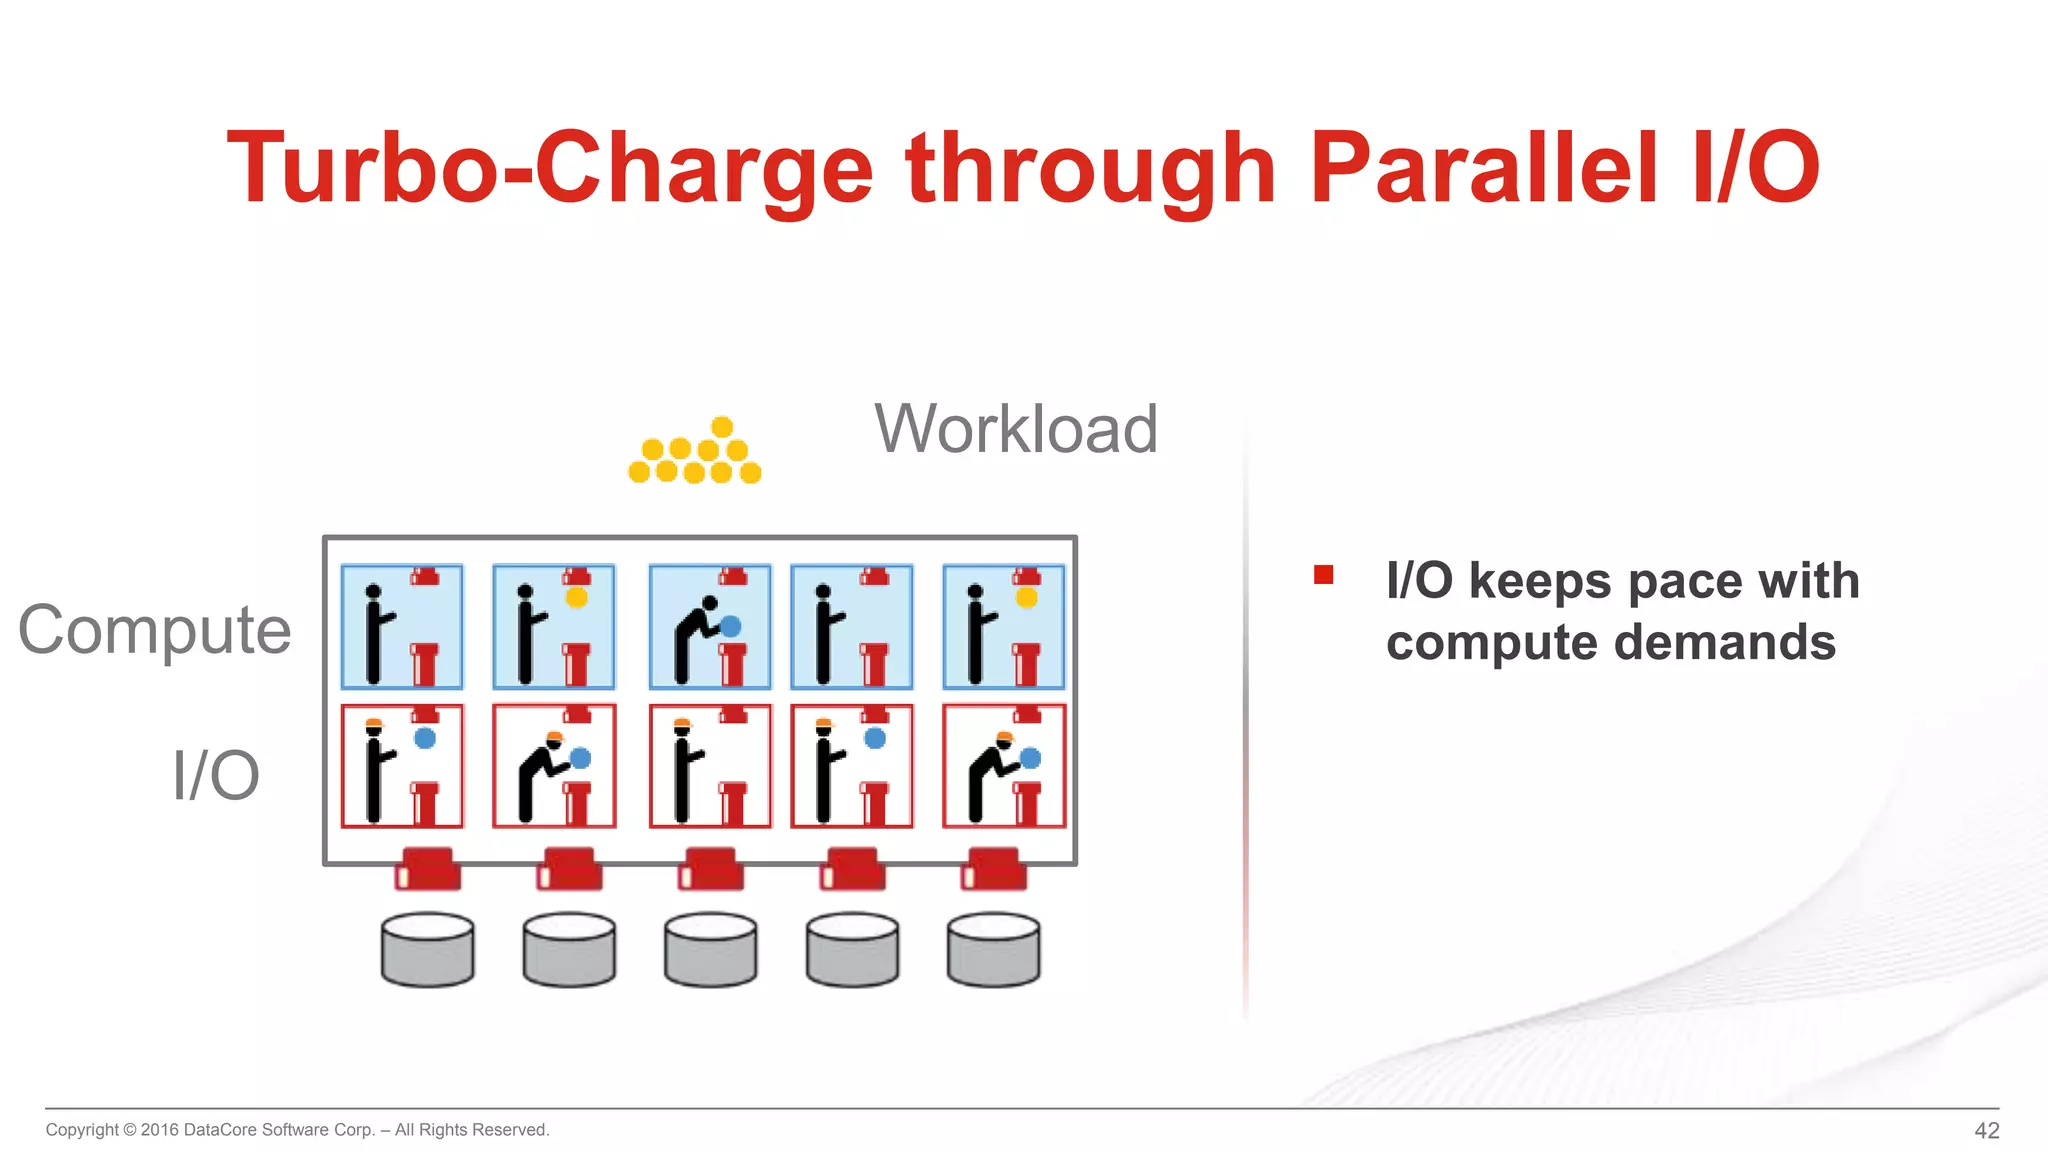
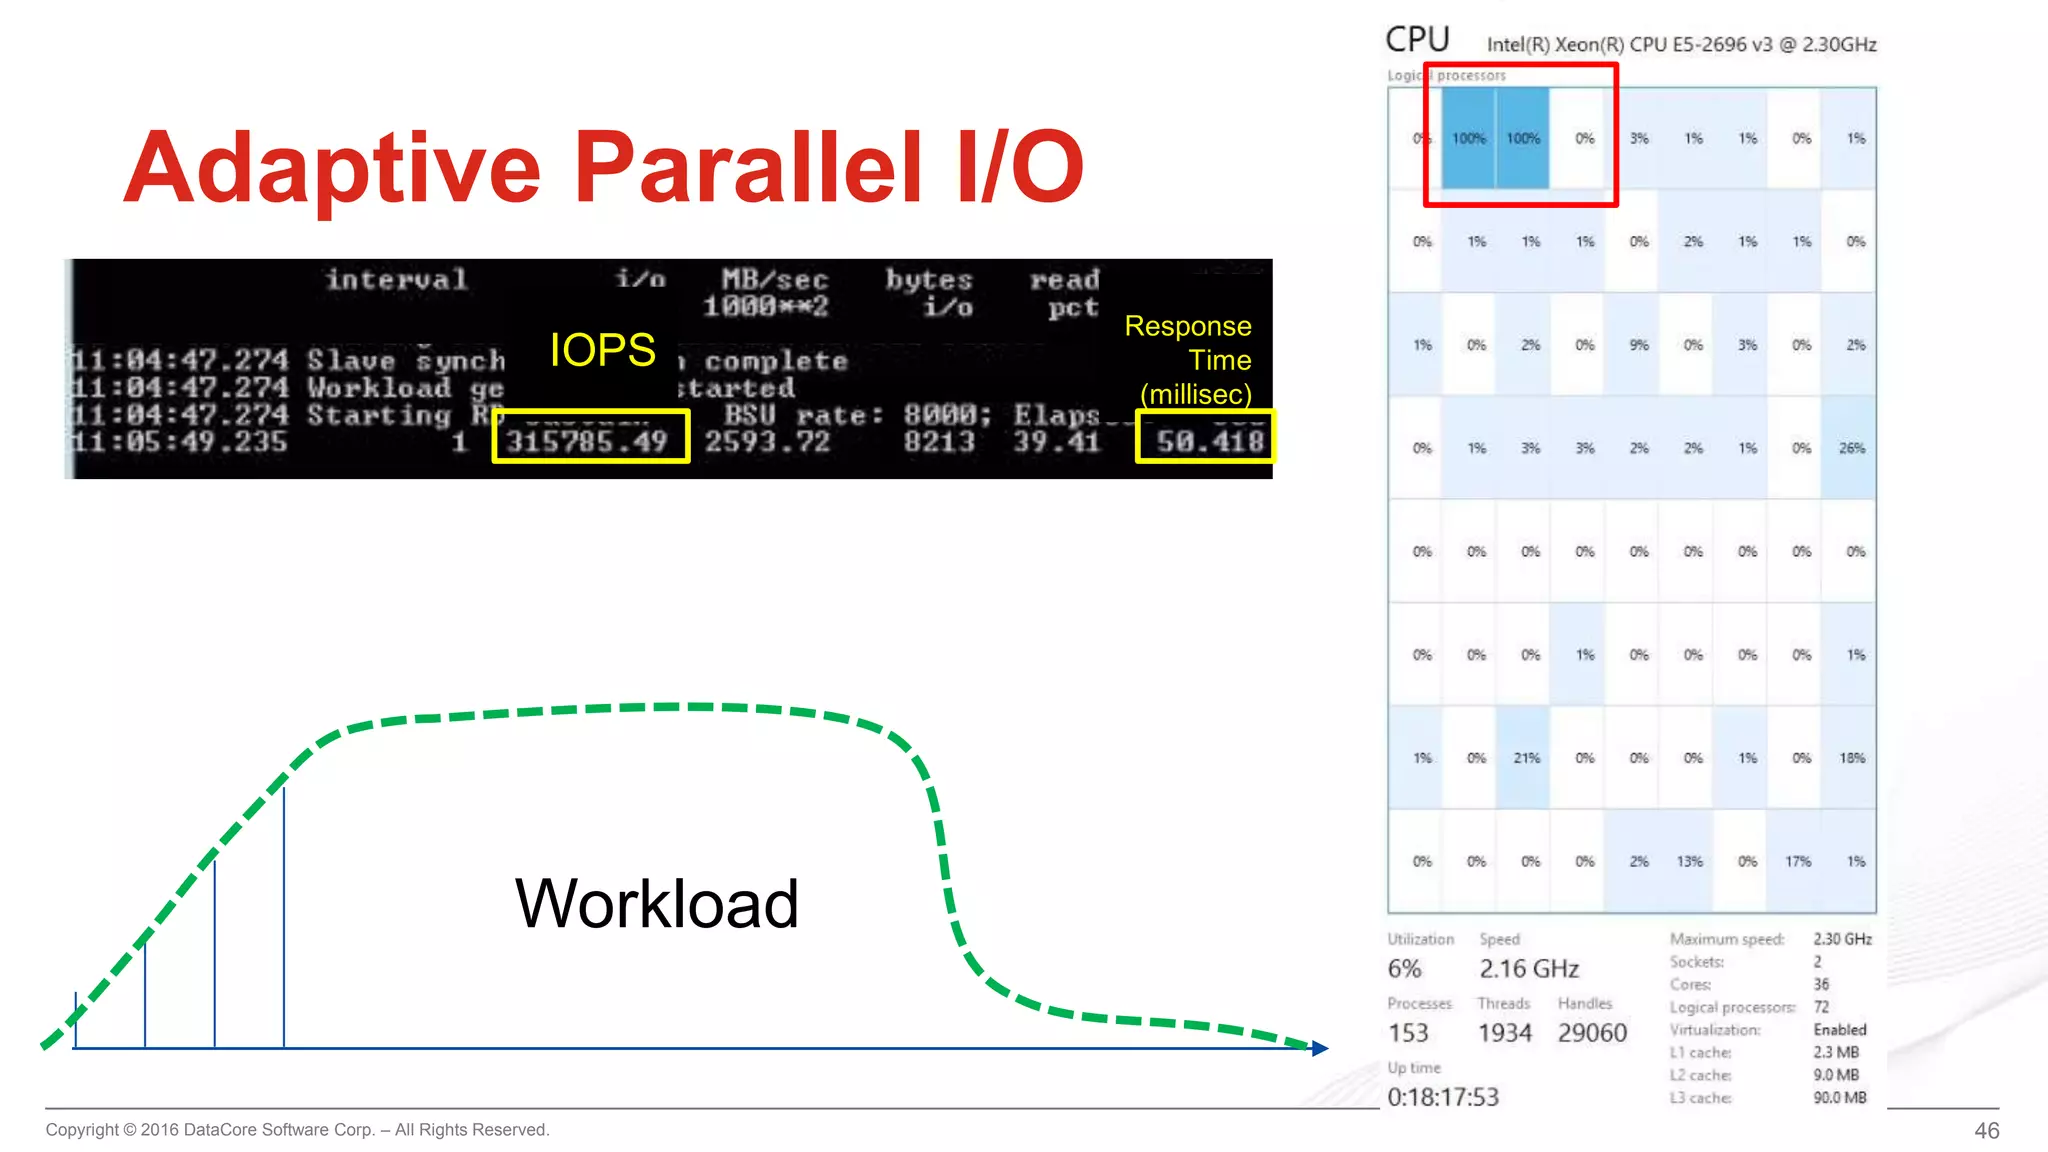
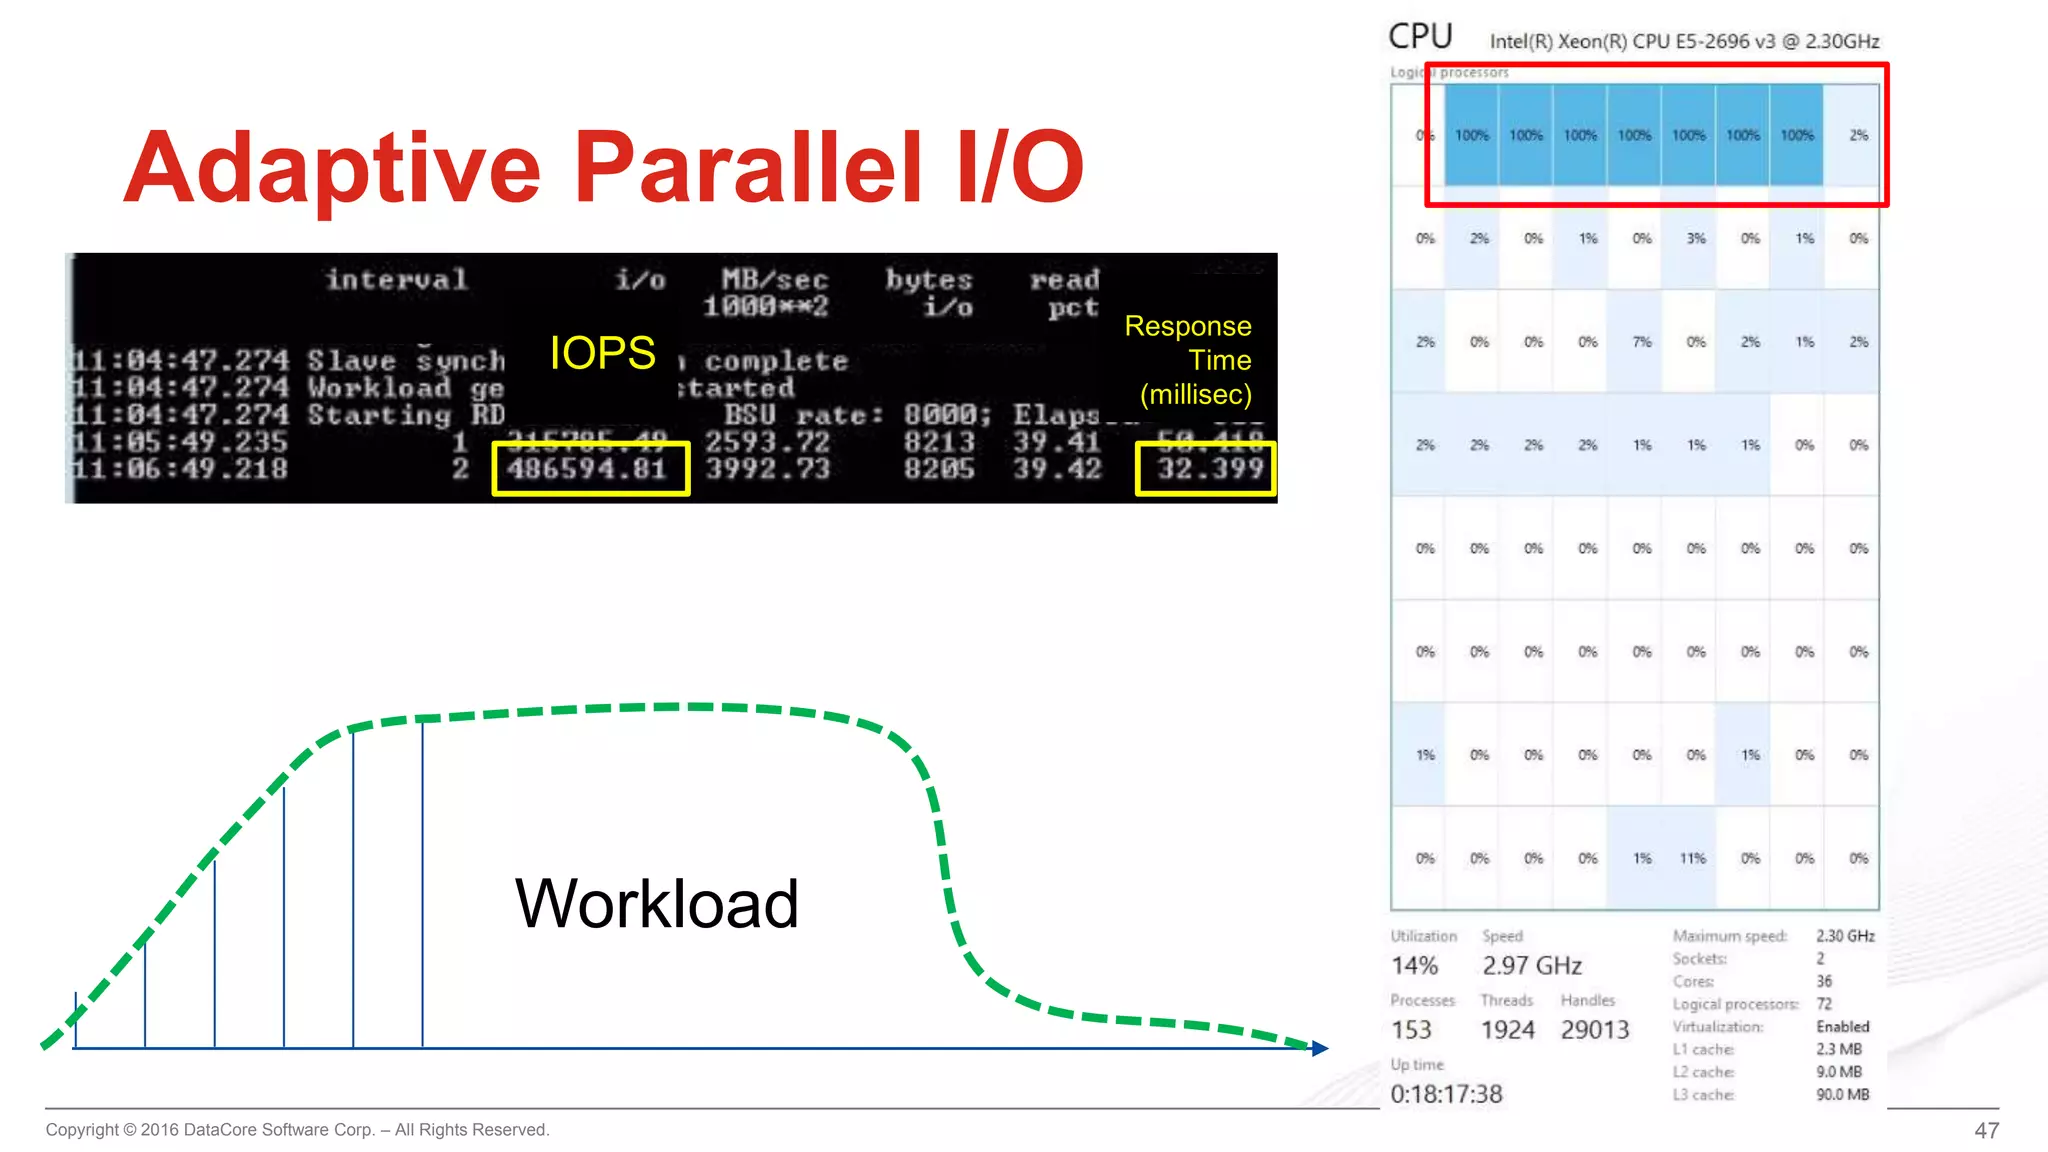
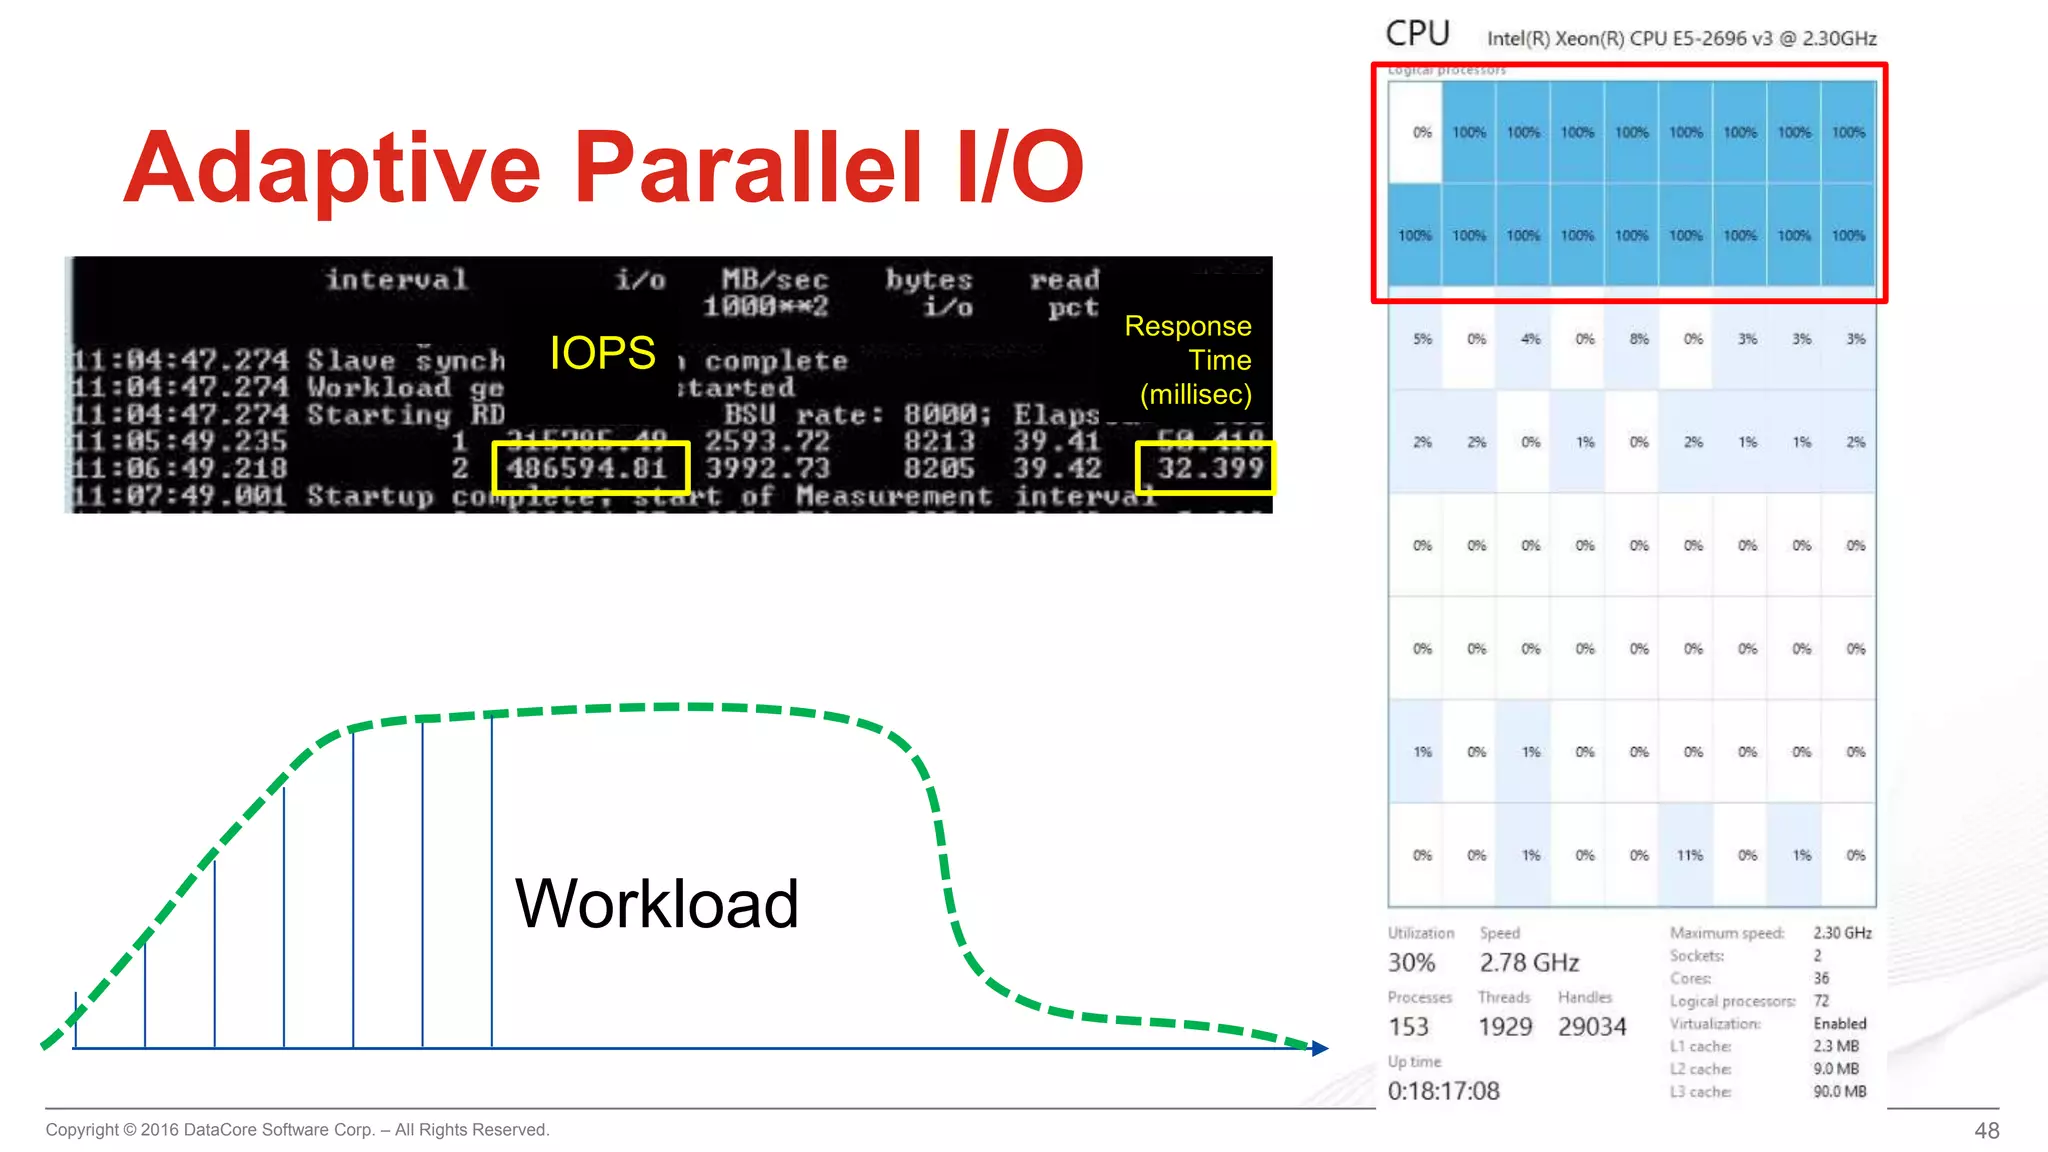
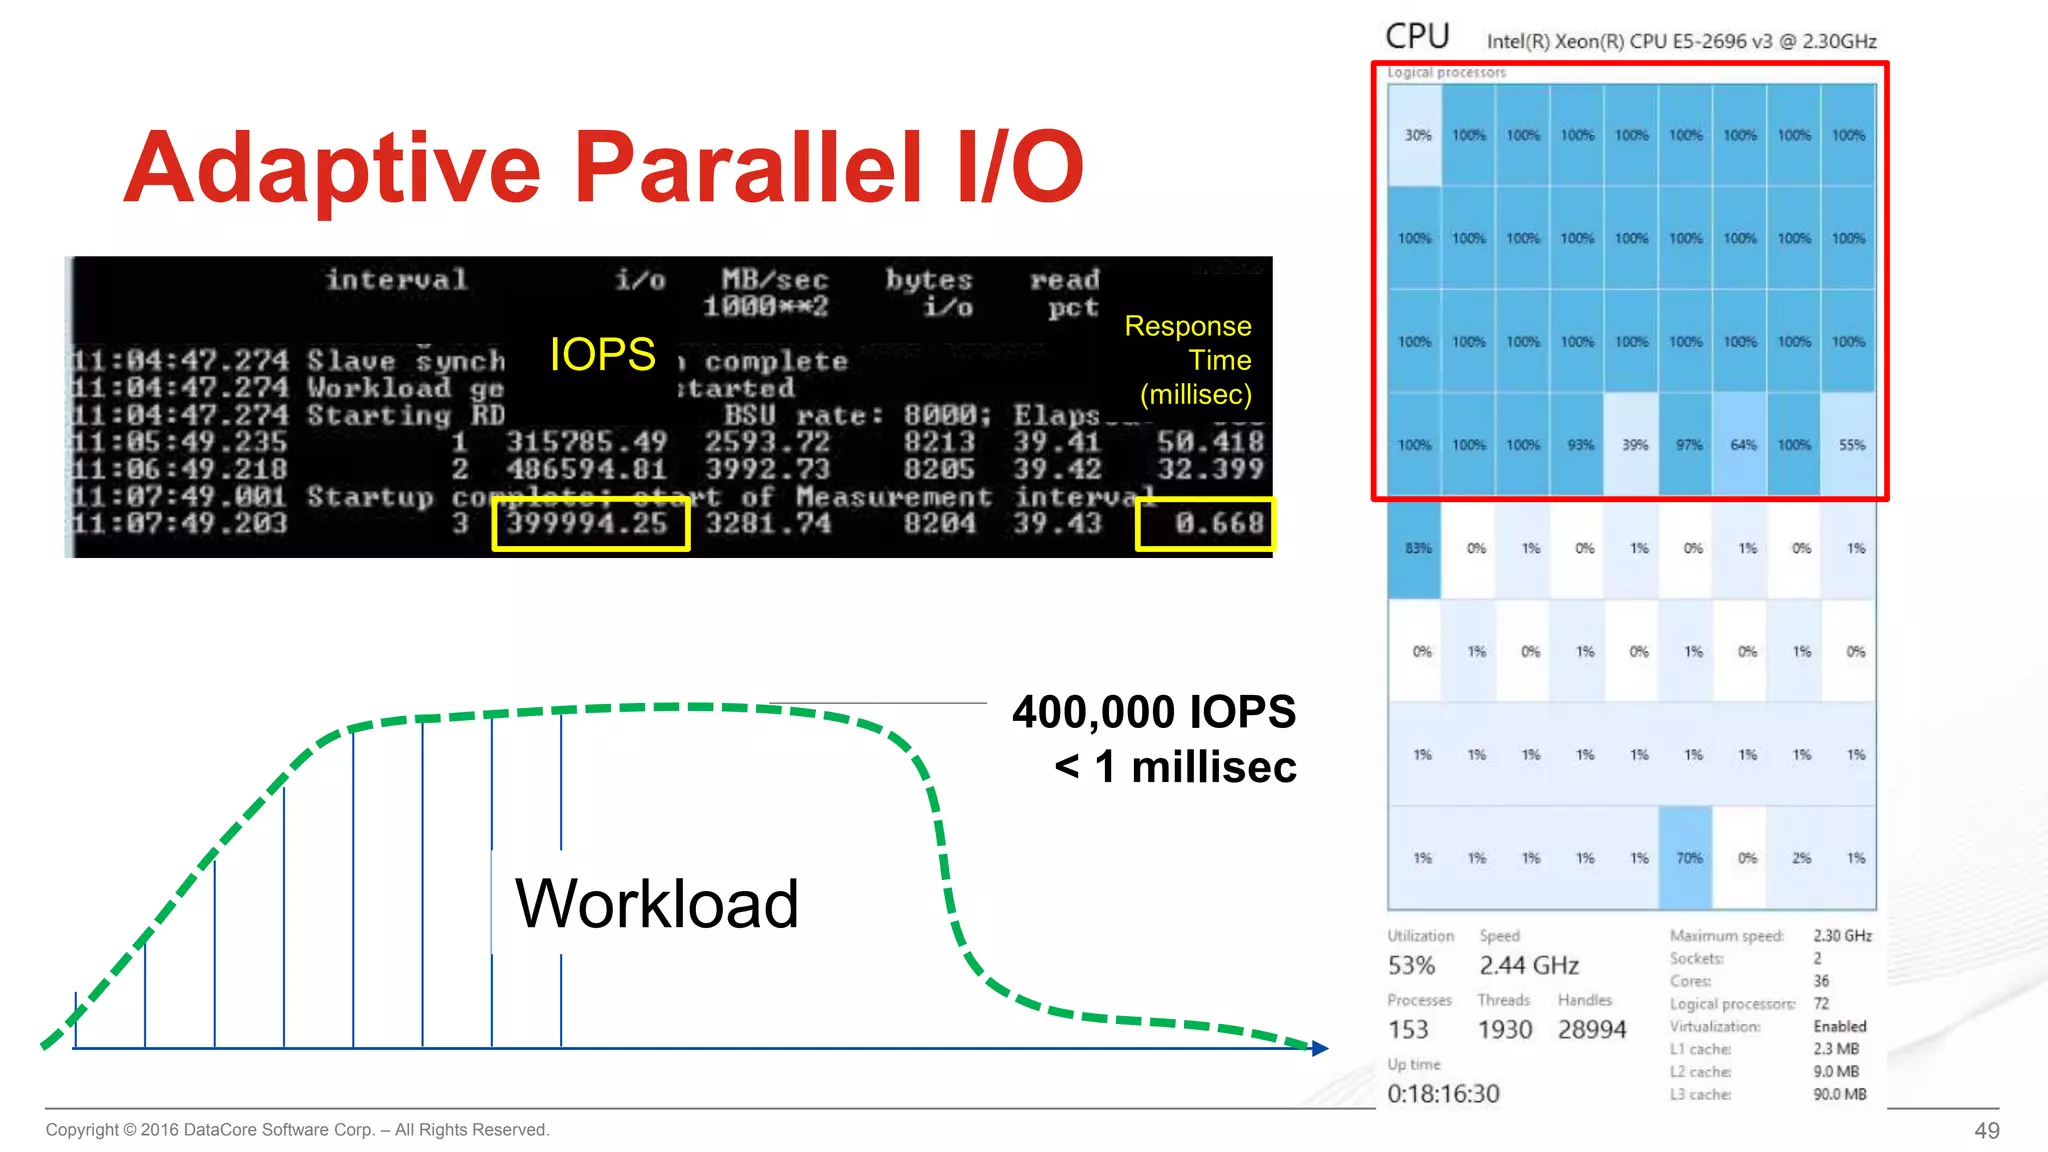
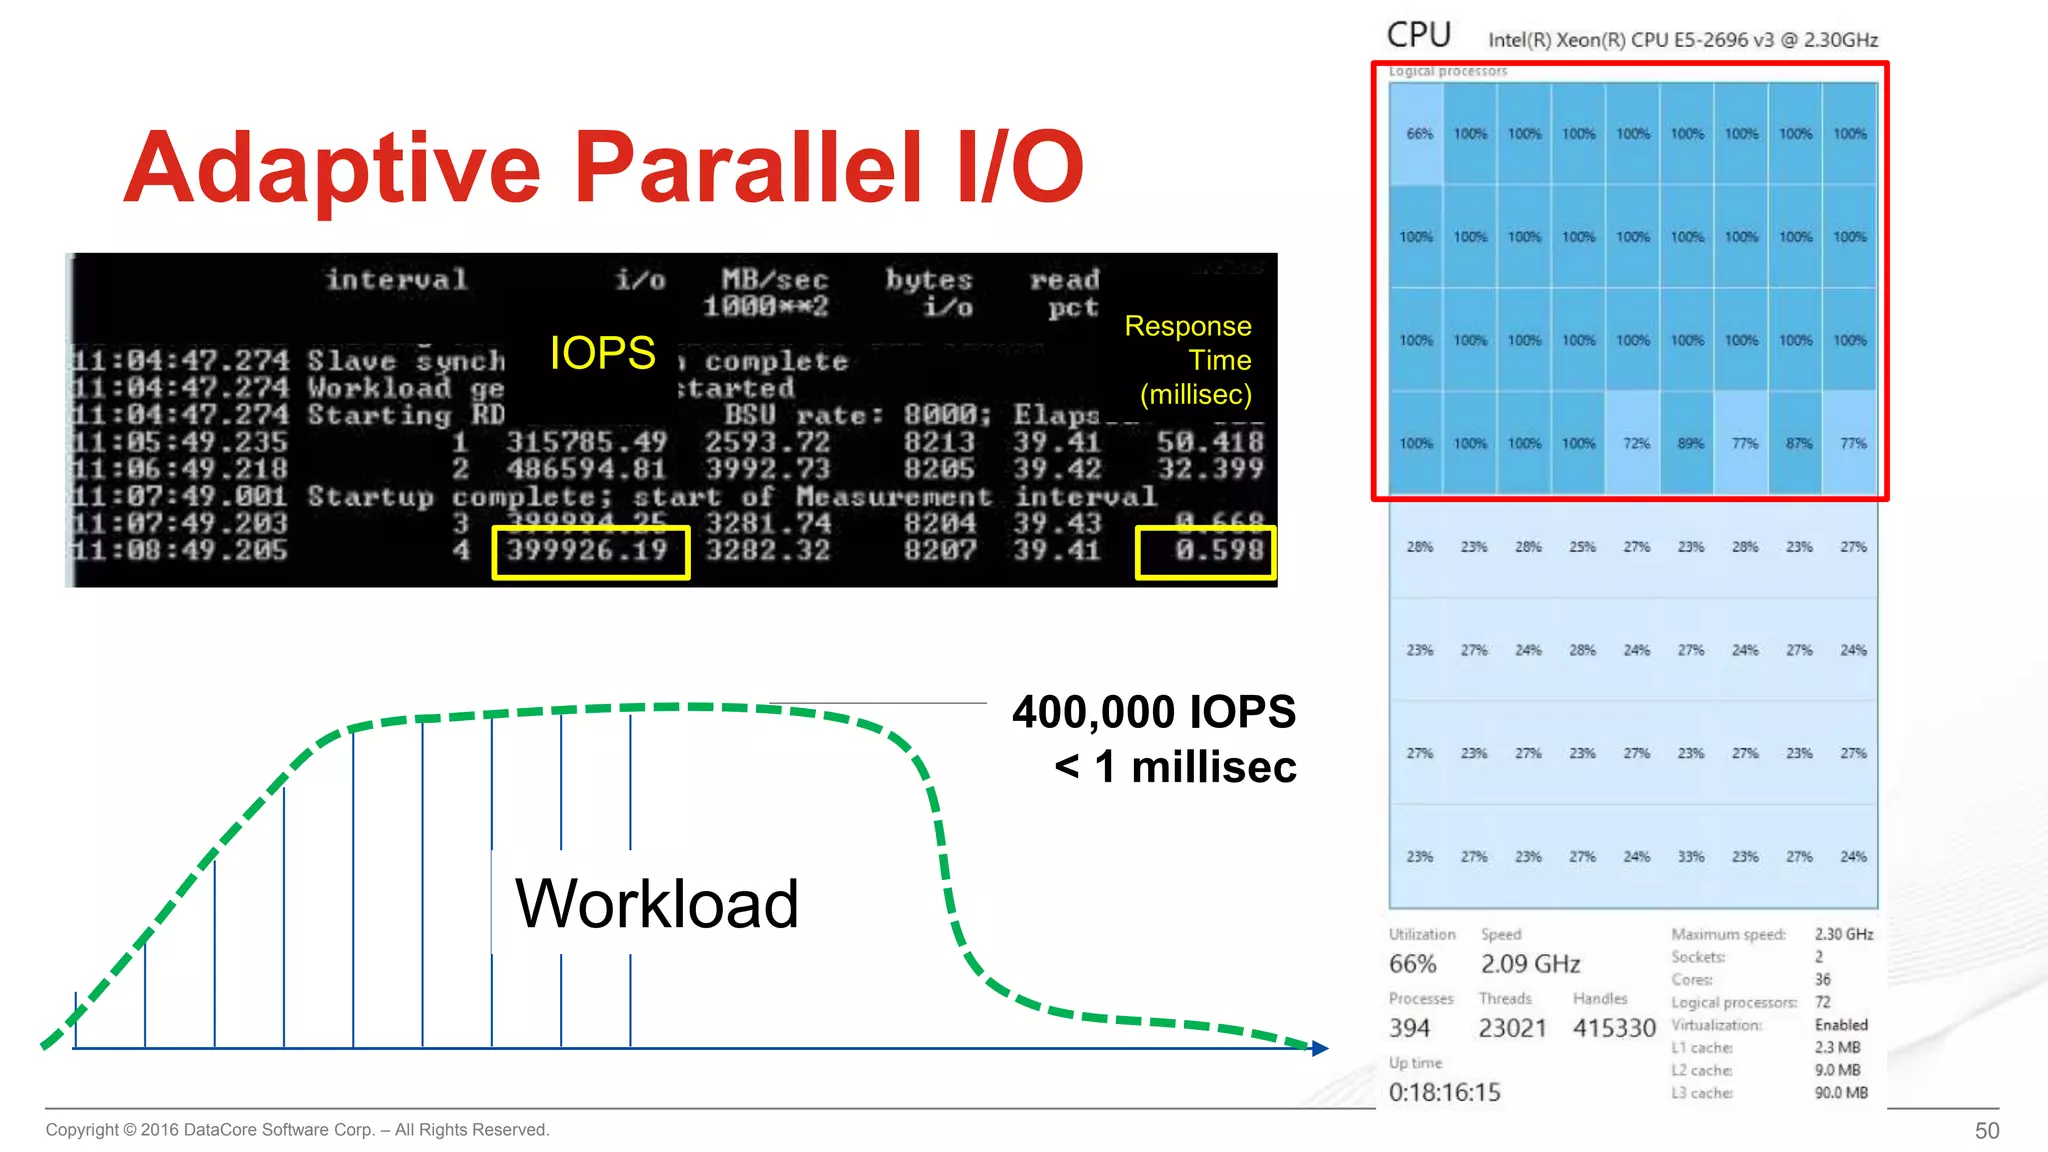
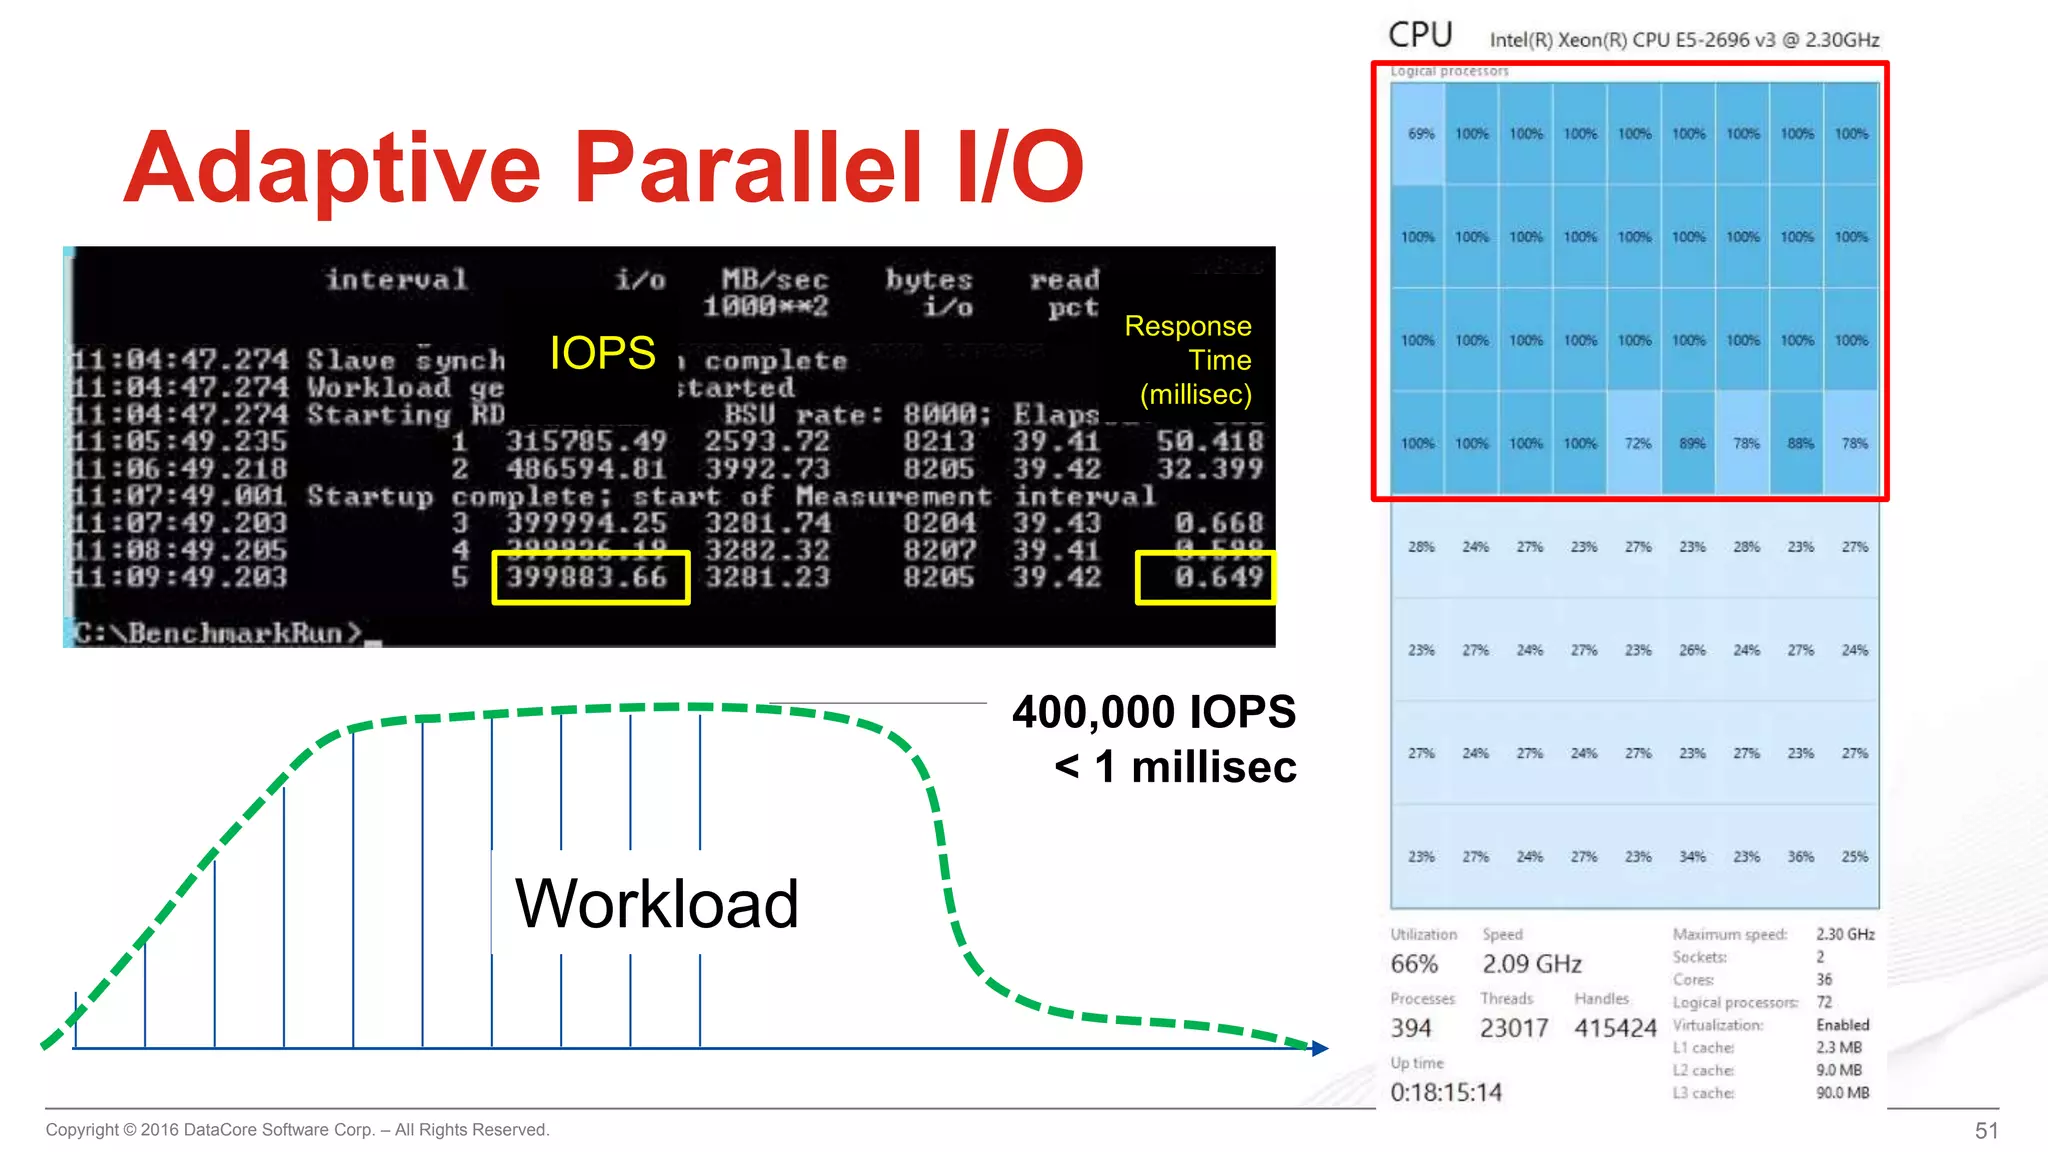
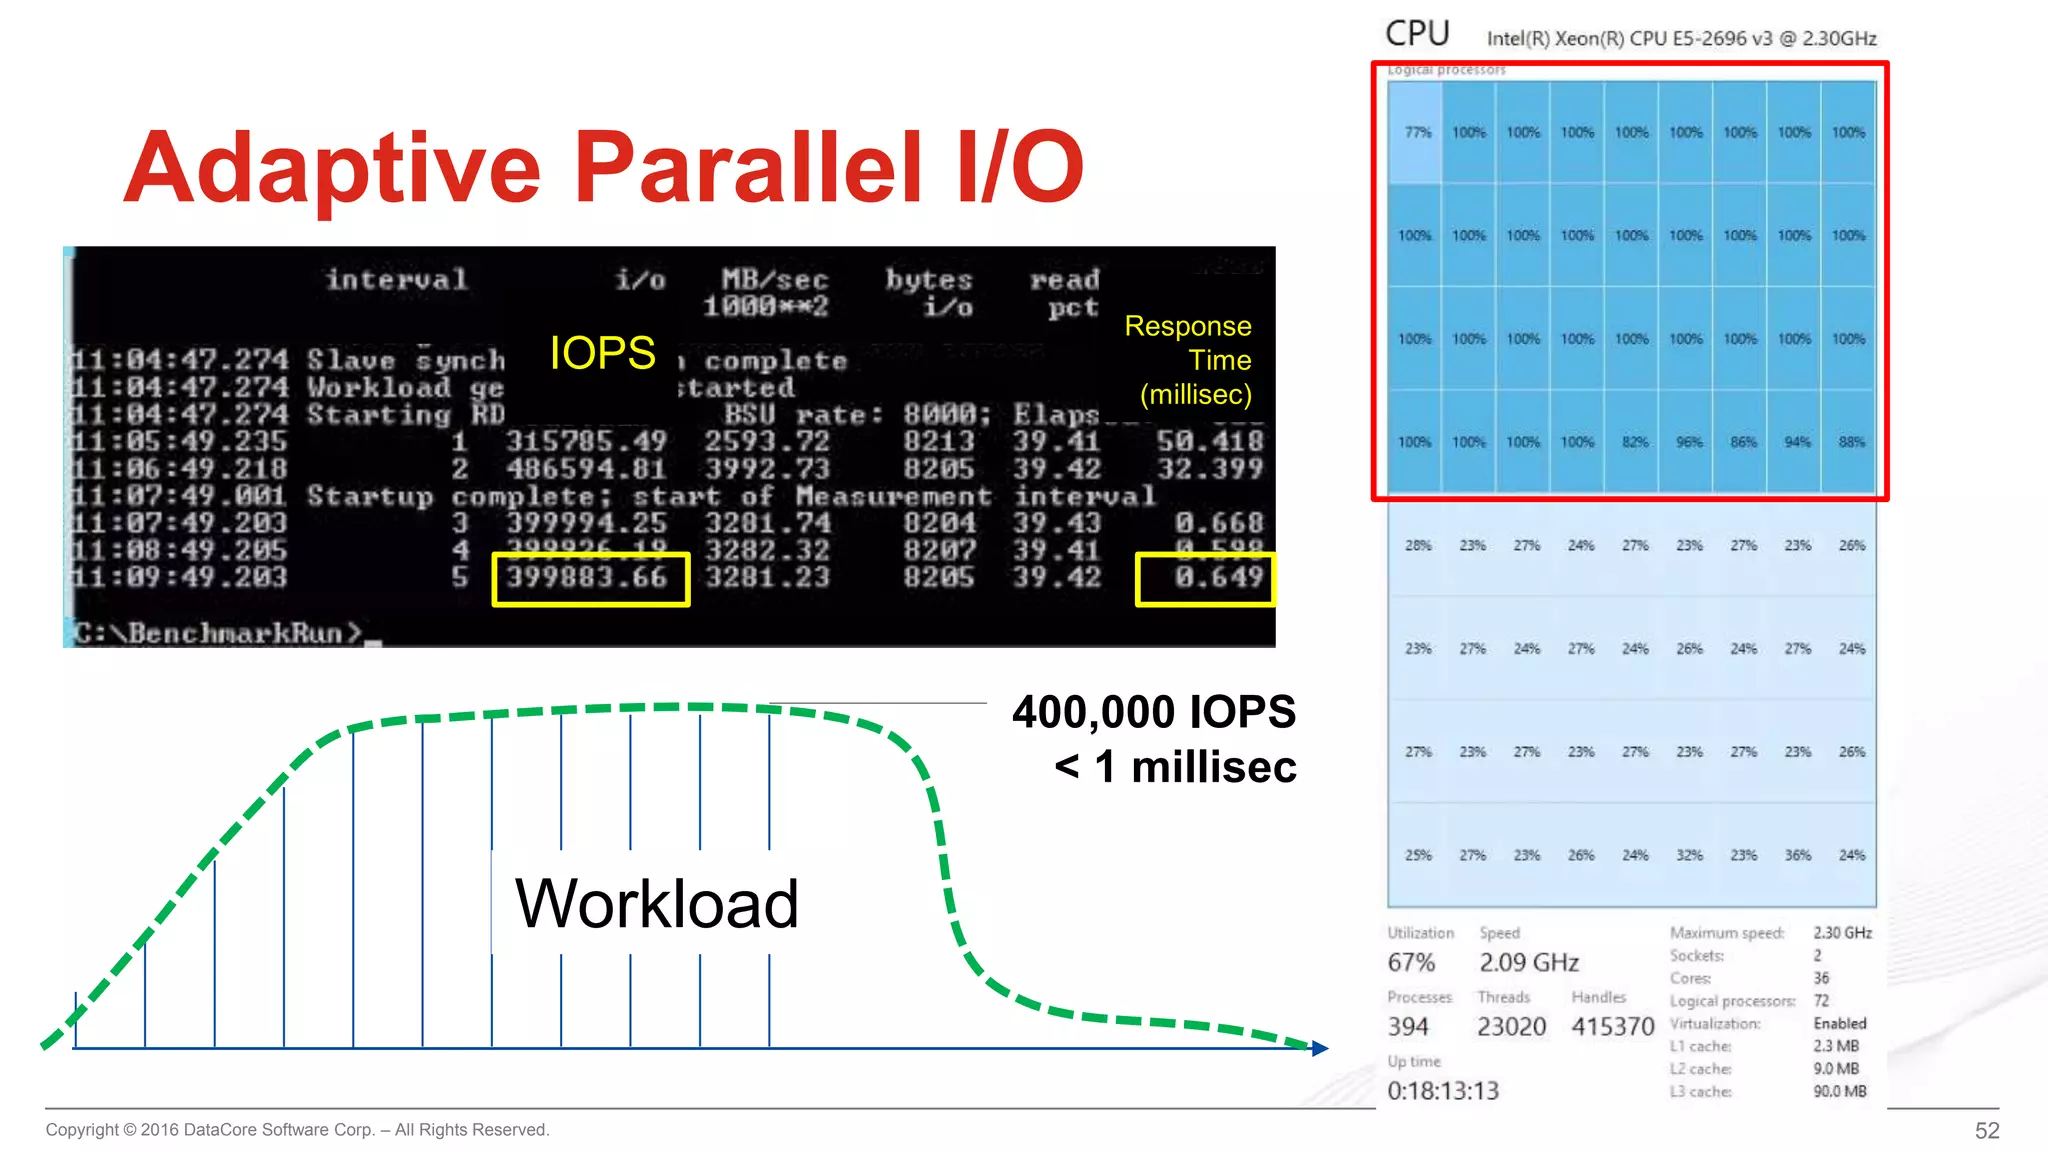
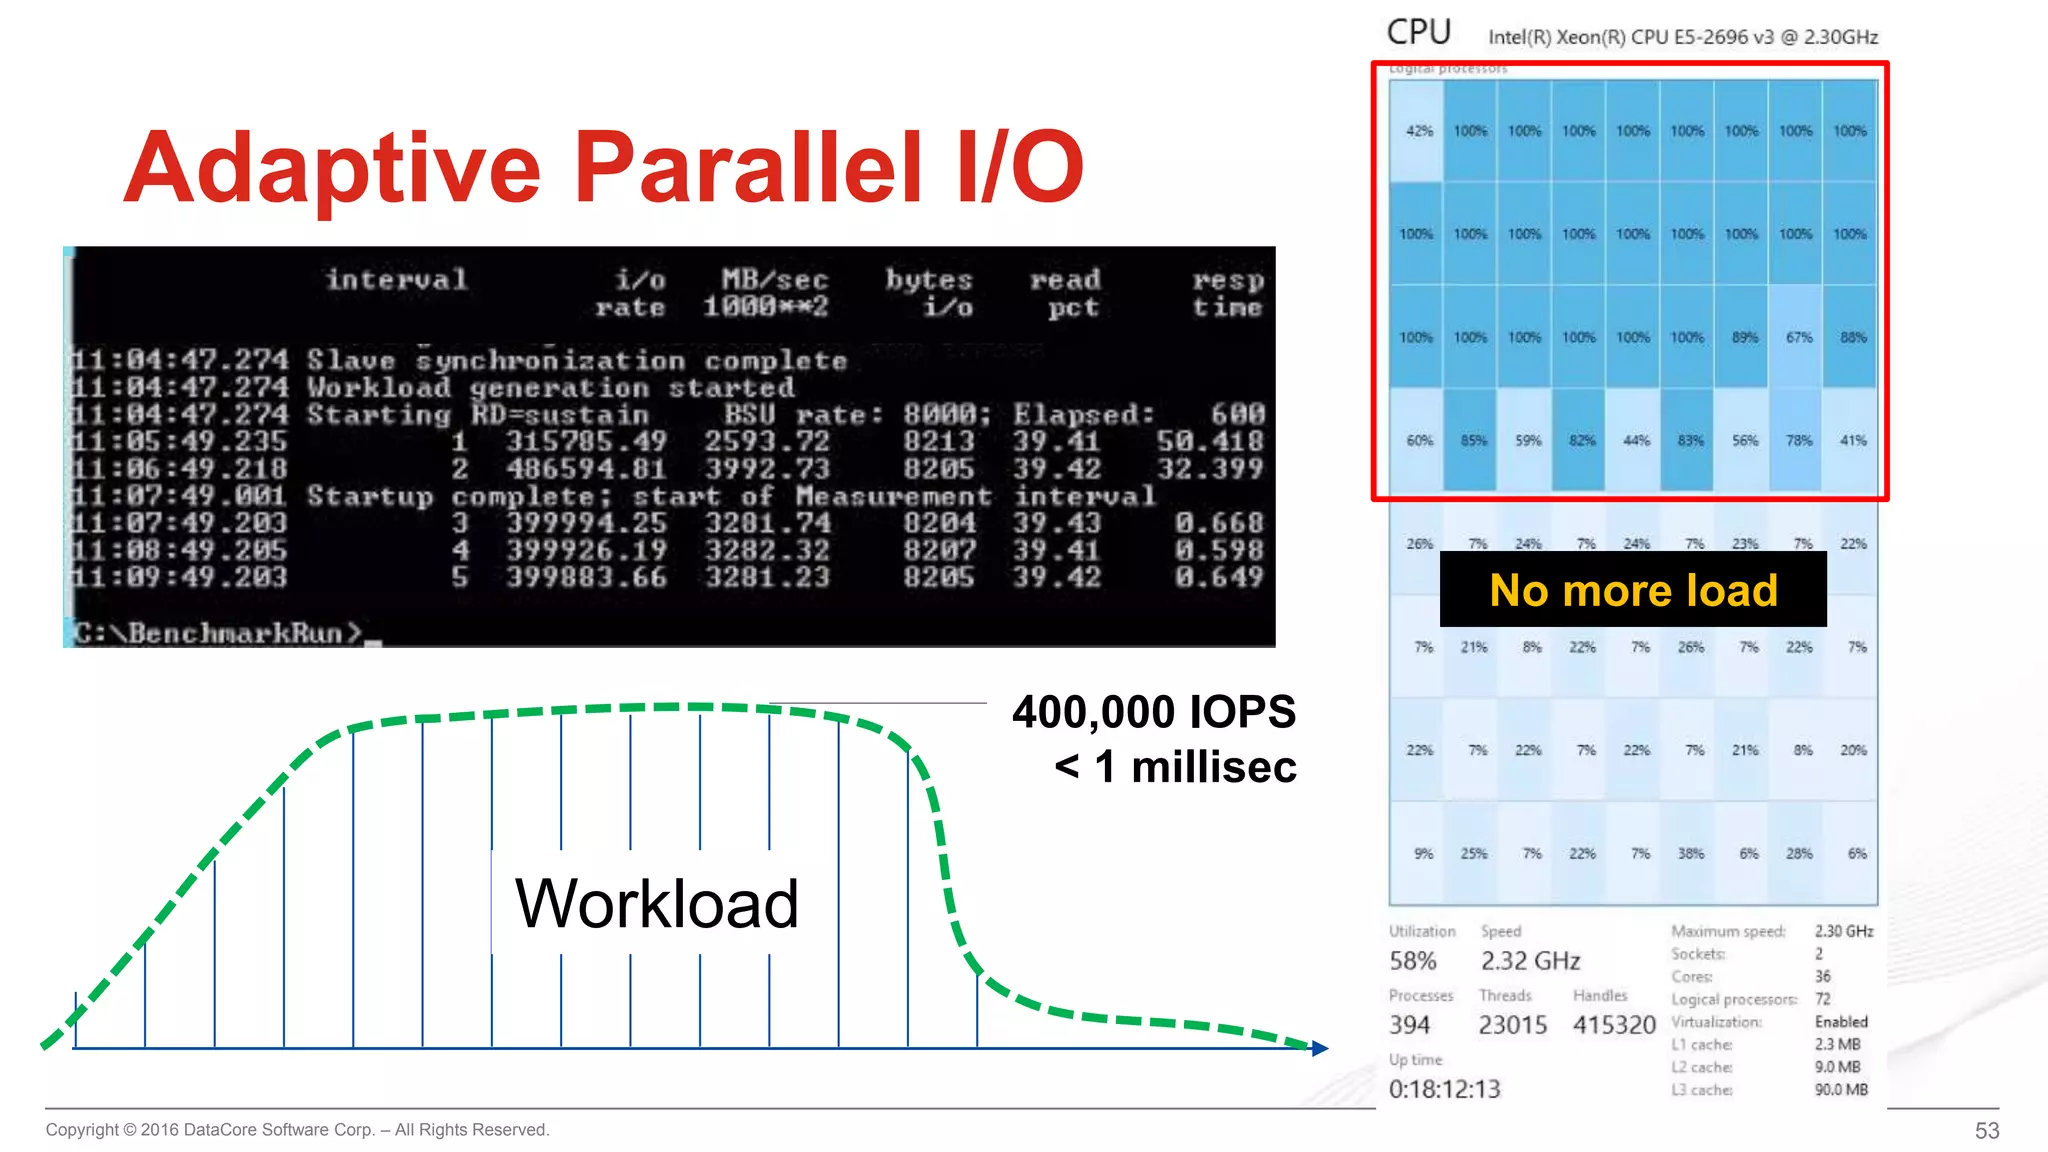
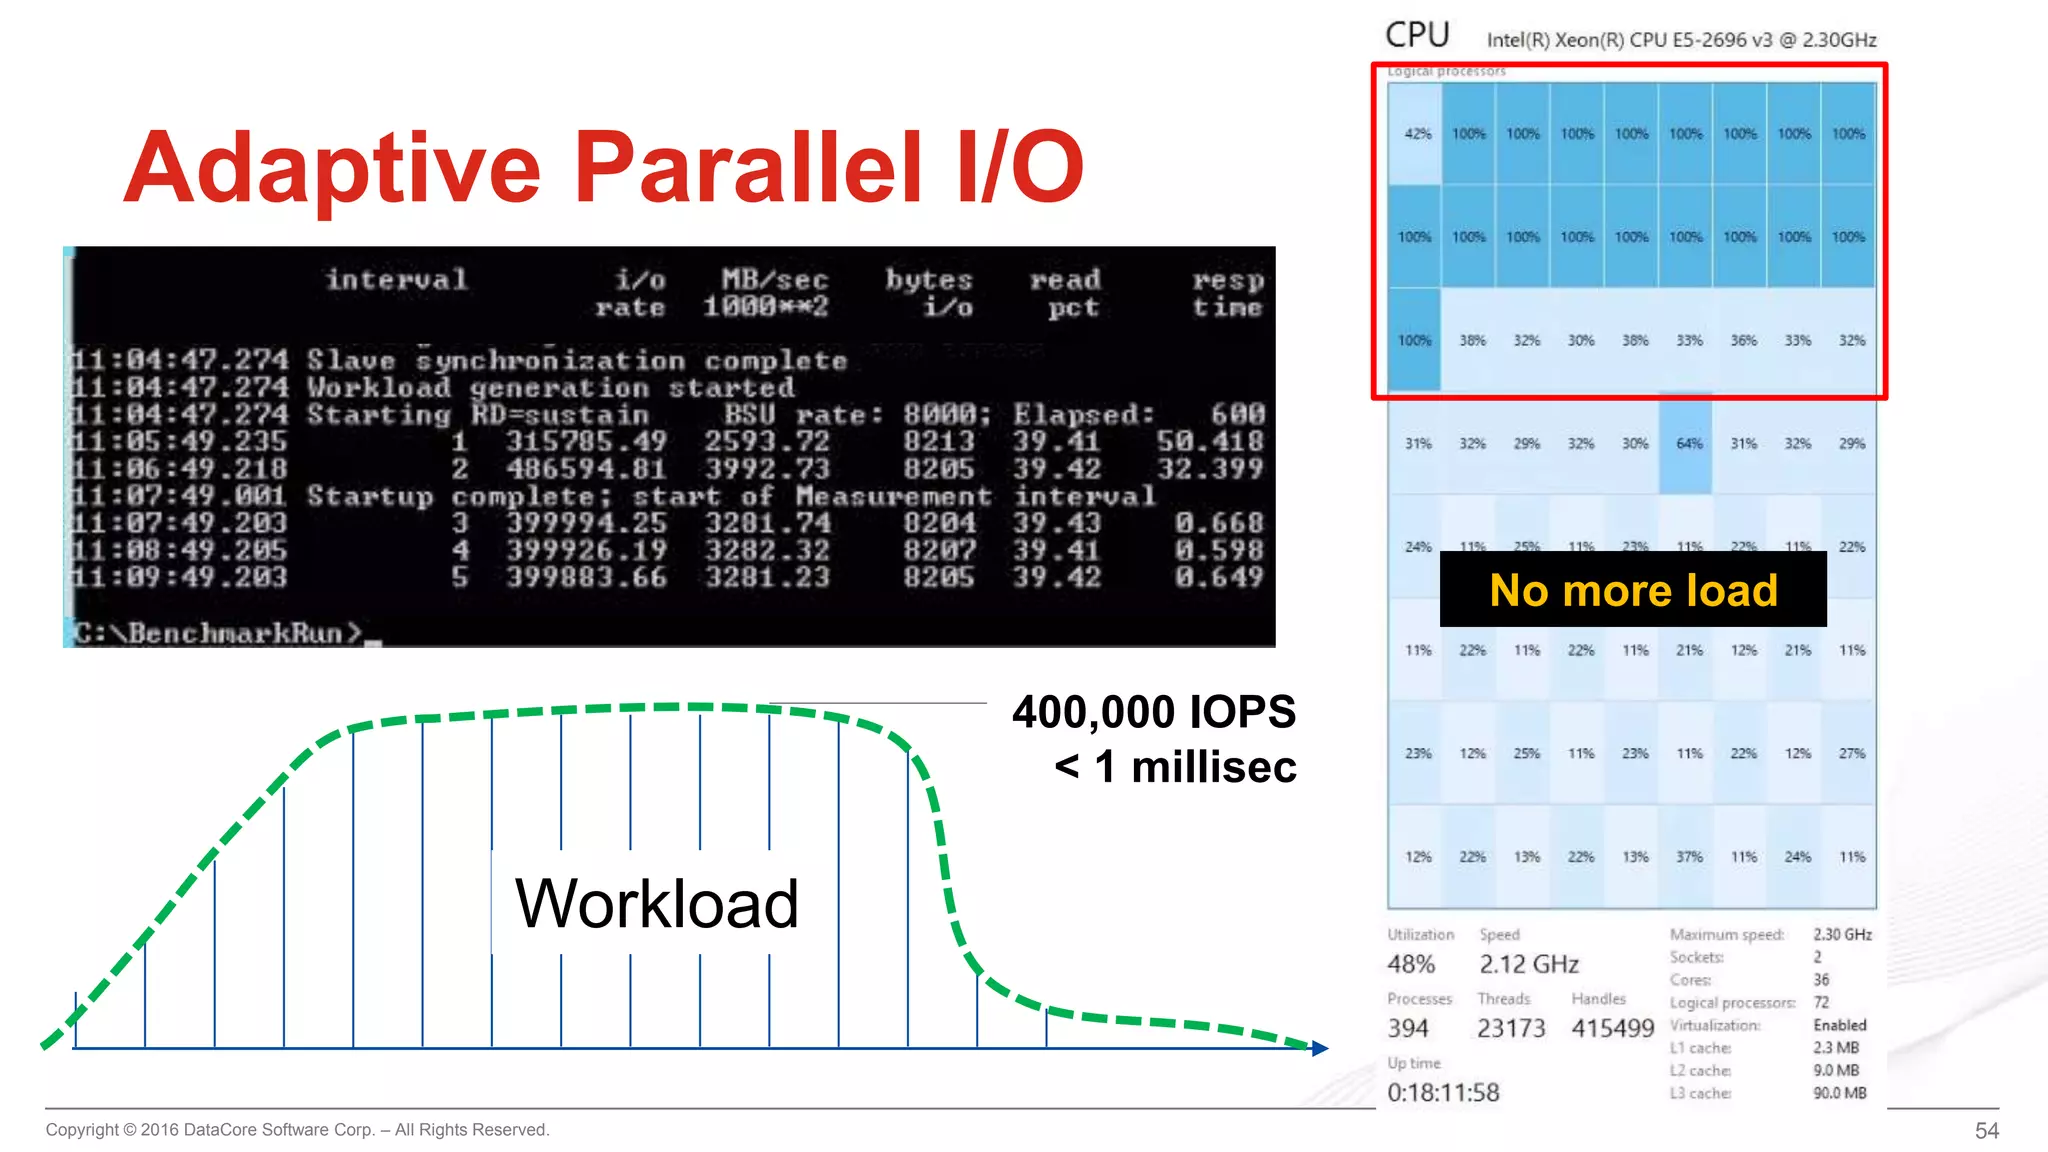

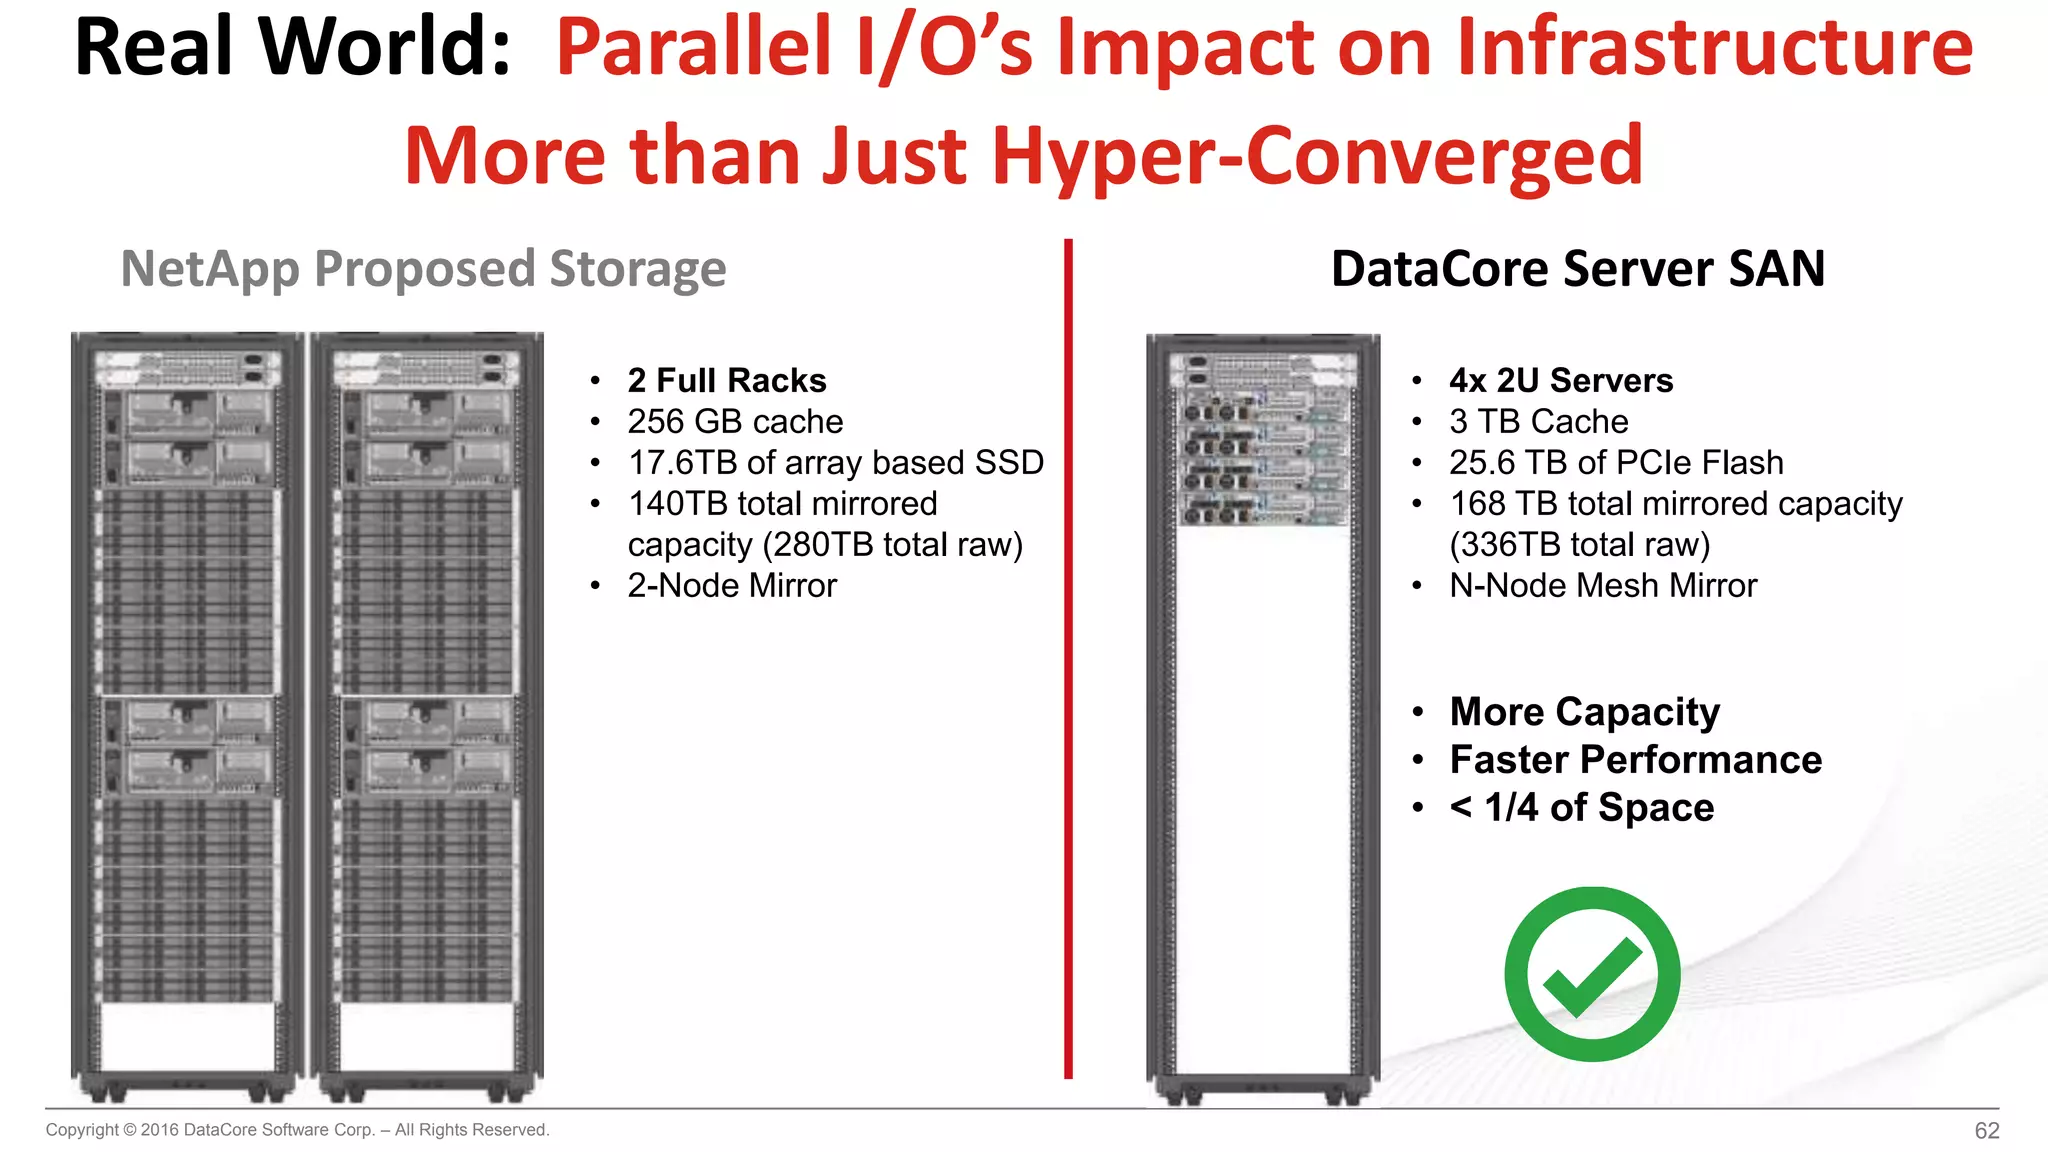
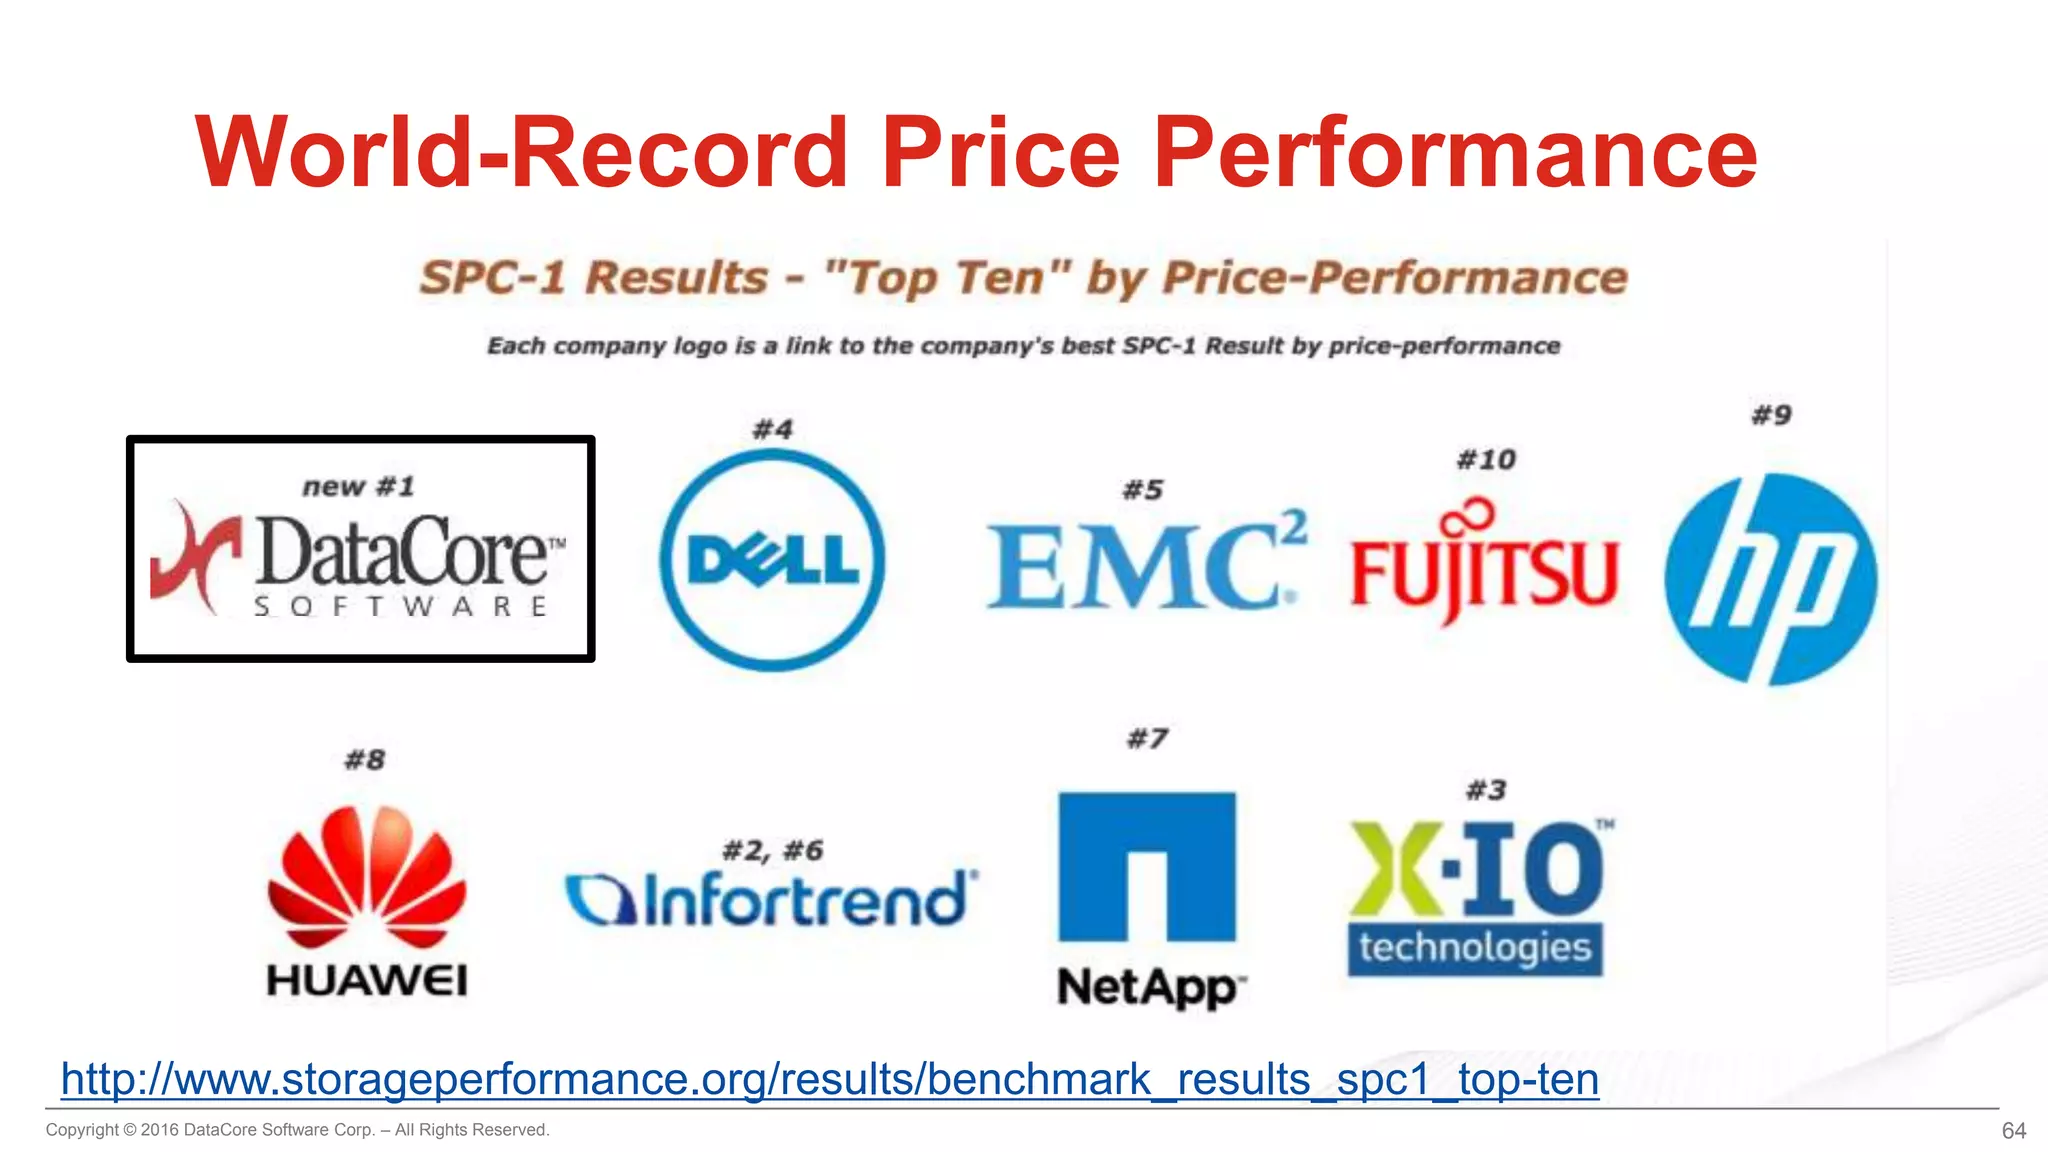

DataCore's parallel I/O technology significantly enhances application performance while reducing infrastructure costs, achieving a record price/performance ratio of $0.08 per SPC-1 IOPs and the fastest response time of 0.32 milliseconds. The technology allows for higher density of virtual machines and improved I/O performance, making it suitable for mission-critical workloads. Comparative analysis shows that DataCore outperforms major storage vendors in terms of price, performance, and latency.


