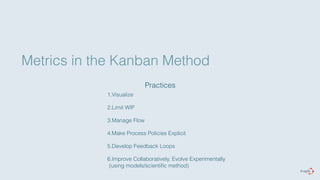
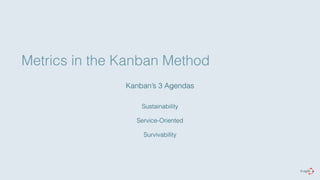
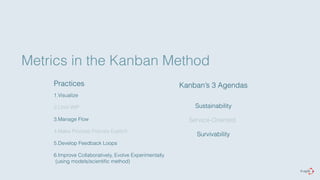
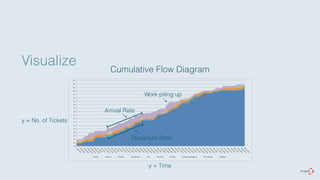
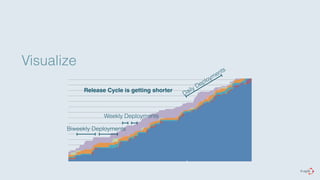
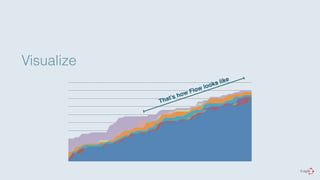
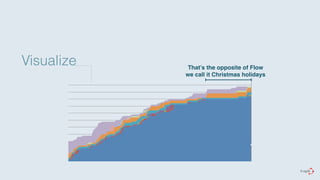
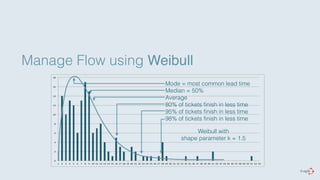
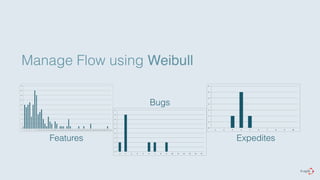
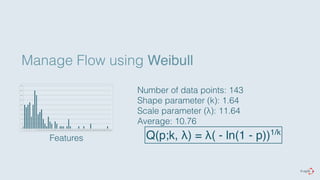
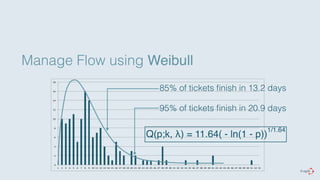
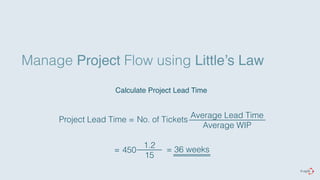
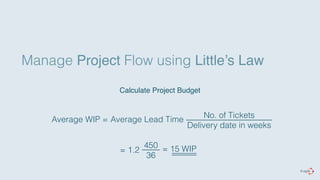
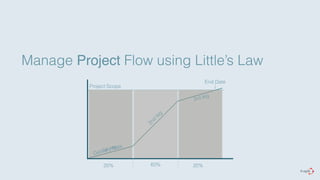
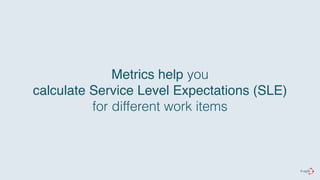
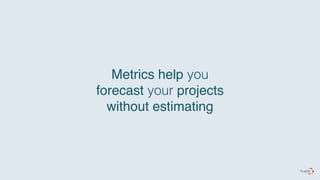
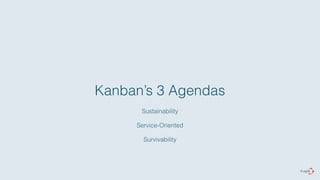
This document discusses the use of metrics in the Kanban method. It outlines Kanban's six core practices including visualizing workflow, limiting work-in-progress, managing flow, making process policies explicit, developing feedback loops, and improving collaboratively. Kanban's three agendas of sustainability, being service-oriented, and survivability are also discussed. The bulk of the document focuses on using various metrics to manage and visualize flow, calculate service level expectations, forecast project timelines, and support continuous improvement.
See how metrics can be used with your Kanban System for managing flow, your project and changes.
At least three practices of the Kanban Method imply the use of metrics. Metrics can be powerful tools. Sadly most kanban systems don’t make use of them and miss out on a big chance to make things easier. Metrics can help us with lots of different things we encounter in business like finishing projects on budget and on time, fighting for survival in the market, and continuous change to adapt in this complex world. Learn how metrics can help you and how to choose the right metric for your situation.
Kanban Metrics in practice for leading Continuous ImprovementMattia Battiston
Why should I bother collecting metrics? How can they help me? My CFD is pretty and colourful, but what is it actually trying to tell me?
CFD, control chart, lead time distribution, percentiles...Metrics can be daunting to start with but if you know how to interpret them they can drive continuous improvement and forecast the future and take your Kanban system to the next level! It’s much easier than you think, no need for complex maths or expensive software.
At Sky Network Services a few teams are using Kanban and metrics. In this talk I’ll share our experience: what metrics we use, how we use each one of them, what little data we collect to get a whole lot of value, what pitfalls we encountered.
Downloads
Powerpoint: https://goo.gl/4CkKJd
PDF: https://goo.gl/VDW93U
How to Predict Your Software Project's Probability of Successkevinjmireles
Ever wonder why your software projects are never delivered on time and budget? Then take five minutes to learn why and how to calculate the probability of your project's success within the estimated time and budget.
Seven Deadly Sins of Enterprise Software Development & What to do About Themkevinjmireles
Are you wondering why your IT modernization & Digital Transformation projects aren't proceeding as desired your adoption of agile, scrum & SAFe aren't delivering the results you hoped for?
This presentation will visually explain many of the challenges you face, in a way that even your boss and stakeholders can understand.
I'll show you:
1. How to explain why math prevents you from accurately estimating project timelines and are therefore never actually behind schedule.
2. The negative impacts of deadline-driven development and how to avoid them.
3. How to explain the difference between startup agile and enterprise agile, and what happens you confuse the two.
4. Why you need to design and architect for the 1% of your customers that drive 80% of your complexity and 50+% of your revenue.
5.The concept of minimum viable replacement and how to think about modernization/migration projects.
6. Why throwing away work is a good engineering practice and how it can save you money
7. How to avoid confusing in market with market ready.
Prioritization – 10 different techniques for optimizing what to start next ...Troy Magennis
10 different prioritization techniques to help understand what to START next. Shows the evolution between choosing at random up to full economic analysis. First presented at Agile 2017 in Florida.
Most teams need to answer questions like “When will it be done? What can I get by date X?”. However, common estimation approaches often fail to give us the predictability we want, and tend to introduce bad behaviours like hard deadlines and hiding uncertainty.
In this session, I’ll show you how, step by step and with real life examples, my team uses their historical data and metrics to forecast the future and answer these questions with confidence.
Download slides at: http://bit.ly/2pD9rfQ
Book discount link: http://leanpub.com/metricsforbusinessdecisions/c/MATTIA20-BZXib2F
Kanban Metrics in practice at Sky Network ServicesMattia Battiston
Why should I bother collecting metrics? How can they help me? My CFD is pretty and colourful, but what is it actually trying to tell me?
CFD, control chart, lead time distribution, percentiles...Metrics can be daunting to start with but if you know how to interpret them they can really take your Kanban system to the next level - drive continuous improvement and forecast the future! It’s much easier than you think, no need for complex maths or expensive software.
At Sky Network Services a few teams are using Kanban and metrics. In this talk I’ll share our experience: what metrics we use, how we use each one of them, what little data we collect to get a whole lot of value, what pitfalls we encountered.
Downloads
Powerpoint: https://goo.gl/19wOjU
PDF: https://goo.gl/AM69MF
Practical Agile Analytics: Reduce uncertainty and stop making such a big deal...Steven J. Peters, PhD
These slides focus on analyzing user story size estimates of and actual task hours scrum teams to gauge the uncertainty around those estimates. An approach is suggested for reducing uncertainty and improving user story size estimation accuracy.
Using SPC to Make Better Management DecisionsMark Graban
In this webinar (sponsored by Gemba Academy), Mark Graban, author of Lean Hospitals, will show how simple statistical process control (SPC) methods can be used by managers and leaders to make better decisions about their businesses.
Using examples from manufacturing, healthcare, and services industries, Mark will illustrate the basic SPC rules and will show you how to create and interpret a control chart, allowing you to spot statistically valid trends and avoid overreacting to common cause variation in your performance measures.
Please join us for a lively discussion and interactive Q&A!
http://www.MarkGraban.com
http://www.GembaAcademy.com
Planning is incredibly important for businesses to reduce risk and create value, but what happens when the plan is almost always wrong? Software development is inherently hard to plan, but there are some great Agile tools available to help us plan effectively. This brown bag explores some of these Scrum ceremonies and tools available in the Agile world.
Principles and Practices of Data VisualizationKianJazayeri1
"Principles of Data Visualization" by Asst. Prof. Dr. Kian Jazayeri offers a deep dive into effective data representation techniques. The presentation begins by underlining the importance of data visualization in revealing true data insights, avoiding errors, and facilitating knowledge sharing. It challenges the viewer to think beyond basic charts, highlighting that effective visualization requires sophisticated skills to accurately convey complex information.
The deck uses Anscombe's Quartet to illustrate the misleading nature of statistics without proper visual representation, showcasing how different data distributions can look when graphed, despite having identical statistical summaries. This example sets the stage for discussing the necessity of visual analysis to uncover the real story behind the data.
Art appreciation parallels are drawn to emphasize the importance of visual aesthetics in data visualization. By comparing renowned artworks, the slides suggest that, like art, data visualization requires a developed sense of design and aesthetics to communicate effectively and make an impact.
Edward Tufte's visualization principles are explored in depth, advocating for a high data-ink ratio, and warning against the lie factor—where the representation of data misleads more than it informs. The presentation also addresses chartjunk, encouraging the removal of unnecessary visual elements that do not add value to the data's understanding.
Dr. Jazayeri emphasizes graphical integrity, advising against scale distortion and advocating for accurate, clear labeling to maintain the data's true proportion and context. The concept of aspect ratios is discussed, advising a balance to avoid visual misrepresentation of trends.
Interactive elements within the slides engage viewers, prompting them to analyze different visualizations and understand how quickly and accurately data can be interpreted. This engagement highlights the "10-Second Rule," the idea that effective visualizations should allow quick and unambiguous data interpretation.
Color usage in data visualization is another focal point, with explanations on how different colors and their intensities can significantly affect data interpretation. Special attention is given to designing for color blindness, ensuring inclusivity in data communication.
Advanced topics include data maps, cartograms, scatter plots, and heatmaps, each discussed with their specific applications and potential for overplotting or misinterpretation. The presentation also critiques tabular data, suggesting improvements for clarity, comparison, and highlighting critical information.
Renowned works, like Minard's depiction of Napoleon's Russian campaign and Marey’s train schedule, are dissected to demonstrate how effective visual storytelling can enhance the comprehension of complex data narratives.
TQM QCC / SGA BY DURAISAMY R - M/s SHRISHTI CONSULTANTS CHENNAI ( www.shrisht...Duraisamy R
TOTAL QUALITY MANAGEMENT (TQM ), QUALITY CONTROL CIRCLES ( QCC ), SMALL GROUP ACTIVITIES ( SGA ), PROBLEM SOLVING TOOLS ( PST ), TOTAL EMPLOYEE INVOLVEMENT ( TEI ) MODEL,
No estimates - a controversial way to improve estimation with results-handoutsVasco Duarte
Often we hear that estimating a project is a must. "We can't make decisions without them" we hear often.
In this session I'll present examples of how we can predict a release date of a project without any estimates, only relying on easily available data.
I'll show how we can follow progress on a project at all times without having to rely on guesswork, and we will review how large, very large and small projects have already benefited from this in the past.
At the end of the session you will be ready to start your own
#NoEstimates journey.
In this webinar, Sageaworks presents some of the methodologies that institutions are most likely to use with CRE or commercial real estate pools under the CECL model. The recording is accessible here: http://web.sageworks.com/cecl-methodology-webinar-series/
Speak To The Business! Agile Metrics That Inform Rather Confuse the Businesstroytuttle
Given to PMI KC Professional Development Days 2014 Conference.
In this session, we will investigate the challenges with the popular Agile planning and reporting concepts like story points, planning poker, and average velocity. We will explore some practical alternative planning and reporting practices that the business can understand. And we will look at metrics that are less of an abstraction from reality and more actionable by teams and management.
The last couple of years have been full of discussions on how to scale agile methods. Frameworks promising to know the answer on how to scale are plenty, well known, and it feels like new frameworks keep entering the market on a monthly basis. Most, if not all come with a nice big picture showing managers how an (big) agile organizations needs to look like. They got it all wrong.
Creating an agile organization is not about introducing new titles and roles, not about cross-functional teams and especially not about trains. Agile organizations are about respecting people, delivering value to customers, and being able to constantly adapt to change. To achieve all this you need is stress, reflections mechanisms and leadership.
This talk will show you, how the Kanban method can help you to get exactly those three things to successfully foster an organization that is delivering value to their customers, is able to adapt to changes, while respecting its people and without turning everything upside down.
My Kanban introductory talk from Lean Kanban North America 2017, short LKNA17. Learn how Kanban is more than sticky notes on a wall. Learn how Kanban's 3 Agendas can help you to steer change in the right direction. Presented with help of the Kanbunny by it-agile.
As a trainer and coach I'm very often asked, if certain tools or practiced should be introduced. Well, I don't know as I don't know enough about the situation and the problem you want to solve. This is where 'brain on' mode comes into action.
Agile respectively Scrum offers a model to learn on an individual and group/team level. It misses methods to learn on an organizational level. The talk explains how tacit knowledge is transformed into explicit knowledge, what Ikujiro Nonaka's und Hirotaka Takeuchi's knowledge spiral is and how to get from an individual and team level learning to organizational learning
Eine kurze Einführung in das Agile Fluency™ Modell von Diana Larsen und James Shore. Der Vortrag erklärt das Modell, welche Praktiken zum erreichen der verschiedenen Stufen hilfreich sind und welche Investition nötig sind. Außerdem gehe ich kurz darauf ein, wie die Kanban Methode zum erreichen von 4-Sternen helfen kann.
Ein Vortrag über die Werte von Kanban. Der Vortrag erklärt Kanban anhand seiner Werte und gibt so eine etwas andere Art der Einführung. Grundlage ist das Buch "Kanban - Verstehen, einführen, anwenden" von Mike Burrows.
Why should I measure my changes and where should I start to do so? - LKNA14Wolfgang Wiedenroth
This talk tells you why you should measure the changes you do and gives you advice where to start. This talk has been a lightning talk at Lean Kanban North America 2014(LKNA14).
Opendatabay - Open Data Marketplace.pptxOpendatabay
Opendatabay.com unlocks the power of data for everyone. Open Data Marketplace fosters a collaborative hub for data enthusiasts to explore, share, and contribute to a vast collection of datasets.
First ever open hub for data enthusiasts to collaborate and innovate. A platform to explore, share, and contribute to a vast collection of datasets. Through robust quality control and innovative technologies like blockchain verification, opendatabay ensures the authenticity and reliability of datasets, empowering users to make data-driven decisions with confidence. Leverage cutting-edge AI technologies to enhance the data exploration, analysis, and discovery experience.
From intelligent search and recommendations to automated data productisation and quotation, Opendatabay AI-driven features streamline the data workflow. Finding the data you need shouldn't be a complex. Opendatabay simplifies the data acquisition process with an intuitive interface and robust search tools. Effortlessly explore, discover, and access the data you need, allowing you to focus on extracting valuable insights. Opendatabay breaks new ground with a dedicated, AI-generated, synthetic datasets.
Leverage these privacy-preserving datasets for training and testing AI models without compromising sensitive information. Opendatabay prioritizes transparency by providing detailed metadata, provenance information, and usage guidelines for each dataset, ensuring users have a comprehensive understanding of the data they're working with. By leveraging a powerful combination of distributed ledger technology and rigorous third-party audits Opendatabay ensures the authenticity and reliability of every dataset. Security is at the core of Opendatabay. Marketplace implements stringent security measures, including encryption, access controls, and regular vulnerability assessments, to safeguard your data and protect your privacy.
Levelwise PageRank with Loop-Based Dead End Handling Strategy : SHORT REPORT ...Subhajit Sahu
Abstract — Levelwise PageRank is an alternative method of PageRank computation which decomposes the input graph into a directed acyclic block-graph of strongly connected components, and processes them in topological order, one level at a time. This enables calculation for ranks in a distributed fashion without per-iteration communication, unlike the standard method where all vertices are processed in each iteration. It however comes with a precondition of the absence of dead ends in the input graph. Here, the native non-distributed performance of Levelwise PageRank was compared against Monolithic PageRank on a CPU as well as a GPU. To ensure a fair comparison, Monolithic PageRank was also performed on a graph where vertices were split by components. Results indicate that Levelwise PageRank is about as fast as Monolithic PageRank on the CPU, but quite a bit slower on the GPU. Slowdown on the GPU is likely caused by a large submission of small workloads, and expected to be non-issue when the computation is performed on massive graphs.
Chatty Kathy - UNC Bootcamp Final Project Presentation - Final Version - 5.23...John Andrews
SlideShare Description for "Chatty Kathy - UNC Bootcamp Final Project Presentation"
Title: Chatty Kathy: Enhancing Physical Activity Among Older Adults
Description:
Discover how Chatty Kathy, an innovative project developed at the UNC Bootcamp, aims to tackle the challenge of low physical activity among older adults. Our AI-driven solution uses peer interaction to boost and sustain exercise levels, significantly improving health outcomes. This presentation covers our problem statement, the rationale behind Chatty Kathy, synthetic data and persona creation, model performance metrics, a visual demonstration of the project, and potential future developments. Join us for an insightful Q&A session to explore the potential of this groundbreaking project.
Project Team: Jay Requarth, Jana Avery, John Andrews, Dr. Dick Davis II, Nee Buntoum, Nam Yeongjin & Mat Nicholas
9. Visualize
20"
19"
18"
17"
16"
15"
14"
13"
12"
11"
10"
9"
8"
7"
6"
5"
4"
3"
2"
1"
0"
Lead Time Distribution Chart
Average Lead Time
1" 2" 3" 4" 5" 6" 7" 8" 9" 10"11"12"13"14"15"16"17"18"19"20"21"22"23"24"25"26"27"28"29"30"31"32"33"34"35"36"37"38"39"40"41"42"43"44"45"46"47"48"49"50"51"52"53"54"55"56"57"58"59"60"61"62"63"64"65"66"67"68"69"70"
y = No. of Tickets finished
with lead time x
x = Lead Time
19. Manage Flow
Demand Analysis Capability Analysis
How much
demand do
we have?
What are the
sources of our
demand?
Do we have
seasonal
variance in
demand?
What are the risk profiles
that are attached to
different types of work?
What skills are
required for different
types of demand?
What are our
current lead times?
What is our
delivery rate?
What skills do
we have?
25. Manage Flow using Weibull
5"
4"
4"
3"
3"
2"
2"
1"
1"
0"
1" 2" 3" 4" 5" 6" 7" 8" 9" 10" 11" 12" 13" 14" 15"
Bugs
Number of data points: 8
Shape parameter:
Scale parameter:
Average: 3.88
not enough data points,
but visualisation gives us
an idea of the shape
26. Manage Flow using Weibull
5"
4"
4"
3"
3"
2"
2"
1"
1"
0"
1" 2" 3" 4" 5" 6" 7" 8" 9" 10" 11" 12" 13" 14" 15"
Bugs
Number of data points: 8
Shape parameter: looks like between 1.25 and 1.50
Scale parameter:
Average: 3.88
27. Manage Flow using Weibull and Forecasting Cards
k = 0.75
k = 1.25
k = 1.50
29. Manage Flow using Weibull and Forecasting Cards
5"
4"
4"
3"
3"
2"
2"
1"
1"
0"
98% of tickets finish in
12.4 days
1" 2" 3" 4" 5" 6" 7" 8" 9" 10" 11" 12" 13" 14" 15"
30. Manage Flow using Weibull
Service Level Expectations (SLE) we can communicate
85% of all features can be expected in 13 days
Bugs can be expected to be delivered in between
3 (average) and 12 days (98%)
31. Manage Project Flow
Project Scope
Average Lead Time
Average Throughput
Average WIP
33. Manage Project Flow using Little’s Law
Calculate Project Lead Time
Project Lead Time = No. of Tickets
Average Lead Time
Average WIP
= 450
1.2
15
= 36 weeks
34. Manage Project Flow using Little’s Law
Calculate Project Budget
Average WIP = Average Lead Time
No. of Tickets
Delivery date in weeks
= 1.2
450
36
= 15 WIP
35. Manage Project Flow using Little’s Law
Project Scope
20% 60% 20%
End Date
2nd leg
1st leg
3rd leg
Delivery Rate
36. Metrics help you
to better understand your
demand and capability
37. Metrics help you
calculate Service Level Expectations (SLE)
for different work items
42. Survivability
What’s the purpose of the services we provide?
What criteria need to be satisfied
to call the service fit for this purpose?
43. Survivability
“Fitness Criteria are metrics that measure things
customer value when selecting a service again and
again.”
- Delivery Time
- Quality
- Predictiability
- Safety (or conformance to regulatory requirements
David J. Anderson
44. Survivability
Bugs per Week
60
45
30
15
0
31 32 33 34
SLA Compliance in %
100
75
50
25
0
April May June July
Lead Times
20
15
10
5
0
0 5 10 15 20
45. Ask your customer
what they care about!
Make it your core metric#
you always measure!
52. Metrics for improvements
"Sometimes, you just have to roll
back with your chair to take a
second look from the back and
make a good guess how the curve
will end up."
- Troy Magennis at LKCE13 reception
53. Metrics for improvements
"We do only this until we have
enough data to provide better
sample."
- Troy Magennis at LKCE13 reception
55. Metrics for improvements
WIP limit breach
defect rate
customer
satisfaction
employee
satisfaction
number of
blockers
time spent on “real
quick” work
time tickets were
blocked
time waiting for external
suppliers
rework
time spent on
white noise
…
57. Bob from Operations
Wanted Y
Took me 60min
#
Urheber Markus Beyer - Herzlichen Dank!
Joe from Marketing
Wanted Y
Took me 30min
Sue from Product
Wanted Y
Took me 15min
CEO
Wanted Y
Took me 6h
Joe from Marketing
Wanted Y
Took me 45min
59. chindōgu are sometimes described
as "unuseless" – that is, they
cannot be regarded as "useless" in
an absolute sense, since they do
actually solve a problem; however,
in practical terms, they cannot
positively be called "useful".
https://en.wikipedia.org/wiki/Chind%C5%8Dgu
60. to check if your service
is fit for purpose
Metrics help you
to evaluate your
changes
to manage your
projects
to manage Flow
61. to check if your service
is fit for purpose
Collect metrics now
to evaluate your
changes
to manage your
projects
to manage Flow
62. Thank you!
Wolfgang Wiedenroth
Mail: wolfgang.wiedenroth@it-agile.de
Twitter: @wwiedenroth