Download to read offline

![Megha S.Kamdi et al. Int. Journal of Engineering Research and Application www.ijera.com
Vol. 3, Issue 5, Sep-Oct 2013, pp.425-429
www.ijera.com 427 | P a g e
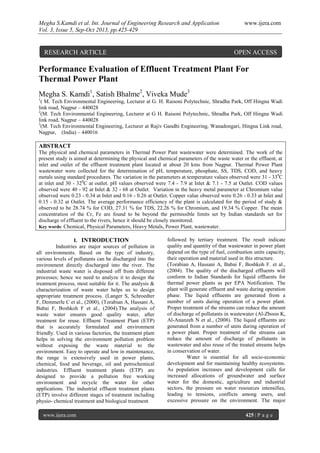
wastewater samples were collected during the period
of the study that lasted from August 2011 to Apr 2012.
(Joseph C. Akan, Ph. et al., 2006) All samples were
analyzed in G.H.Raisoni College/Environmental
Engineering laboratory. The procedures of the Water
and Wastewater Standards Methods were used for the
analysis of the samples [IS 3025-1984].Table 2.1
Present the analysis of ETP parameter for thermal
power plant.
Table 2.1 Parameter used for the analysis of ETP
for Thermal Power Plant [IS 3025-1984].
Parameter Concentration
Temperature 33°C
pH 6.5-8.5
C.O.D 250 mg/l
Total Dissolved Solid 2000 mg/l
Suspended Solid 100 mg/l
Phosphate 5.0 mg/l
Chromium 0.2 mg/l
Copper 0.2 mg/l
Iron 1.0 mg/l
Zinc 1.0 mg/l
2.2 Determination of Physical &Chemical
Properties
Temperature & pH were determined using a
pH meter; while the levels of total dissolved solid
(TDS) were determined by using conductivity meter at
the point of sample collections. Chemical Oxygen
Demand (COD) was determined using closed reflux
method.
COD mg/l= (A-B) N X 8000
V
Where,
A= Volume in ml. Ferrous ammonium sulphate for
blank
B= Volume in ml. Ferrous ammonium sulphate for
Sample
V= Volume of Sample
N=Normality of ferrous ammonium sulphate
Suspended Solid (SS), 100ml of the wastewater
samples were filtered through a pre weighed filtered
paper. The filtered papers were dried at 103-105°C.
TDS & SS was determined by using the following
Formula;
TDS (mg/l) = mg of residue X 1000
Ml sample
2.3 Determination of Heavy Metals in Wastewater
Samples
Wastewater samples were taken from thermal
power plant in August 2011.The wastewater
originating from different dissolved heavy metals
particularly PO4, Cu, Fe, Zn and Cr. Release of heavy
metals from this wastewater into the environment will
have potentially negative impacts on soil, groundwater
and surface water quality as well as human health. .
(Saeedi M, et al., 2006)
3.0 RESULTS & DISCUSSIONS
1) pH
7.4
7.6
7.5
7.6
7.5
7.4
7.6
7.4
7.8
7.6
7.9
7.8
7.5
7.6 7.6
7.4
7.5
7.2
7.3 7.3
7.2 7.2 7.2
7.3
7.1
7.4
7.2
7.5
7.3
7.2
7.5
7.2
7.1
7.2
6.60
6.80
7.00
7.20
7.40
7.60
7.80
8.00
1stweek(Aug)
3rdweek(Aug)
1stweek(Sep)
3rdweek(Sep)
1stweek(Oct)
3rdweek(Oct)
1stweek(Nov)
3rdweek(Nov)
1stweek(Dec)
3rdweek(Dec)
1stweek(Jan)
3rdweek(Jan)
1stweek(Feb)
3rdweek(Feb)
1stweek(Mar)
3rdweek(Mar)
1stweek(Apr)
pH
WeekINLET OUTLET
BAR CHART FOR-pH(Aug-Apr)
Fig.1 Shows Variation in pH from Inlet and Outlet
of ETP
2) CHEMICAL OXYGEN DEMAND
BAR CHART FOR-COD(Aug-Apr)
Fig.2 Shows Variation in COD from Inlet and
Outle
3) TOTAL DISSOLVED SOLID
BAR CHART FOR-TDS(Aug-Apr)
Fig.3 Shows Variation in TDS from Inlet and
Outlet of ETP](https://image.slidesharecdn.com/bw35425429-130927232618-phpapp02/85/Bw35425429-3-320.jpg)

![Megha S.Kamdi et al. Int. Journal of Engineering Research and Application www.ijera.com
Vol. 3, Issue 5, Sep-Oct 2013, pp.425-429
www.ijera.com 429 | P a g e
wastewater was higher than the Indian standard for the
discharge of wastewater into river.
III. CONCLUSION
The pH, COD removal efficiency was
observed to be 8%, 55% respectively. & Heavy metals
PO4, Cr removal efficiency was observed to be 37%,
41% respectively. The waste water flow from the
processing unit is highly fluctuating. The treated water
at ETP is used for various purposes such as gardening,
cleaning, fly ash and bottom ash removal. This
reduces the specific water consumption of the plant
and thus reduces the generation cost as well.
REFERENCES
[1] Saeedi M, Amini H. R (2003)
“Characterization of a thermal power plant
air heater washing waste: a case study from
Iran” Vol 78(3), PP.654-665
[2] Leo, P.P. ; Rossoff, J. ( 2003) “Control of
waste and water pollution from power plant
flue gas cleaning system” Vol 87(3), PP.456-
468 “Journal of power sources”
[3] Zhang Jinjiang, Wang Shaohua. (2009)
“Determination of carbonate in water from
thermal power plant”. “Journal of
Quantitative Spectroscopy and Radioactive
Transfer” (Anshan Thermal Power New
Materials Co. Ltd., Anshan114012, China)
Vol 23(9), PP.345-350
[4] Saeedi, M.*, Amini, H.R.(2007) “Chemical,
Physical, Mineralogical, Morphology and
Leaching Characteristics of a Thermal Power
Plant Air Heater Washing Waste” Int. J.
Environ. Res. 1 (1): 74-79
[5] Saeedi M, Amini H (2009). “Stabilization of
heavy metals in wastewater treatment sludge
from power plants air heater washing “Waste
Manag. Res. 27(3): 274-280.
[6] Torabian A, Hassani A, Babai F, Boshkoh F
(2004). IRAN Thermal Power Plants
Chemical Wastewater Treatment, J. Environ.
Sci.
[7] Mohsen MS (2004) “Treatment and reuse of
industrial effluents: Case study of a thermal
power plant, Desalination” 167 (2004): 75–
86.
[8] Jae-Bong L, Kwang-Kyu P, Hee-Moon E,
Chi-Woo L (2006). “Desalination of a
thermal power plant wastewater by
membrane capacitive deionization,
Desalination” 196(1-3)5: 125-134.
[9] Langer S, Schroedter F, Demmerle C (2000).
Wastewater treatment and reuse: Indian
power plant turns sewage into process water,
Gas- und Wasserfach. Wasser, Abwasser,
141(14): 5-7
[10] Al-Zboon K, Al-Ananzeh N (2008).
Performance of Effluent treatment plants in
Jordan power plant and suitability for reuse,
Afr. J. Biotechnology. 7(15): 2621-2629.
[11] Bashar Al Smadi1, Kamel Al-Zboon2* and
Tariq Al-Azab(2010) “Water management
and reuse opportunities in a thermal power
plant in Jordan” African Journal of
Biotechnology Vol. 9 (29): 4607-4613
[12] JURY WA, Vaux HJ Jr, Stolzy LH (2007).
Reuse of power plant cooling water for
irrigation, journal of the American water
resources association, 16(5): 830- 836
[13] IS 3025 Test for (Physical & Chemical Water
& Wastewater)](https://image.slidesharecdn.com/bw35425429-130927232618-phpapp02/85/Bw35425429-5-320.jpg)

The study evaluates the performance of an effluent treatment plant (ETP) for wastewater generated by a coal-based thermal power plant near Nagpur, India, focusing on various physical and chemical parameters including pH, temperature, and heavy metals. Results indicate substantial removal efficiencies for pollutants, with average efficiencies of 28.74% for COD and 27.31% for TDS, while revealing that some heavy metals exceed Indian permissible limits. The findings emphasize the importance of monitoring and improving wastewater treatment processes to mitigate environmental impacts.


