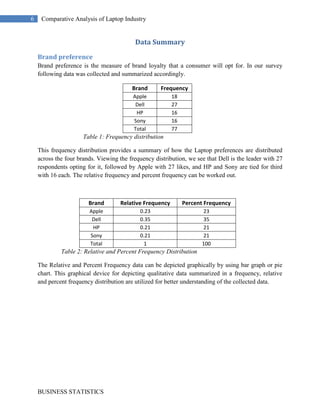
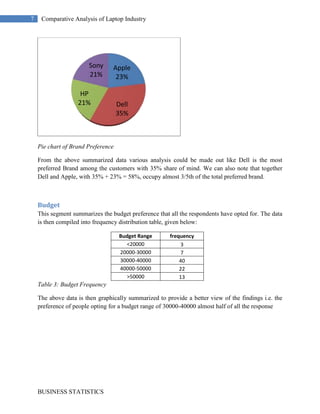
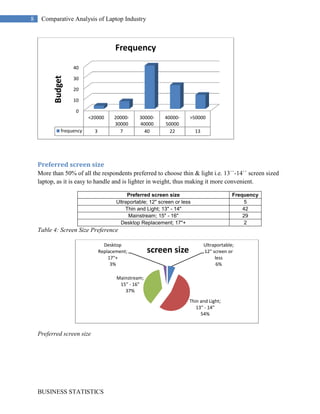
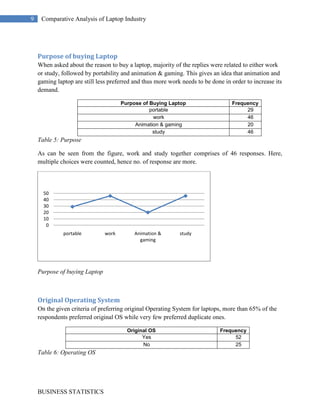
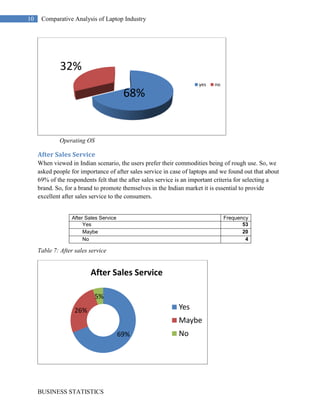
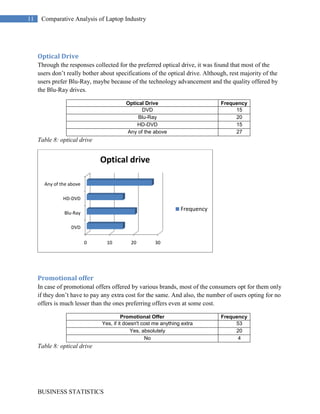
centerbottom10500090000centercenter0105000centercenter0105000centertop10500090000 4476751532255Survey on Consumer Buying Behavior of Laptop00Survey on Consumer Buying Behavior of Laptop37548773648642Submitted by:Khem Singh (191090)00Submitted by:Khem Singh (191090)-2171703648075Submitted to:Dr. Sumeet Kaur4000020000Submitted to:Dr. Sumeet Kaur-476251827530            Business Statistics Assignment I020000            Business Statistics Assignment I<br />Table of Contents TOC \o \"
1-3\"
 \h \z \u About the Survey PAGEREF _Toc278737834 \h 3Industry Profile PAGEREF _Toc278737835 \h 4Major Findings and Analysis PAGEREF _Toc278737836 \h 5Data Summary PAGEREF _Toc278737837 \h 7Brand preference PAGEREF _Toc278737838 \h 7Budget PAGEREF _Toc278737839 \h 8Preferred screen size PAGEREF _Toc278737840 \h 9Purpose of buying Laptop PAGEREF _Toc278737841 \h 10Original Operating System PAGEREF _Toc278737842 \h 10After Sales Service PAGEREF _Toc278737843 \h 11Optical Drive PAGEREF _Toc278737844 \h 12Promotional offer PAGEREF _Toc278737845 \h 12Measure of Location PAGEREF _Toc278737846 \h 13Mean, Median & Mode PAGEREF _Toc278737847 \h 13Mean PAGEREF _Toc278737848 \h 13Median PAGEREF _Toc278737849 \h 14Mode PAGEREF _Toc278737850 \h 14Measure of Variability PAGEREF _Toc278737851 \h 15Variance PAGEREF _Toc278737853 \h 15Standard Deviation PAGEREF _Toc278737854 \h 15Coefficient of Variation PAGEREF _Toc278737855 \h 15Probability of events PAGEREF _Toc278737856 \h 16Hypothesis PAGEREF _Toc278737861 \h 18State the hypothesis PAGEREF _Toc278737862 \h 18Formulate an analysis plan PAGEREF _Toc278737863 \h 18Analyze sample data PAGEREF _Toc278737864 \h 19Interpret results PAGEREF _Toc278737865 \h 19Annexure PAGEREF _Toc278737866 \h 21<br />About the Survey<br />Consumer Buying Behavior of Laptop is a survey to gather feedback about User’s buying behavior of laptop and their various preferences and suggestions. The purpose of the survey is to gather as much information as possible and then to apply various Business Statistics tools to summarize and analyze the collected data to make out further inferences and trends prevailing. <br />There were over 77 respondents to the survey. We would like to thank them for their participation.<br />As part of the survey, respondents were supposed to state their preferences and opinions on issues ranging from which Brand they prefer to what is their budget for buying a laptop to what all they look for in a laptop, etc. The survey was basically weaved around the various parameters that a consumer considers while buying a laptop and what all factors influences the purchase, like price, brand, configuration, purpose etc. The demographic variables collected include: age & gender.<br />The Questionnaire was administered online, hosted on FOREIAN.COM and apart from publishing it on the website the survey was promoted through social media websites like twitter and Facebook.<br />Industry Profile<br />Laptops were originally considered to be \"
a small niche market\"
 and were thought suitable mostly for \"
specialized field applications\"
 such as \"
the military, the Internal Revenue Service, accountants and sales representatives\"
. But today, there are already more laptops than desktops in businesses, and laptops are becoming obligatory for student use and more popular for general use. The laptop sales are growing at much faster rate than projected. India's personal computer market is undergoing a major transition. However, laptop computers cannot completely wipe out desktop computers, because both are designed to meet different needs or different consumer segments. <br />Major Players: The major players in the laptop category are: <br />Hewlett Packard (HP) <br />Apple<br />Dell Computers <br />Sony <br />Growth Drivers: <br />Indian Laptop market in now in sync with global market. It was in 2005 that sales of laptops surpassed the sales of desktop computers for the first time in India. <br />The Laptop market is growing at a fast rate because of change in work life of consumers. As the need for \"
anytime anywhere\"
 access to information is increasing, the sales of Laptops are also increasing. <br />Other factors that are responsible for the hike in sales figure are reduction in prices and affordability. Laptops are now sold at approximately half the price at which they were sold two years ago. Laptops prices are now almost at par with the desktop computer prices. <br />The third most important factor is duty free import of Laptops as a personal baggage that has helped a lot in increasing the penetration level of the product among the consumer population. Awareness about laptops has also increased over the years. <br />Major Findings and Analysis<br />In case of Brand preference, Dell is the leader with 27 respondents opting for it, followed by Apple with 27 votes, and HP and Sony are tied for third with 16 each. As the survey was filled mostly by students and working professionals it can be said that Dell covers a majority portion of the segment of students and working professionals.
The preferences of people opting for a budget range of 30000-40000 almost half of all the response.
More than 50% of all the respondents preferred to choose thin & light i.e. 13``-14`` screen sized laptop. The fact that majority of the sample wish to buy a laptop for work and study makes it obvious that they preferred and thin and light laptop but a very low portion of the sample selected ultra-light laptops. So customer wants the laptop to be thin and light but do not want to compromise on the functionality. Dell should invest on its R&D to develop smaller and lighter laptops but having the same configuration as the bigger laptops.
When asked about the reason to buy a laptop, majority of the replies were related to either work or study, followed by portability and animation & gaming.
Most the consumers opt for the promotional offers offered by the companies only if they don’t cost them anything extra.
In case of optical drives, consumers are very indifferent, as most of the respondents said that they would go for any optical drive. Thus Dell should give customize option to its customer in optical drive. This would reduce the financial risk of purchasing its laptops.
The most important aspect that was found was that of after sales service. 69% of the respondents said that they consider after sales service as very important aspect before deciding upon the brand to be preferred.
68% of the consumers opt for original OS while buying the laptops.
The mean rating on “please rate various brands of laptop on the basis of looks and stylishness” on a scale ranging from 0 = bad to 5 = excellent, Apple got the highest mean rating with a rating of 4.337 followed by Sony 3.480, Dell 3.272 and HP 3.246.
The median rating on “please rate various brands of laptop on the basis of looks and stylishness” was highest for Apple but there is uncertainty over the 3rd position in between Dell and HP with both having a median rating of 3, thus mean is preferred over here as there is no such extreme low or large values.
The mode rating on “please rate various brands of laptop on the basis of looks and stylishness” was again rating Apple as the most preferred brand in case of looks and style.
The sample variance comes out to be 5.48427, and the sample standard deviation is 2.3418 years. Thus we can say here that, in general each value of age varies from the mean value by a difference of 2.3418 years.
The coefficient of variation is 9.864 %. This means that sample standard deviation is 9.864 % of the value of sample mean.
The probability of a female to choose Apple is the highest and Apple has got the highest rating in terms of looks and style. So we can say that for female customer style and looks of the laptop is the top priority. So Dell should try and make its laptops more stylish or could launch a new line of laptops for women.
The probability of a male to choose Dell is the highest. Good after sales service could be a reason for them choosing Dell as 69% of the total sample thinks that after sales service is an important factor in making buying decision. Dell should try to find new ways to increase customer satisfaction. Data Summary <br />Brand preference<br />Brand preference is the measure of brand loyalty that a consumer will opt for. In our survey following data was collected and summarized accordingly.<br />BrandFrequencyApple18Dell27HP16Sony16Total77<br />                             Table 1: Frequency distribution<br />This frequency distribution provides a summary of how the Laptop preferences are distributed across the four brands. Viewing the frequency distribution, we see that Dell is the leader with 27 respondents opting for it, followed by Apple with 27 likes, and HP and Sony are tied for third with 16 each. The relative frequency and percent frequency can be worked out.<br />BrandRelative FrequencyPercent FrequencyApple0.2323Dell0.3535HP0.2121Sony0.2121Total1100<br />               Table 2: Relative and Percent Frequency Distribution<br />The Relative and Percent Frequency data can be depicted graphically by using bar graph or pie chart. This graphical device for depicting qualitative data summarized in a frequency, relative and percent frequency distribution are utilized for better understanding of the collected data.<br />                   <br />                  Pie chart of Brand Preference<br />From the above summarized data various analysis could be made out like Dell is the most preferred Brand among the customers with 35% share of mind. We can also note that together Dell and Apple, with 35% + 23% = 58%, occupy almost 3/5th of the total preferred brand.<br />Budget<br />This segment summarizes the budget preference that all the respondents have opted for. The data is then compiled into frequency distribution table, given below:<br />Budget Rangefrequency<20000320000-30000730000-400004040000-5000022>5000013<br />                             Table 3: Budget Frequency <br />The above data is then graphically summarized to provide a better view of the findings i.e. the preference of people opting for a budget range of 30000-40000 almost half of all the response<br />                     <br />Preferred screen size<br />More than 50% of all the respondents preferred to choose thin & light i.e. 13``-14`` screen sized laptop, as it is easy to handle and is lighter in weight, thus making it more convenient. <br />Preferred screen sizeFrequencyUltraportable; 12\"
 screen or less5Thin and Light; 13\"
 - 14\"
42Mainstream; 15\"
 - 16\"
29Desktop Replacement; 17\"
+2<br />               Table 4: Screen Size Preference<br />                                                                                              <br />Preferred screen size<br />Purpose of buying Laptop<br />When asked about the reason to buy a laptop, majority of the replies were related to either work or study, followed by portability and animation & gaming. This gives an idea that animation and gaming laptop are still less preferred and thus more work needs to be done in order to increase its demand.   <br />Purpose of Buying LaptopFrequencyportable29work46Animation & gaming20study46<br />            Table 5: Purpose<br />As can be seen from the figure, work and study together comprises of 46 responses. Here, multiple choices were counted, hence no. of response are more. <br />                                  <br />                Purpose of buying Laptop<br />Original Operating System<br />On the given criteria of preferring original Operating System for laptops, more than 65% of the respondents preferred original OS while very few preferred duplicate ones.<br />Original OSFrequencyYes52No25<br />       Table 6: Operating OS<br />                 <br />              Operating OS<br />After Sales Service<br />When viewed in Indian scenario, the users prefer their commodities being of rough use. So, we asked people for importance of after sales service in case of laptops and we found out that about 69% of the respondents felt that the after sales service is an important criteria for selecting a brand. So, for a brand to promote themselves in the Indian market it is essential to provide excellent after sales service to the consumers. <br />After Sales ServiceFrequencyYes53Maybe20No4<br />          Table 7: After sales service<br />                      <br />Optical Drive<br />Through the responses collected for the preferred optical drive, it was found that most of the users don’t really bother about specifications of the optical drive. Although, rest majority of the users prefer Blu-Ray, maybe because of the technology advancement and the quality offered by the Blu-Ray drives.<br />Optical DriveFrequencyDVD15Blu-Ray20HD-DVD15Any of the above27<br />     Table 8: optical drive<br />                  <br />Promotional offer<br />In case of promotional offers offered by various brands, most of the consumers opt for them only if they don’t have to pay any extra cost for the same. And also, the number of users opting for no offers is much lesser than the ones preferring offers even at some cost.<br />Promotional OfferFrequencyYes, if it doesn't cost me anything extra53Yes, absolutely20No4<br />          Table 8: optical drive<br />                <br />Measure of Location<br />Mean, Median & Mode<br />The respondents were asked to rate the laptops on the basis of their looks and stylishness, on a scale of 0 (poor) to 5 (excellent). The response was then collected and further analysis was done using mean, median & mode. The findings are summarized below.<br />RatingsAppleDellHPSony1(poor)02192(average)41313113(good)8283474(very good)233024325(excellent)424517<br />          Table 9: Ratings<br />Mean<br />RatingsApple Dell HP Sony 100221199248132613261122382428843410282442392301202496321285422104205251785Sum77334772527725077268    Mean 4.337662 3.272727 3.246753 3.480519<br />Table 10: Mean Values<br />When the no. of response were multiplied by the values i.e. 1 – 5 and finally summed up, we got the sum total of the values of responses. This was then divided by the no. of response i.e. 77, thus giving us the mean value for different brands of laptops. The inference can be sought out that, the mean rating for Apple is highest with a rating of 4.337 followed by Sony 3.480, Dell 3.272 and HP 3.246<br />Median<br />As we are considering 77 responses, therefore for an odd number of observations the median is the middle value. Thus the values are:<br />  Apple DellHPSonyMedian 5334<br />         Table 11: Median Values<br />Contrary to the mean ratings, the value of median is preferred in some cases as it is not influenced by outliers i.e. extremely small and large values. But here as the range is only from 1 to 5, thus mean ratings are more accurate in this case and gives a better idea of the ratings. Here also the median rating was highest for Apple but there is uncertainty over the 3rd position in between Dell and HP.   <br />Mode<br />This is the value that occurs with greatest frequency. It provides the information about the interest. <br />   AppleDellHPSony      Mode 5(42)4(30)3(34)4(32)<br />                  Table 12: Mode Values<br />In this case, the mode for the rating of 5 (excellent) occurs mostly in the case of Apple. Thus any customer going out for looks and stylishness will choose Apple as its preferred laptop followed by Sony, Dell and HP.<br />Measure of Variability<br />From the entire sample data Age was taken into account to measure the variability. The sample data included age ranging from 19 to 32. This data was then calculated for different mathematical tools and following summarized values were obtained:<br />Sum of AgeNo. of ResponsesMean∑ (Xi - X`)218287723.74025974416.81<br />Table 12: Sample Variance (Annexure)<br />Variance<br />Here the data being analyzed are for a sample, thus sample variance is taken into account. It describes how far values lie from the mean. We have taken sample variance of Age and following results were obtained :<br />S2  = ∑ (Squared deviation about the mean) / n-1<br />S2  = 416.81/76 = 5.48427 (years)2 <br />Standard Deviation<br />It is the positive square root of the variance. It is the measure in the same unit as the original data and thus is more easily compared to the mean and other statistics that are measured in the same unit as the original data. the standard deviation statistic is a number that marks a distance on the measurement scale. The sample variance was 5.48427, thus the sample standard deviation is<br />S = √S2<br />S = √5.48427 = 2.3418 (years)<br />We can say here that, in general each value of age varies from the mean value by a difference of 2.3418 years. In very general terms it is the average difference between each score and the mean average.<br />Coefficient of Variation<br />It gives us the descriptive statistics that indicates how large the standard deviation is relative to the mean. From the above calculated data we got the values of standard deviation and mean, which can be then further used to calculate coefficient of variation.<br />(Standard Deviation / Mean) * 100<br />2.3418/23.7402 * 100 = 9.864 %<br />This means that sample standard deviation is 9.864 % of the value of sample mean.<br />Probability of events<br />Probability is the numerical measure of the likelihood that an event will occur. Thus, probabilities can be used as measures of the degree of uncertainty associated with the known events. If probabilities are available, we can determine the likelihood of each event occurring. For a manager it is very important to know how many people will buy or have the company’s product. This is essential to know what the customer thinks about the product or the brand. The brand may be in the heart of the customer or in his/her mind and knowing that helps the manager to estimate the market share of the brand/product.<br />BrandMaleFemaleGrand Totalapple9918Dell23427HP9716Sony12416Grand Total532477<br />Table 13<br />BrandMaleFemalePersonapple0.170.380.23Dell0.430.170.35HP0.170.290.21Sony0.230.170.21<br />Table 14<br />    <br />We can see from the above table that the probability for a male to choose Dell is the highest (0.43) and the probability of a female to select apple is highest (0.38). Also the probability of a person to select Dell is highest among all the other brands (0.35).<br />SpecificationMaleFemaleGrand Total>4 GB, 500 GB7183 or 4 GB, 320 or 50013316<3 GB, 250303Grand total23427<br /> Table 15<br /> <br />Dell SpecificationProbability>4 GB, 500 GB0.103 or 4 GB, 320 or 5000.21<3 GB, 2500.04<br />Table 16<br />The probability of selecting 3 or 4 GB, 320 or 500 specification of Dell is the highest (0.21). <br /> <br />Hypothesis<br />Hypothesis is a concept that is not yet verified but that if true would explain certain facts or phenomena. As the data that we are concerned about in this section deals about the rating of various brands on a scale of 1(bad) to 5(excellent), thus we cannot use the population mean.<br />We have to conduct a hypothesis test about a population proportion. This approach consists of four steps: <br />(1) State the hypothesis<br />(2) Formulate an analysis plan <br />(3) Analyze sample data<br />(4) Interpret results. <br />State the hypothesis <br />Every hypothesis test requires the analyst to state a null hypothesis (H0) and an alternative hypothesis (Ha). The hypotheses are stated in such a way that they are mutually exclusive. That is, if one is true, the other must be false; and vice versa. <br />Here, our null hypothesis is that proportion of consumer purchasing Dell laptops does not prefer looks and stylishness as a factor before buying laptops. <br />For this, we conducted a survey and asked people to rate various laptop brands on a scale of 1 to 5. We found out that from a sample (n) of 77, 34 people were satisfied by the looks and style factor of Dell laptop. Thus, our sample proportion (P) comes out to be:<br />P = 34/77 = 0.441<br />And from the secondary data, we found out that the population proportion (P0) is the market share of Dell laptop in India that is 27 %. Thus, our population proportion is:<br />P0 = 0.27<br />Therefore, the hypothesis statement can be written as<br />H0: p <= 0.27       and    H1:  p > 0.27<br />Formulate an analysis plan<br />The analysis plan describes how to use sample data to accept or reject the null hypothesis. It should specify the following elements.<br />Significance level: Often, researchers choose significance levels equal to 0.01, 0.05, or 0.10; but any value between 0 and 1 can be used. We have assumed the significance level to be 0.05.<br />ά = 0.05<br />Test method: we are using Z-test method to determine whether the hypothesized population proportion differs significantly from the observed sample proportion.<br />Analyze sample data<br />To analyze a given sample data, we have to find out the test statistic and the P value associated with it.<br />Test statistic: The test statistic is a z-score (z) defined by the following equation. <br />z = (P – P0) / √ P0 (1- P0) / n <br />Where P0 is the hypothesized value of population proportion in the null hypothesis, P is the sample proportion and n is the sample size.<br />From the stated value of P0, P and n,<br />i.e.  P0 = 0.27, P = 0.441 and n = 77, the value of z comes out to be:<br />z = 3.0379<br />Using the table of areas for the standard normal distribution, we find that the area between the mean and z = 3.03 is 0.4988<br />Thus the p – value for the test is <br />0.500 – 0.4988 = 0.0012<br />p – Value = 0.0012 <br />Interpret results<br />The final decision to accept or reject null hypothesis can be made by using any of the two methods:<br />p – value approach
Critical value approach We have taken p – value approach to come to the results. This involves comparing the p – Value to the significance level (ά). If the p – value is less than the significance level than the null hypothesis (H0) is rejected and alternate hypothesis is accepted. <br />Rejection Rule: Reject H0 if p – value <= ά<br />Since, here the p – value which is 0.0012 is lesser as compared to the significance level of 0.05<br />i.e. 0.0012 < 0.05<br />Thus this gives us sufficient statistical evidence to reject H0 at the 0.05 level of significance and alternate hypothesis Ha is accepted. Thus the test provides support to the conclusion that proportions of the consumers that buy Dell laptops surely prefer looks and stylishness as a major factor that influences their buying behavior.<br />Annexure<br />Computation of the Sample Variance for the DataAge  (Xi)Sample Mean    Deviation about the mean (Xi - )          Squared deviation about the mean  (Xi - )2          2123.74025974-2.740259747.5090234432623.740259742.259740265.1064260432823.740259744.2597402618.145387082923.740259745.2597402627.66486762423.740259740.259740260.0674650032523.740259741.259740261.5869455232423.740259740.259740260.0674650032623.740259742.259740265.1064260432723.740259743.2597402610.625906562323.74025974-0.740259740.5479844832923.740259745.2597402627.66486762423.740259740.259740260.0674650031923.74025974-4.7402597422.47006242423.740259740.259740260.0674650032423.740259740.259740260.0674650032823.740259744.2597402618.145387082523.740259741.259740261.5869455232623.740259742.259740265.1064260432423.740259740.259740260.0674650032223.74025974-1.740259743.0285039632223.74025974-1.740259743.0285039632323.74025974-0.740259740.5479844832423.740259740.259740260.0674650032123.74025974-2.740259747.5090234432223.74025974-1.740259743.0285039632223.74025974-1.740259743.0285039632523.740259741.259740261.5869455232423.740259740.259740260.0674650033223.740259748.2597402668.223309162223.74025974-1.740259743.0285039632623.740259742.259740265.1064260432223.74025974-1.740259743.0285039632623.740259742.259740265.1064260432123.74025974-2.740259747.5090234432523.740259741.259740261.5869455232323.74025974-0.740259740.5479844832223.74025974-1.740259743.0285039632123.74025974-2.740259747.5090234432823.740259744.2597402618.145387082423.740259740.259740260.0674650032223.74025974-1.740259743.0285039632423.740259740.259740260.0674650032323.74025974-0.740259740.5479844832723.740259743.2597402610.625906562223.74025974-1.740259743.0285039632523.740259741.259740261.5869455232523.740259741.259740261.5869455232223.74025974-1.740259743.0285039632223.74025974-1.740259743.0285039632123.74025974-2.740259747.5090234432523.740259741.259740261.5869455232223.74025974-1.740259743.0285039632423.740259740.259740260.0674650032523.740259741.259740261.5869455232223.74025974-1.740259743.0285039632223.74025974-1.740259743.0285039632623.740259742.259740265.1064260432223.74025974-1.740259743.0285039632323.74025974-0.740259740.5479844832223.74025974-1.740259743.0285039632023.74025974-3.7402597413.989542922623.740259742.259740265.1064260432123.74025974-2.740259747.5090234432223.74025974-1.740259743.0285039632223.74025974-1.740259743.0285039632523.740259741.259740261.5869455232323.74025974-0.740259740.5479844832223.74025974-1.740259743.0285039632523.740259741.259740261.5869455232223.74025974-1.740259743.0285039632523.740259741.259740261.5869455232423.740259740.259740260.0674650032523.740259741.259740261.5869455232223.74025974-1.740259743.0285039632223.74025974-1.740259743.0285039632123.74025974-2.740259747.5090234432223.74025974-1.740259743.028503963  ∑(Xi - )          = 0.00∑(Xi - )           = 416.81<br />
Business statistics research on consumer behaviour

Business statistics research on consumer behaviour

  • 1.
    centerbottom10500090000centercenter0105000centercenter0105000centertop10500090000 4476751532255Survey onConsumer Buying Behavior of Laptop00Survey on Consumer Buying Behavior of Laptop37548773648642Submitted by:Khem Singh (191090)00Submitted by:Khem Singh (191090)-2171703648075Submitted to:Dr. Sumeet Kaur4000020000Submitted to:Dr. Sumeet Kaur-476251827530 Business Statistics Assignment I020000 Business Statistics Assignment I<br />Table of Contents TOC \o \" 1-3\" \h \z \u About the Survey PAGEREF _Toc278737834 \h 3Industry Profile PAGEREF _Toc278737835 \h 4Major Findings and Analysis PAGEREF _Toc278737836 \h 5Data Summary PAGEREF _Toc278737837 \h 7Brand preference PAGEREF _Toc278737838 \h 7Budget PAGEREF _Toc278737839 \h 8Preferred screen size PAGEREF _Toc278737840 \h 9Purpose of buying Laptop PAGEREF _Toc278737841 \h 10Original Operating System PAGEREF _Toc278737842 \h 10After Sales Service PAGEREF _Toc278737843 \h 11Optical Drive PAGEREF _Toc278737844 \h 12Promotional offer PAGEREF _Toc278737845 \h 12Measure of Location PAGEREF _Toc278737846 \h 13Mean, Median & Mode PAGEREF _Toc278737847 \h 13Mean PAGEREF _Toc278737848 \h 13Median PAGEREF _Toc278737849 \h 14Mode PAGEREF _Toc278737850 \h 14Measure of Variability PAGEREF _Toc278737851 \h 15Variance PAGEREF _Toc278737853 \h 15Standard Deviation PAGEREF _Toc278737854 \h 15Coefficient of Variation PAGEREF _Toc278737855 \h 15Probability of events PAGEREF _Toc278737856 \h 16Hypothesis PAGEREF _Toc278737861 \h 18State the hypothesis PAGEREF _Toc278737862 \h 18Formulate an analysis plan PAGEREF _Toc278737863 \h 18Analyze sample data PAGEREF _Toc278737864 \h 19Interpret results PAGEREF _Toc278737865 \h 19Annexure PAGEREF _Toc278737866 \h 21<br />About the Survey<br />Consumer Buying Behavior of Laptop is a survey to gather feedback about User’s buying behavior of laptop and their various preferences and suggestions. The purpose of the survey is to gather as much information as possible and then to apply various Business Statistics tools to summarize and analyze the collected data to make out further inferences and trends prevailing. <br />There were over 77 respondents to the survey. We would like to thank them for their participation.<br />As part of the survey, respondents were supposed to state their preferences and opinions on issues ranging from which Brand they prefer to what is their budget for buying a laptop to what all they look for in a laptop, etc. The survey was basically weaved around the various parameters that a consumer considers while buying a laptop and what all factors influences the purchase, like price, brand, configuration, purpose etc. The demographic variables collected include: age & gender.<br />The Questionnaire was administered online, hosted on FOREIAN.COM and apart from publishing it on the website the survey was promoted through social media websites like twitter and Facebook.<br />Industry Profile<br />Laptops were originally considered to be \" a small niche market\" and were thought suitable mostly for \" specialized field applications\" such as \" the military, the Internal Revenue Service, accountants and sales representatives\" . But today, there are already more laptops than desktops in businesses, and laptops are becoming obligatory for student use and more popular for general use. The laptop sales are growing at much faster rate than projected. India's personal computer market is undergoing a major transition. However, laptop computers cannot completely wipe out desktop computers, because both are designed to meet different needs or different consumer segments. <br />Major Players: The major players in the laptop category are: <br />Hewlett Packard (HP) <br />Apple<br />Dell Computers <br />Sony <br />Growth Drivers: <br />Indian Laptop market in now in sync with global market. It was in 2005 that sales of laptops surpassed the sales of desktop computers for the first time in India. <br />The Laptop market is growing at a fast rate because of change in work life of consumers. As the need for \" anytime anywhere\" access to information is increasing, the sales of Laptops are also increasing. <br />Other factors that are responsible for the hike in sales figure are reduction in prices and affordability. Laptops are now sold at approximately half the price at which they were sold two years ago. Laptops prices are now almost at par with the desktop computer prices. <br />The third most important factor is duty free import of Laptops as a personal baggage that has helped a lot in increasing the penetration level of the product among the consumer population. Awareness about laptops has also increased over the years. <br />Major Findings and Analysis<br />In case of Brand preference, Dell is the leader with 27 respondents opting for it, followed by Apple with 27 votes, and HP and Sony are tied for third with 16 each. As the survey was filled mostly by students and working professionals it can be said that Dell covers a majority portion of the segment of students and working professionals.
  • 2.
    The preferences ofpeople opting for a budget range of 30000-40000 almost half of all the response.
  • 3.
    More than 50%of all the respondents preferred to choose thin & light i.e. 13``-14`` screen sized laptop. The fact that majority of the sample wish to buy a laptop for work and study makes it obvious that they preferred and thin and light laptop but a very low portion of the sample selected ultra-light laptops. So customer wants the laptop to be thin and light but do not want to compromise on the functionality. Dell should invest on its R&D to develop smaller and lighter laptops but having the same configuration as the bigger laptops.
  • 4.
    When asked aboutthe reason to buy a laptop, majority of the replies were related to either work or study, followed by portability and animation & gaming.
  • 5.
    Most the consumersopt for the promotional offers offered by the companies only if they don’t cost them anything extra.
  • 6.
    In case ofoptical drives, consumers are very indifferent, as most of the respondents said that they would go for any optical drive. Thus Dell should give customize option to its customer in optical drive. This would reduce the financial risk of purchasing its laptops.
  • 7.
    The most importantaspect that was found was that of after sales service. 69% of the respondents said that they consider after sales service as very important aspect before deciding upon the brand to be preferred.
  • 8.
    68% of theconsumers opt for original OS while buying the laptops.
  • 9.
    The mean ratingon “please rate various brands of laptop on the basis of looks and stylishness” on a scale ranging from 0 = bad to 5 = excellent, Apple got the highest mean rating with a rating of 4.337 followed by Sony 3.480, Dell 3.272 and HP 3.246.
  • 10.
    The median ratingon “please rate various brands of laptop on the basis of looks and stylishness” was highest for Apple but there is uncertainty over the 3rd position in between Dell and HP with both having a median rating of 3, thus mean is preferred over here as there is no such extreme low or large values.
  • 11.
    The mode ratingon “please rate various brands of laptop on the basis of looks and stylishness” was again rating Apple as the most preferred brand in case of looks and style.
  • 12.
    The sample variancecomes out to be 5.48427, and the sample standard deviation is 2.3418 years. Thus we can say here that, in general each value of age varies from the mean value by a difference of 2.3418 years.
  • 13.
    The coefficient ofvariation is 9.864 %. This means that sample standard deviation is 9.864 % of the value of sample mean.
  • 14.
    The probability ofa female to choose Apple is the highest and Apple has got the highest rating in terms of looks and style. So we can say that for female customer style and looks of the laptop is the top priority. So Dell should try and make its laptops more stylish or could launch a new line of laptops for women.
  • 15.
    The probability ofa male to choose Dell is the highest. Good after sales service could be a reason for them choosing Dell as 69% of the total sample thinks that after sales service is an important factor in making buying decision. Dell should try to find new ways to increase customer satisfaction. Data Summary <br />Brand preference<br />Brand preference is the measure of brand loyalty that a consumer will opt for. In our survey following data was collected and summarized accordingly.<br />BrandFrequencyApple18Dell27HP16Sony16Total77<br /> Table 1: Frequency distribution<br />This frequency distribution provides a summary of how the Laptop preferences are distributed across the four brands. Viewing the frequency distribution, we see that Dell is the leader with 27 respondents opting for it, followed by Apple with 27 likes, and HP and Sony are tied for third with 16 each. The relative frequency and percent frequency can be worked out.<br />BrandRelative FrequencyPercent FrequencyApple0.2323Dell0.3535HP0.2121Sony0.2121Total1100<br /> Table 2: Relative and Percent Frequency Distribution<br />The Relative and Percent Frequency data can be depicted graphically by using bar graph or pie chart. This graphical device for depicting qualitative data summarized in a frequency, relative and percent frequency distribution are utilized for better understanding of the collected data.<br /> <br /> Pie chart of Brand Preference<br />From the above summarized data various analysis could be made out like Dell is the most preferred Brand among the customers with 35% share of mind. We can also note that together Dell and Apple, with 35% + 23% = 58%, occupy almost 3/5th of the total preferred brand.<br />Budget<br />This segment summarizes the budget preference that all the respondents have opted for. The data is then compiled into frequency distribution table, given below:<br />Budget Rangefrequency<20000320000-30000730000-400004040000-5000022>5000013<br /> Table 3: Budget Frequency <br />The above data is then graphically summarized to provide a better view of the findings i.e. the preference of people opting for a budget range of 30000-40000 almost half of all the response<br /> <br />Preferred screen size<br />More than 50% of all the respondents preferred to choose thin & light i.e. 13``-14`` screen sized laptop, as it is easy to handle and is lighter in weight, thus making it more convenient. <br />Preferred screen sizeFrequencyUltraportable; 12\" screen or less5Thin and Light; 13\" - 14\" 42Mainstream; 15\" - 16\" 29Desktop Replacement; 17\" +2<br /> Table 4: Screen Size Preference<br /> <br />Preferred screen size<br />Purpose of buying Laptop<br />When asked about the reason to buy a laptop, majority of the replies were related to either work or study, followed by portability and animation & gaming. This gives an idea that animation and gaming laptop are still less preferred and thus more work needs to be done in order to increase its demand. <br />Purpose of Buying LaptopFrequencyportable29work46Animation & gaming20study46<br /> Table 5: Purpose<br />As can be seen from the figure, work and study together comprises of 46 responses. Here, multiple choices were counted, hence no. of response are more. <br /> <br /> Purpose of buying Laptop<br />Original Operating System<br />On the given criteria of preferring original Operating System for laptops, more than 65% of the respondents preferred original OS while very few preferred duplicate ones.<br />Original OSFrequencyYes52No25<br /> Table 6: Operating OS<br /> <br /> Operating OS<br />After Sales Service<br />When viewed in Indian scenario, the users prefer their commodities being of rough use. So, we asked people for importance of after sales service in case of laptops and we found out that about 69% of the respondents felt that the after sales service is an important criteria for selecting a brand. So, for a brand to promote themselves in the Indian market it is essential to provide excellent after sales service to the consumers. <br />After Sales ServiceFrequencyYes53Maybe20No4<br /> Table 7: After sales service<br /> <br />Optical Drive<br />Through the responses collected for the preferred optical drive, it was found that most of the users don’t really bother about specifications of the optical drive. Although, rest majority of the users prefer Blu-Ray, maybe because of the technology advancement and the quality offered by the Blu-Ray drives.<br />Optical DriveFrequencyDVD15Blu-Ray20HD-DVD15Any of the above27<br /> Table 8: optical drive<br /> <br />Promotional offer<br />In case of promotional offers offered by various brands, most of the consumers opt for them only if they don’t have to pay any extra cost for the same. And also, the number of users opting for no offers is much lesser than the ones preferring offers even at some cost.<br />Promotional OfferFrequencyYes, if it doesn't cost me anything extra53Yes, absolutely20No4<br /> Table 8: optical drive<br /> <br />Measure of Location<br />Mean, Median & Mode<br />The respondents were asked to rate the laptops on the basis of their looks and stylishness, on a scale of 0 (poor) to 5 (excellent). The response was then collected and further analysis was done using mean, median & mode. The findings are summarized below.<br />RatingsAppleDellHPSony1(poor)02192(average)41313113(good)8283474(very good)233024325(excellent)424517<br /> Table 9: Ratings<br />Mean<br />RatingsApple Dell HP Sony 100221199248132613261122382428843410282442392301202496321285422104205251785Sum77334772527725077268    Mean 4.337662 3.272727 3.246753 3.480519<br />Table 10: Mean Values<br />When the no. of response were multiplied by the values i.e. 1 – 5 and finally summed up, we got the sum total of the values of responses. This was then divided by the no. of response i.e. 77, thus giving us the mean value for different brands of laptops. The inference can be sought out that, the mean rating for Apple is highest with a rating of 4.337 followed by Sony 3.480, Dell 3.272 and HP 3.246<br />Median<br />As we are considering 77 responses, therefore for an odd number of observations the median is the middle value. Thus the values are:<br />  Apple DellHPSonyMedian 5334<br /> Table 11: Median Values<br />Contrary to the mean ratings, the value of median is preferred in some cases as it is not influenced by outliers i.e. extremely small and large values. But here as the range is only from 1 to 5, thus mean ratings are more accurate in this case and gives a better idea of the ratings. Here also the median rating was highest for Apple but there is uncertainty over the 3rd position in between Dell and HP. <br />Mode<br />This is the value that occurs with greatest frequency. It provides the information about the interest. <br />   AppleDellHPSony      Mode 5(42)4(30)3(34)4(32)<br /> Table 12: Mode Values<br />In this case, the mode for the rating of 5 (excellent) occurs mostly in the case of Apple. Thus any customer going out for looks and stylishness will choose Apple as its preferred laptop followed by Sony, Dell and HP.<br />Measure of Variability<br />From the entire sample data Age was taken into account to measure the variability. The sample data included age ranging from 19 to 32. This data was then calculated for different mathematical tools and following summarized values were obtained:<br />Sum of AgeNo. of ResponsesMean∑ (Xi - X`)218287723.74025974416.81<br />Table 12: Sample Variance (Annexure)<br />Variance<br />Here the data being analyzed are for a sample, thus sample variance is taken into account. It describes how far values lie from the mean. We have taken sample variance of Age and following results were obtained :<br />S2 = ∑ (Squared deviation about the mean) / n-1<br />S2 = 416.81/76 = 5.48427 (years)2 <br />Standard Deviation<br />It is the positive square root of the variance. It is the measure in the same unit as the original data and thus is more easily compared to the mean and other statistics that are measured in the same unit as the original data. the standard deviation statistic is a number that marks a distance on the measurement scale. The sample variance was 5.48427, thus the sample standard deviation is<br />S = √S2<br />S = √5.48427 = 2.3418 (years)<br />We can say here that, in general each value of age varies from the mean value by a difference of 2.3418 years. In very general terms it is the average difference between each score and the mean average.<br />Coefficient of Variation<br />It gives us the descriptive statistics that indicates how large the standard deviation is relative to the mean. From the above calculated data we got the values of standard deviation and mean, which can be then further used to calculate coefficient of variation.<br />(Standard Deviation / Mean) * 100<br />2.3418/23.7402 * 100 = 9.864 %<br />This means that sample standard deviation is 9.864 % of the value of sample mean.<br />Probability of events<br />Probability is the numerical measure of the likelihood that an event will occur. Thus, probabilities can be used as measures of the degree of uncertainty associated with the known events. If probabilities are available, we can determine the likelihood of each event occurring. For a manager it is very important to know how many people will buy or have the company’s product. This is essential to know what the customer thinks about the product or the brand. The brand may be in the heart of the customer or in his/her mind and knowing that helps the manager to estimate the market share of the brand/product.<br />BrandMaleFemaleGrand Totalapple9918Dell23427HP9716Sony12416Grand Total532477<br />Table 13<br />BrandMaleFemalePersonapple0.170.380.23Dell0.430.170.35HP0.170.290.21Sony0.230.170.21<br />Table 14<br /> <br />We can see from the above table that the probability for a male to choose Dell is the highest (0.43) and the probability of a female to select apple is highest (0.38). Also the probability of a person to select Dell is highest among all the other brands (0.35).<br />SpecificationMaleFemaleGrand Total>4 GB, 500 GB7183 or 4 GB, 320 or 50013316<3 GB, 250303Grand total23427<br /> Table 15<br /> <br />Dell SpecificationProbability>4 GB, 500 GB0.103 or 4 GB, 320 or 5000.21<3 GB, 2500.04<br />Table 16<br />The probability of selecting 3 or 4 GB, 320 or 500 specification of Dell is the highest (0.21). <br /> <br />Hypothesis<br />Hypothesis is a concept that is not yet verified but that if true would explain certain facts or phenomena. As the data that we are concerned about in this section deals about the rating of various brands on a scale of 1(bad) to 5(excellent), thus we cannot use the population mean.<br />We have to conduct a hypothesis test about a population proportion. This approach consists of four steps: <br />(1) State the hypothesis<br />(2) Formulate an analysis plan <br />(3) Analyze sample data<br />(4) Interpret results. <br />State the hypothesis <br />Every hypothesis test requires the analyst to state a null hypothesis (H0) and an alternative hypothesis (Ha). The hypotheses are stated in such a way that they are mutually exclusive. That is, if one is true, the other must be false; and vice versa. <br />Here, our null hypothesis is that proportion of consumer purchasing Dell laptops does not prefer looks and stylishness as a factor before buying laptops. <br />For this, we conducted a survey and asked people to rate various laptop brands on a scale of 1 to 5. We found out that from a sample (n) of 77, 34 people were satisfied by the looks and style factor of Dell laptop. Thus, our sample proportion (P) comes out to be:<br />P = 34/77 = 0.441<br />And from the secondary data, we found out that the population proportion (P0) is the market share of Dell laptop in India that is 27 %. Thus, our population proportion is:<br />P0 = 0.27<br />Therefore, the hypothesis statement can be written as<br />H0: p <= 0.27 and H1: p > 0.27<br />Formulate an analysis plan<br />The analysis plan describes how to use sample data to accept or reject the null hypothesis. It should specify the following elements.<br />Significance level: Often, researchers choose significance levels equal to 0.01, 0.05, or 0.10; but any value between 0 and 1 can be used. We have assumed the significance level to be 0.05.<br />ά = 0.05<br />Test method: we are using Z-test method to determine whether the hypothesized population proportion differs significantly from the observed sample proportion.<br />Analyze sample data<br />To analyze a given sample data, we have to find out the test statistic and the P value associated with it.<br />Test statistic: The test statistic is a z-score (z) defined by the following equation. <br />z = (P – P0) / √ P0 (1- P0) / n <br />Where P0 is the hypothesized value of population proportion in the null hypothesis, P is the sample proportion and n is the sample size.<br />From the stated value of P0, P and n,<br />i.e. P0 = 0.27, P = 0.441 and n = 77, the value of z comes out to be:<br />z = 3.0379<br />Using the table of areas for the standard normal distribution, we find that the area between the mean and z = 3.03 is 0.4988<br />Thus the p – value for the test is <br />0.500 – 0.4988 = 0.0012<br />p – Value = 0.0012 <br />Interpret results<br />The final decision to accept or reject null hypothesis can be made by using any of the two methods:<br />p – value approach
  • 16.
    Critical value approachWe have taken p – value approach to come to the results. This involves comparing the p – Value to the significance level (ά). If the p – value is less than the significance level than the null hypothesis (H0) is rejected and alternate hypothesis is accepted. <br />Rejection Rule: Reject H0 if p – value <= ά<br />Since, here the p – value which is 0.0012 is lesser as compared to the significance level of 0.05<br />i.e. 0.0012 < 0.05<br />Thus this gives us sufficient statistical evidence to reject H0 at the 0.05 level of significance and alternate hypothesis Ha is accepted. Thus the test provides support to the conclusion that proportions of the consumers that buy Dell laptops surely prefer looks and stylishness as a major factor that influences their buying behavior.<br />Annexure<br />Computation of the Sample Variance for the DataAge (Xi)Sample Mean Deviation about the mean (Xi - ) Squared deviation about the mean (Xi - )2 2123.74025974-2.740259747.5090234432623.740259742.259740265.1064260432823.740259744.2597402618.145387082923.740259745.2597402627.66486762423.740259740.259740260.0674650032523.740259741.259740261.5869455232423.740259740.259740260.0674650032623.740259742.259740265.1064260432723.740259743.2597402610.625906562323.74025974-0.740259740.5479844832923.740259745.2597402627.66486762423.740259740.259740260.0674650031923.74025974-4.7402597422.47006242423.740259740.259740260.0674650032423.740259740.259740260.0674650032823.740259744.2597402618.145387082523.740259741.259740261.5869455232623.740259742.259740265.1064260432423.740259740.259740260.0674650032223.74025974-1.740259743.0285039632223.74025974-1.740259743.0285039632323.74025974-0.740259740.5479844832423.740259740.259740260.0674650032123.74025974-2.740259747.5090234432223.74025974-1.740259743.0285039632223.74025974-1.740259743.0285039632523.740259741.259740261.5869455232423.740259740.259740260.0674650033223.740259748.2597402668.223309162223.74025974-1.740259743.0285039632623.740259742.259740265.1064260432223.74025974-1.740259743.0285039632623.740259742.259740265.1064260432123.74025974-2.740259747.5090234432523.740259741.259740261.5869455232323.74025974-0.740259740.5479844832223.74025974-1.740259743.0285039632123.74025974-2.740259747.5090234432823.740259744.2597402618.145387082423.740259740.259740260.0674650032223.74025974-1.740259743.0285039632423.740259740.259740260.0674650032323.74025974-0.740259740.5479844832723.740259743.2597402610.625906562223.74025974-1.740259743.0285039632523.740259741.259740261.5869455232523.740259741.259740261.5869455232223.74025974-1.740259743.0285039632223.74025974-1.740259743.0285039632123.74025974-2.740259747.5090234432523.740259741.259740261.5869455232223.74025974-1.740259743.0285039632423.740259740.259740260.0674650032523.740259741.259740261.5869455232223.74025974-1.740259743.0285039632223.74025974-1.740259743.0285039632623.740259742.259740265.1064260432223.74025974-1.740259743.0285039632323.74025974-0.740259740.5479844832223.74025974-1.740259743.0285039632023.74025974-3.7402597413.989542922623.740259742.259740265.1064260432123.74025974-2.740259747.5090234432223.74025974-1.740259743.0285039632223.74025974-1.740259743.0285039632523.740259741.259740261.5869455232323.74025974-0.740259740.5479844832223.74025974-1.740259743.0285039632523.740259741.259740261.5869455232223.74025974-1.740259743.0285039632523.740259741.259740261.5869455232423.740259740.259740260.0674650032523.740259741.259740261.5869455232223.74025974-1.740259743.0285039632223.74025974-1.740259743.0285039632123.74025974-2.740259747.5090234432223.74025974-1.740259743.028503963  ∑(Xi - ) = 0.00∑(Xi - ) = 416.81<br />