Download to read offline
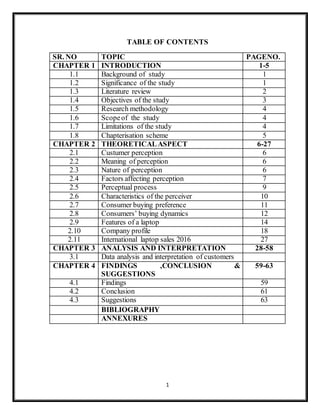


The document provides details about the table of contents and chapters of a research paper on customer perception of laptop brands. It includes an introduction describing the background and objectives of the study. It also discusses the theoretical aspects of customer perception, including the meaning and nature of perception and factors that influence it. Finally, it outlines the research methodology used in the study.