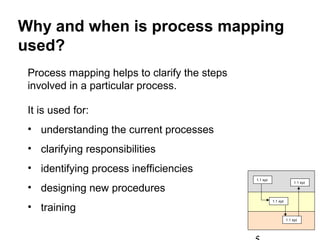
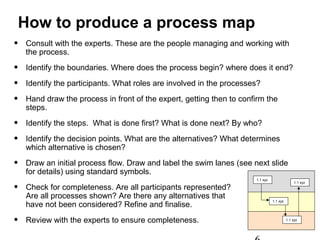
Guide to 
Business Process Modelling 
1.1 xyz 
1.1 xyz 
1.1 xyz 
1.1 xyz
2 
1.1 xyz 
1.1 xyz 
1.1 xyz 
1.1 xyz 
Contents 
 What is business process modelling? 
 What is process mapping? 
 Why and when is process mapping used? 
 How to produce a process map 
 Draw and label the swimlanes 
 Add in the process flows 
 Swap lanes and show decision points 
 Complete the process map 
 Example process map 
 Further assistance
What is business process modelling? 
Business process modelling is a means of 
representing the steps, participants and decision logic 
in business processes. 
There are three main types of process models: 
3 
1.1 xyz 
1.1 xyz 
1.1 xyz 
1.1 xyz 
1. Descriptive models: written explanations of the 
processes 
2. Active models: a working model that represents 
the processes (eg. computer simulations) 
3. Diagrammatical models: a diagram that shows 
the processes and the relationships between 
them (eg. process maps and flowcharts.) 
This guide will focus on process maps.
What is process mapping? 
Process mapping is a technique of 
diagrammatical modelling. 
The diagram represents a series of 
processes and how they are related. 
Process mapping provides a representation 
of who does what and in what order. 
4 
1.1 xyz 
1.1 xyz 
1.1 xyz 
1.1 xyz
Why and when is process mapping 
used? 
5 
1.1 xyz 
1.1 xyz 
1.1 xyz 
1.1 xyz 
Process mapping helps to clarify the steps 
involved in a particular process. 
It is used for: 
• understanding the current processes 
• clarifying responsibilities 
• identifying process inefficiencies 
• designing new procedures 
• training
How to produce a process map 
• Consult with the experts. These are the people managing and working with 
the process. 
• Identify the boundaries. Where does the process begin? where does it end? 
• Identify the participants. What roles are involved in the processes? 
• Hand draw the process in front of the expert, getting then to confirm the 
steps. 
• Identify the steps. What is done first? What is done next? By who? 
• Identify the decision points. What are the alternatives? What determines 
which alternative is chosen? 
• Draw an initial process flow. Draw and label the swim lanes (see next slide 
6 
1.1 xyz 
1.1 xyz 
1.1 xyz 
1.1 xyz 
for details) using standard symbols. 
• Check for completeness. Are all participants represented? 
Are all processes shown? Are there any alternatives that 
have not been considered? Refine and finalise. 
• Review with the experts to ensure completeness.
Draw and label the swim lanes 
7 
1.1 xyz 
1.1 xyz 
1.1 xyz 
1.1 xyz 
Employee 
Supervisor 
Administration 
The swim lanes represent the area of involvement of each 
participant who has a role in the processes being mapped. 
The participant may be an individual, a team, a department 
or an organisation.
8 
1.1 xyz 
1.1 xyz 
1.1 xyz 
1.1 xyz 
Add in the process flows 
Employee 
Supervisor 
1.1 Fill out 
expense form 
1.2 Submit 
expense form 
Administration 
Starting at top left with the start symbol. 
Draw processes along the swim lane, and use arrows to 
represent the sequence. 
Each process is given a number, and starts with a verb.
Swap lanes and enter decision points 
1.4.1 notification 
to employee 
9 
1.1 xyz 
1.1 xyz 
1.1 xyz 
1.1 xyz 
Employee 
Supervisor 
1.1 Fill out 
expense form 
1.2 Submit 
expense form 
1.3 Receive 
expense form 
No 
Administration 
When a process is performed by a different participant 
switch lanes. If the next step depends on a decision show 
this as in the example above, labelling the alternatives and 
showing the steps that follow. 
1.5 Submit 
authorised 
expense form 
1.4 
Expenses 
Valid? 
Yes
10 
1.1 xyz 
1.1 xyz 
1.1 xyz 
1.1 xyz 
Complete the process map 
Remove any unused swim lanes. 
Make sure there is one start point and all flows 
have an end point. 
Check that all decision points have all options 
labelled and have flow arrows to the next step. 
Review with participants for verification. 
An example of a completed process map is shown 
on the next slide.
Business process 1 – Process expense claim 
11 
1.1 xyz 
1.1 xyz 
1.1 xyz 
1.1 xyz 
1.1 Fill out 
expense 
form 
Employee 
Supervisor 
m m 
Administration 
1.2 Submit 
expense 
form 
1.3 Receive 
expense 
form 
1.4 
No 
Expenses 
Valid? 
Yes 
1.5 Submit 
authorised 
expense 
form 
1.6 Receive 
expense form 
1.7 Log 
expense form 
1.8 Make 
payment 
1.4.1 notification 
to employee 
1.8.1 notification 
to employee 
m 
m m 
m 
sol 
M = manual 
sol 
Sol = facilitated by solution

Business process modelling

  • 1.
    Guide to BusinessProcess Modelling 1.1 xyz 1.1 xyz 1.1 xyz 1.1 xyz
  • 2.
    2 1.1 xyz 1.1 xyz 1.1 xyz 1.1 xyz Contents  What is business process modelling?  What is process mapping?  Why and when is process mapping used?  How to produce a process map  Draw and label the swimlanes  Add in the process flows  Swap lanes and show decision points  Complete the process map  Example process map  Further assistance
  • 3.
    What is businessprocess modelling? Business process modelling is a means of representing the steps, participants and decision logic in business processes. There are three main types of process models: 3 1.1 xyz 1.1 xyz 1.1 xyz 1.1 xyz 1. Descriptive models: written explanations of the processes 2. Active models: a working model that represents the processes (eg. computer simulations) 3. Diagrammatical models: a diagram that shows the processes and the relationships between them (eg. process maps and flowcharts.) This guide will focus on process maps.
  • 4.
    What is processmapping? Process mapping is a technique of diagrammatical modelling. The diagram represents a series of processes and how they are related. Process mapping provides a representation of who does what and in what order. 4 1.1 xyz 1.1 xyz 1.1 xyz 1.1 xyz
  • 5.
    Why and whenis process mapping used? 5 1.1 xyz 1.1 xyz 1.1 xyz 1.1 xyz Process mapping helps to clarify the steps involved in a particular process. It is used for: • understanding the current processes • clarifying responsibilities • identifying process inefficiencies • designing new procedures • training
  • 6.
    How to producea process map • Consult with the experts. These are the people managing and working with the process. • Identify the boundaries. Where does the process begin? where does it end? • Identify the participants. What roles are involved in the processes? • Hand draw the process in front of the expert, getting then to confirm the steps. • Identify the steps. What is done first? What is done next? By who? • Identify the decision points. What are the alternatives? What determines which alternative is chosen? • Draw an initial process flow. Draw and label the swim lanes (see next slide 6 1.1 xyz 1.1 xyz 1.1 xyz 1.1 xyz for details) using standard symbols. • Check for completeness. Are all participants represented? Are all processes shown? Are there any alternatives that have not been considered? Refine and finalise. • Review with the experts to ensure completeness.
  • 7.
    Draw and labelthe swim lanes 7 1.1 xyz 1.1 xyz 1.1 xyz 1.1 xyz Employee Supervisor Administration The swim lanes represent the area of involvement of each participant who has a role in the processes being mapped. The participant may be an individual, a team, a department or an organisation.
  • 8.
    8 1.1 xyz 1.1 xyz 1.1 xyz 1.1 xyz Add in the process flows Employee Supervisor 1.1 Fill out expense form 1.2 Submit expense form Administration Starting at top left with the start symbol. Draw processes along the swim lane, and use arrows to represent the sequence. Each process is given a number, and starts with a verb.
  • 9.
    Swap lanes andenter decision points 1.4.1 notification to employee 9 1.1 xyz 1.1 xyz 1.1 xyz 1.1 xyz Employee Supervisor 1.1 Fill out expense form 1.2 Submit expense form 1.3 Receive expense form No Administration When a process is performed by a different participant switch lanes. If the next step depends on a decision show this as in the example above, labelling the alternatives and showing the steps that follow. 1.5 Submit authorised expense form 1.4 Expenses Valid? Yes
  • 10.
    10 1.1 xyz 1.1 xyz 1.1 xyz 1.1 xyz Complete the process map Remove any unused swim lanes. Make sure there is one start point and all flows have an end point. Check that all decision points have all options labelled and have flow arrows to the next step. Review with participants for verification. An example of a completed process map is shown on the next slide.
  • 11.
    Business process 1– Process expense claim 11 1.1 xyz 1.1 xyz 1.1 xyz 1.1 xyz 1.1 Fill out expense form Employee Supervisor m m Administration 1.2 Submit expense form 1.3 Receive expense form 1.4 No Expenses Valid? Yes 1.5 Submit authorised expense form 1.6 Receive expense form 1.7 Log expense form 1.8 Make payment 1.4.1 notification to employee 1.8.1 notification to employee m m m m sol M = manual sol Sol = facilitated by solution