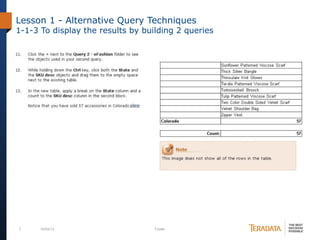
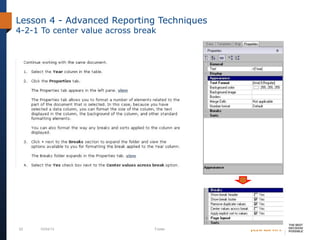
SAP Business Objects
Web Intelligence Advanced Report Design
training
Dmitry Anoshin
2 10/04/13 Footer
Content
Lesson 1 - Alternative Query Techniques
1) 1-1 Display the results by building 2 queries
2) 1-2 To use combined query
3) 1-3 To create sub-query
4) 1-4 To remove combined query
5) 1-5 To create a query based on another query
6) Lesson 1 task
Lesson 2 - Character and Date String Functions
1) 2-1 To replace a substring
2) 2-2 To complete the formula
3) 2-3 To display the data calculated by new variable
4) 2-4 To extract a substring using the Right() function
5) 2-5 To extract a substring using the Substr() function
6) 2-6 To use the POS () function
7) 2-7 To concatenate a string with a date
8) 2-8 To convert a string to a date value
9) 2-9 To create a date calculation
10)Lesson 2 task
3 10/04/13 Footer
Lesson 3 - Using If Logic
1) 3-1 To group values using If() function in a formula
2) 3-2 To use If() to show categories of values
3) 3-3 To display the grouped data in the report
4) 3-4 To display the grouped values in a chart
5) 3-5 To create variable that calculates revenue growth
6) 3-6 To calculate the data and project it in the table
7) Lesson 3 task
Lesson 4 - Advanced Reporting Techniques
1) 4-1 To view default break settings
2) 4-2 To center value across break
3) 4-3 To remove break headers and footers
4) 4-4 Setting the priority of multiple breaks in a table
5) 4-5 To use breaks with additional header rows
6) 4-6 To apply a break on a column header in a crosstab
7) 4-7 To create a custom sort
8) 4-8 Display the user response to a prompt
9) 4-9 Show prompt input with UserResponse()
10)4-10 Display the last refresh date in a cell
11)4-11 To use the NoFilter() function
12)Lesson 4 task
4 10/04/13 Footer
Lesson 5 - Calculation Contexts
1) 5-1 To redefine the output context
2) 5-2 Using the In context operator
3) 5-3 To use the In and Where context operators
4) 5-4 To use the ForEach context operator
5) 5-5 To use the ForAll context operator
6) 5-6 To calculate averages in a table
7) 5-7 To redefine the calculation context using In Block
8) 5-8 To build an alerter to highlight results
9) Lesson 5 task
5 10/04/13 Footer
Lesson 1 - Alternative Query Techniques
1-1-1 To display the results by building 2 queries
6 10/04/13 Footer
Lesson 1 - Alternative Query Techniques
1-1-2 To display the results by building 2 queries
7 10/04/13 Footer
Lesson 1 - Alternative Query Techniques
1-1-3 To display the results by building 2 queries
8 10/04/13 Footer
Lesson 1 - Alternative Query Techniques
1-2-1 To use combined query technique
9 10/04/13 Footer
Lesson 1 - Alternative Query Techniques
1-2-2 To use combined query technique
10 10/04/13 Footer
Lesson 1 - Alternative Query Techniques
1-2-3 To use combined query technique
11 10/04/13 Footer
Lesson 1 - Alternative Query Techniques
1-3-1 To create sub-query
12 10/04/13 Footer
Lesson 1 - Alternative Query Techniques
1-3-2 To create sub-query
13 10/04/13 Footer
Lesson 1 - Alternative Query Techniques
1-3-3 To create sub-query
14 10/04/13 Footer
Lesson 1 - Alternative Query Techniques
1-3-4 To create sub-query
15 10/04/13 Footer
Lesson 1 - Alternative Query Techniques
1-3-5 To create sub-query
16 10/04/13 Footer
Lesson 1 - Alternative Query Techniques
1-3-6 To create sub-query
17 10/04/13 Footer
Lesson 1 - Alternative Query Techniques
1-4 To remove combined query
18 10/04/13 Footer
Lesson 1 - Alternative Query Techniques
TASK
Create a new WebI report using the eFashion universe. Report should
contain 3 report sheets:
1)First report sheet should contain 1 table with “State”, “SKU Desc” and “Sales
Revenue” data from 2 different queries. First query contain data for state “Texas”
and for product line “City Skirts”, second query contain data for state “Colorado”
and for product line “Accessories”. Data from 2 queries should be merged into one
table. 3 columns with “Sales Revenue” should be created: 1-st shows data from
first query only, 2-nd from second and 3-rd from both queries together. Column
“State” should have descending sort. First report sheet format showed on next
slide.
19 10/04/13 Footer
Lesson 1 - Alternative Query Techniques
TASK – report first sheet format
20 10/04/13 Footer
Lesson 1 - Alternative Query Techniques
TASK
2)Second report sheet should contain 1 table with “SKU Desc” data only for
products which are available in both states – in “California” and in “Texas”.
Combined query should be used to get this data. Sheet format showed on next
slide.
21 10/04/13 Footer
Lesson 1 - Alternative Query Techniques
TASK – report second sheet format
22 10/04/13 Footer
Lesson 1 - Alternative Query Techniques
TASK
3)Third report sheet should contain 2 tables:
- first table contain “Store Name”, “Opening date”, “Sales floor size group”
and “Sales Revenue” data for stores which “Sales Revenue” is greater then “Sales
Revenue” for store “e-Fashion Chicago 33rd”. Sheet format showed on next slide.
- second table contain “Store Name” and “Sales Revenue” for store “e-
Fashion Chicago 33rd”.
Task should be done with using of sub-query functionality.
23 10/04/13 Footer
Lesson 1 - Alternative Query Techniques
TASK – report third sheet format
24 10/04/13 Footer
Lesson 2 - Character and Date String Functions
2-1-1 To replace a substring
25 10/04/13 Footer
Lesson 2 - Character and Date String Functions
2-1-2 To replace a substring
26 10/04/13 Footer
Lesson 2 - Character and Date String Functions
2-2-1 To complete the formula
27 10/04/13 Footer
Lesson 2 - Character and Date String Functions
2-2-2 To complete the formula
28 10/04/13 Footer
Lesson 2 - Character and Date String Functions
2-3 To display the data calculated by new variable
29 10/04/13 Footer
Lesson 2 - Character and Date String Functions
2-4-1 To extract a substring using the Right() function
30 10/04/13 Footer
Lesson 2 - Character and Date String Functions
2-4-2 To extract a substring using the Right() function
31 10/04/13 Footer
Lesson 2 - Character and Date String Functions
2-5 To extract a substring using the Substr() function
32 10/04/13 Footer
Lesson 2 - Character and Date String Functions
2-6-1 To use the Pos() function
33 10/04/13 Footer
Lesson 2 - Character and Date String Functions
2-6-2 To use the Pos() function
34 10/04/13 Footer
Lesson 2 - Character and Date String Functions
2-6-3 To use the Pos() function
35 10/04/13 Footer
Lesson 2 - Character and Date String Functions
2-6-4 To use the Pos() function
36 10/04/13 Footer
Lesson 2 - Character and Date String Functions
2-7-1 To concatenate a string with a date
37 10/04/13 Footer
Lesson 2 - Character and Date String Functions
2-7-2 To concatenate a string with a date
38 10/04/13 Footer
Lesson 2 - Character and Date String
Functions
2-8-1 To convert a string to a date value
39 10/04/13 Footer
Lesson 2 - Character and Date String Functions
2-8-2 To convert a string to a date value
40 10/04/13 Footer
Lesson 2 - Character and Date String Functions
2-9 To create a date calculation
41 10/04/13 Footer
Lesson 2 - Character and Date String Functions
TASK
Create a report using eFashion universe. Report should have 1 report
with 1 table and should contain following data:
1)Filter - data for December 2003 only
2)Report title – text “Current date” and current date in format showed
on next screenshot
3)Columns are showed on next screenshot. Columns “State – Store
Name”, “1st day in month”, “Days Between 1st date in month and
Current Date” contain calculated values:
- “State – Store Name” should contain data from 2 dimensions: “State”
and “Store Name”. Concatenation(), Pos(), Length() and Substr() functions should
be used to calculate this value.
- “1st date in month” should contain date value (data type =
date) with first day of month created from “Month” and “Year”
dimensions with format showed on next slide.
- “Days Between 1st date in month and Current Date” contain quantity
days between “1st date in month” and current date.
42 10/04/13 Footer
Lesson 2 - Character and Date String Functions
TASK
43 10/04/13 Footer
Lesson 3 - Using If Logic
3-1-1 To group values using If() function in a
formula
44 10/04/13 Footer
Lesson 3 - Using If Logic
3-1-2 To group values using If() function in a
formula
45 10/04/13 Footer
Lesson 3 - Using If Logic
3-1-3 To group values using If() function in a
formula
46 10/04/13 Footer
Lesson 3 - Using If Logic
3-2-1 To use If() to show categories of values
47 10/04/13 Footer
Lesson 3 - Using If Logic
3-2-2 To use If() to show categories of values
48 10/04/13 Footer
Lesson 3 - Using If Logic
3-2-3 To use If() to show categories of values
49 10/04/13 Footer
Lesson 3 - Using If Logic
3-2-4 To use If() to show categories of values
50 10/04/13 Footer
Lesson 3 - Using If Logic
3-3 To display the grouped data in the report
51 10/04/13 Footer
Lesson 3 - Using If Logic
3-4-1 To display the grouped values in a chart
52 10/04/13 Footer
Lesson 3 - Using If Logic
3-4-2 To display the grouped values in a chart
53 10/04/13 Footer
Lesson 3 - Using If Logic
3-5-1 To create variable that calculates revenue
growth
54 10/04/13 Footer
Lesson 3 - Using If Logic
3-5-2 To create variable that calculates revenue
growth
55 10/04/13 Footer
Lesson 3 - Using If Logic
3-6-1 To calculate the data and project it in the
table
56 10/04/13 Footer
Lesson 3 - Using If Logic
3-6-2 To calculate the data and project it in the
table
57 10/04/13 Footer
Lesson 3 - Using If Logic
TASK
Create a new WebI report using “eFashion” universe. Report should contain data
for year 2003 and for states “California”, “Florida” and “Texas” only.
You should create next:
- Variable “Var_Quarter” which will contain quarter values and will be constructed
from “Month” dimension using “If” logic (see report format on next slide);
- Variable “Special Sales Revenue” will contain formula which provides “Sales
Revenue / 100” for even values of “Month” dimension and “Sales Revenue” for all other “Month”
values;
- “% Sales revenue from Total” column contain % of sales revenue for month in total sales revenue
for quarter.
- “3D Pie” chart which shows sales revenue by quarters for year 2003.
- All report objects should be split by sections by “State” dimension;
- Report table should be done with breaks, subtotals and values format as showed on next slide.
58 10/04/13 Footer
Lesson 3 - Using If Logic
TASK
59 10/04/13 Footer
Lesson 4 - Advanced Reporting Techniques
4-1-1 To view default break settings
60 10/04/13 Footer
Lesson 4 - Advanced Reporting Techniques
4-1-2 To view default break settings
61 10/04/13 Footer
Lesson 4 - Advanced Reporting Techniques
4-1-3 To view default break settings
62 10/04/13 Footer
Lesson 4 - Advanced Reporting Techniques
4-2-1 To center value across break
63 10/04/13 Footer
Lesson 4 - Advanced Reporting Techniques
4-2-2 To center value across break
64 10/04/13 Footer
Lesson 4 - Advanced Reporting Techniques
4-3 To remove break headers and footers
65 10/04/13 Footer
Lesson 4 - Advanced Reporting Techniques
4-4-1 Setting the priority of multiple breaks in a table
66 10/04/13 Footer
Lesson 4 - Advanced Reporting Techniques
4-4-2 Setting the priority of multiple breaks in a table
67 10/04/13 Footer
Lesson 4 - Advanced Reporting Techniques
4-4-3 Setting the priority of multiple breaks in a table
68 10/04/13 Footer
Lesson 4 - Advanced Reporting Techniques
4-5-1 To use breaks with additional header rows
69 10/04/13 Footer
Lesson 4 - Advanced Reporting Techniques
4-5-2 To use breaks with additional header rows
70 10/04/13 Footer
Lesson 4 - Advanced Reporting Techniques
4-5-3 To use breaks with additional header rows
71 10/04/13 Footer
Lesson 4 - Advanced Reporting Techniques
4-6-1 To apply a break on a column header in a
crosstab
72 10/04/13 Footer
Lesson 4 - Advanced Reporting Techniques
4-6-2 To apply a break on a column header in a
crosstab
73 10/04/13 Footer
Lesson 4 - Advanced Reporting Techniques
4-7-1 To create a custom sort
74 10/04/13 Footer
Lesson 4 - Advanced Reporting Techniques
4-7-2 To create a custom sort
75 10/04/13 Footer
Lesson 4 - Advanced Reporting Techniques
4-8 Display the user response to a prompt
76 10/04/13 Footer
Lesson 4 - Advanced Reporting Techniques
4-9 Show prompt input with UserResponse()
77 10/04/13 Footer
Lesson 4 - Advanced Reporting Techniques
4-10 Display the last refresh date in a cell
78 10/04/13 Footer
Lesson 4 - Advanced Reporting Techniques
4-11-1 To use the NoFilter() function
79 10/04/13 Footer
Lesson 4 - Advanced Reporting Techniques
4-11-2 To use the NoFilter() function
80 10/04/13 Footer
Lesson 4 - Advanced Reporting Techniques
4-11-3 To use the NoFilter() function
81 10/04/13 Footer
Lesson 4 - Advanced Reporting Techniques
4-11-4 To use the NoFilter() function
82 10/04/13 Footer
Lesson 4 - Advanced Reporting Techniques
4-11-5 To use the NoFilter() function
83 10/04/13 Footer
Lesson 4 - Advanced Reporting Techniques
TASK
Create a new report based on “eFashion” universe. Report
should have 3 report sheets with 2 titles showing “report
filters” (based on user prompt) and “report last refresh date”.
User prompt “Year” should be created in report.
1) First report sheet contain 2 equal tables. Each table contain 2
breaks: by “Year” dimension and “Quarter” dimension. First
table should contain following break order: 1 – Year, 2 –
Quarter. Second table contain inversely break order. Table data
should be formatted as it is showed on next slide.
84 10/04/13 Footer
Lesson 4 - Advanced Reporting Techniques
TASK
85 10/04/13 Footer
Lesson 4 - Advanced Reporting Techniques
TASK
2) Second report sheet contain cross-table with “Quantity” and
“Sales Revenue” measures grouped by “Year”, “Month”, “State”
and “Store Name” dimension. Table data should be formatted
using “breaks”. You need to create year subtotals columns.
Custom sort should be created for “State” column (see next
slide for). Table format and “State” column values order are showed on
next 2 slides.
86 10/04/13 Footer
Lesson 4 - Advanced Reporting Techniques
TASK
87 10/04/13 Footer
Lesson 4 - Advanced Reporting Techniques
TASK
88 10/04/13 Footer
Lesson 4 - Advanced Reporting Techniques
TASK
3) Third report sheet contains 2 tables.
- First table contain data for top 4 stores based on “Quantity
sold” measure. Ranking should be used to filter data in table. 3
totals need to be created (use NoFilter() function):
- “Top 4 total” – sum of quantity sold for 4 top stores in
report;
- “Other Stores total” – sum of quantity sold for all stores in
report
excluding 4 top stores;
- “Total for all Stores” - sum of quantity sold for all stores in
report.
- Second table shows data aggregated in context of “State”
dimension. Table has filter: stores “Boston Newbury”, “New
York 5th”, “Washington Tolbooth” and “Houston Leighton” are
excluded from table. Column “Quantity sold” contain filtered
data and column “NoFilter (Quantity sold)” show all data
ignoring table filter. Alerter which will show rows with
89 10/04/13 Footer
Lesson 4 - Advanced Reporting Techniques
TASK
90 10/04/13 Footer
Lesson 5 - Calculation Contexts
5-1-1 To redefine the output context
91 10/04/13 Footer
Lesson 5 - Calculation Contexts
5-1-2 To redefine the output context
92 10/04/13 Footer
Lesson 5 - Calculation Contexts
5-1-3 To redefine the output context
93 10/04/13 Footer
Lesson 5 - Calculation Contexts
5-1-4 To redefine the output context
94 10/04/13 Footer
Lesson 5 - Calculation Contexts
5-1-5 To redefine the output context
95 10/04/13 Footer
Lesson 5 - Calculation Contexts
5-2 Using the In context operator
96 10/04/13 Footer
Lesson 5 - Calculation Contexts
5-3-1 To use the In and Where context operators
97 10/04/13 Footer
Lesson 5 - Calculation Contexts
5-3-2 To use the In and Where context operators
98 10/04/13 Footer
Lesson 5 - Calculation Contexts
5-3-3 To use the In and Where context operators
99 10/04/13 Footer
Lesson 5 - Calculation Contexts
5-4 To use the ForEach context operator
100 10/04/13 Footer
Lesson 5 - Calculation Contexts
5-5-1 To use the ForAll context operator
101 10/04/13 Footer
Lesson 5 - Calculation Contexts
5-5-2 To use the ForAll context operator
102 10/04/13 Footer
Lesson 5 - Calculation Contexts
5-6-1 To calculate averages in a table
103 10/04/13 Footer
Lesson 5 - Calculation Contexts
5-6-2 To calculate averages in a table
104 10/04/13 Footer
Lesson 5 - Calculation Contexts
5-6-3 To calculate averages in a table
105 10/04/13 Footer
Lesson 5 - Calculation Contexts
5-7 To redefine the calculation context using In Block
106 10/04/13 Footer
Lesson 5 - Calculation Contexts
5-8-1 To build an alerter to highlight results
107 10/04/13 Footer
Lesson 5 - Calculation Contexts
5-8-2 To build an alerter to highlight results
108 10/04/13 Footer
Lesson 5 - Calculation Contexts
5-8-3 To build an alerter to highlight results
109 10/04/13 Footer
Lesson 5 - Calculation Contexts
5-8-4 To build an alerter to highlight results
110 10/04/13 Footer
Lesson 5 - Calculation Contexts
TASK
Create a report based on “eFashion” universe. Report should contain 2
report sheets.
1)First sheet consists of 2 tables:
- Table 1 contains “Store name”, “Sales revenue” and 3
calculated columns created using context operators. Column “Max Sales
revenue using "In" (2001)” shows maximum of monthly sales revenue
in year 2001 for every store (operator “In” used). Column “Max Sales
revenue using In” shows maximum of monthly sales for all time for
every store (operator “In” used). Column “Max Sales revenue using “ForEach“”
shows the same values as “Max Sales revenue using In” column but operator
“ForEach” is used instead “In”.
- Table 2 contains “Store name”, “Year”, “Month”, “Sales revenue” and
“Sales revenue in Year” which shows total sales revenue per year for each store. For
second table 2 alerters needs to be created. First marks rows with maximum monthly
sales revenue for each store for all time (red background, white font). Second marks
rows with maximum monthly sales revenue for each store for year 2001 (green
background). Rows with maximum monthly sales revenue for each store for all time
should be first rows in the table sorted by “Store name” dimension (see next
screenshot). All other rows should have default sorting.
111 10/04/13 Footer
Lesson 5 - Calculation Contexts
TASK
112 10/04/13 Footer
Lesson 5 - Calculation Contexts
TASK
2) Second sheet contain 1 table. Table has “State”, “Sales revenue” and
3 calculated columns.
- “Average in year and month (amount / quantity rows)” column
shows average monthly sales revenue for state. This value is
calculated without using average() function.
- “Average in Table” column shows average sales revenue in table.
Average() function is used.
- “Average in year and month” shows average monthly sales revenue for
every state.
Table should contain total average for sales revenue. It is equal to
“Average in Table” column.
Report format is presented on next slide.
113 10/04/13 Footer
Lesson 5 - Calculation Contexts
TASK
Thank you!

Business objects web intelligence training tasks

  • 1.
    SAP Business Objects WebIntelligence Advanced Report Design training Dmitry Anoshin
  • 2.
    2 10/04/13 Footer Content Lesson1 - Alternative Query Techniques 1) 1-1 Display the results by building 2 queries 2) 1-2 To use combined query 3) 1-3 To create sub-query 4) 1-4 To remove combined query 5) 1-5 To create a query based on another query 6) Lesson 1 task Lesson 2 - Character and Date String Functions 1) 2-1 To replace a substring 2) 2-2 To complete the formula 3) 2-3 To display the data calculated by new variable 4) 2-4 To extract a substring using the Right() function 5) 2-5 To extract a substring using the Substr() function 6) 2-6 To use the POS () function 7) 2-7 To concatenate a string with a date 8) 2-8 To convert a string to a date value 9) 2-9 To create a date calculation 10)Lesson 2 task
  • 3.
    3 10/04/13 Footer Lesson3 - Using If Logic 1) 3-1 To group values using If() function in a formula 2) 3-2 To use If() to show categories of values 3) 3-3 To display the grouped data in the report 4) 3-4 To display the grouped values in a chart 5) 3-5 To create variable that calculates revenue growth 6) 3-6 To calculate the data and project it in the table 7) Lesson 3 task Lesson 4 - Advanced Reporting Techniques 1) 4-1 To view default break settings 2) 4-2 To center value across break 3) 4-3 To remove break headers and footers 4) 4-4 Setting the priority of multiple breaks in a table 5) 4-5 To use breaks with additional header rows 6) 4-6 To apply a break on a column header in a crosstab 7) 4-7 To create a custom sort 8) 4-8 Display the user response to a prompt 9) 4-9 Show prompt input with UserResponse() 10)4-10 Display the last refresh date in a cell 11)4-11 To use the NoFilter() function 12)Lesson 4 task
  • 4.
    4 10/04/13 Footer Lesson5 - Calculation Contexts 1) 5-1 To redefine the output context 2) 5-2 Using the In context operator 3) 5-3 To use the In and Where context operators 4) 5-4 To use the ForEach context operator 5) 5-5 To use the ForAll context operator 6) 5-6 To calculate averages in a table 7) 5-7 To redefine the calculation context using In Block 8) 5-8 To build an alerter to highlight results 9) Lesson 5 task
  • 5.
    5 10/04/13 Footer Lesson1 - Alternative Query Techniques 1-1-1 To display the results by building 2 queries
  • 6.
    6 10/04/13 Footer Lesson1 - Alternative Query Techniques 1-1-2 To display the results by building 2 queries
  • 7.
    7 10/04/13 Footer Lesson1 - Alternative Query Techniques 1-1-3 To display the results by building 2 queries
  • 8.
    8 10/04/13 Footer Lesson1 - Alternative Query Techniques 1-2-1 To use combined query technique
  • 9.
    9 10/04/13 Footer Lesson1 - Alternative Query Techniques 1-2-2 To use combined query technique
  • 10.
    10 10/04/13 Footer Lesson1 - Alternative Query Techniques 1-2-3 To use combined query technique
  • 11.
    11 10/04/13 Footer Lesson1 - Alternative Query Techniques 1-3-1 To create sub-query
  • 12.
    12 10/04/13 Footer Lesson1 - Alternative Query Techniques 1-3-2 To create sub-query
  • 13.
    13 10/04/13 Footer Lesson1 - Alternative Query Techniques 1-3-3 To create sub-query
  • 14.
    14 10/04/13 Footer Lesson1 - Alternative Query Techniques 1-3-4 To create sub-query
  • 15.
    15 10/04/13 Footer Lesson1 - Alternative Query Techniques 1-3-5 To create sub-query
  • 16.
    16 10/04/13 Footer Lesson1 - Alternative Query Techniques 1-3-6 To create sub-query
  • 17.
    17 10/04/13 Footer Lesson1 - Alternative Query Techniques 1-4 To remove combined query
  • 18.
    18 10/04/13 Footer Lesson1 - Alternative Query Techniques TASK Create a new WebI report using the eFashion universe. Report should contain 3 report sheets: 1)First report sheet should contain 1 table with “State”, “SKU Desc” and “Sales Revenue” data from 2 different queries. First query contain data for state “Texas” and for product line “City Skirts”, second query contain data for state “Colorado” and for product line “Accessories”. Data from 2 queries should be merged into one table. 3 columns with “Sales Revenue” should be created: 1-st shows data from first query only, 2-nd from second and 3-rd from both queries together. Column “State” should have descending sort. First report sheet format showed on next slide.
  • 19.
    19 10/04/13 Footer Lesson1 - Alternative Query Techniques TASK – report first sheet format
  • 20.
    20 10/04/13 Footer Lesson1 - Alternative Query Techniques TASK 2)Second report sheet should contain 1 table with “SKU Desc” data only for products which are available in both states – in “California” and in “Texas”. Combined query should be used to get this data. Sheet format showed on next slide.
  • 21.
    21 10/04/13 Footer Lesson1 - Alternative Query Techniques TASK – report second sheet format
  • 22.
    22 10/04/13 Footer Lesson1 - Alternative Query Techniques TASK 3)Third report sheet should contain 2 tables: - first table contain “Store Name”, “Opening date”, “Sales floor size group” and “Sales Revenue” data for stores which “Sales Revenue” is greater then “Sales Revenue” for store “e-Fashion Chicago 33rd”. Sheet format showed on next slide. - second table contain “Store Name” and “Sales Revenue” for store “e- Fashion Chicago 33rd”. Task should be done with using of sub-query functionality.
  • 23.
    23 10/04/13 Footer Lesson1 - Alternative Query Techniques TASK – report third sheet format
  • 24.
    24 10/04/13 Footer Lesson2 - Character and Date String Functions 2-1-1 To replace a substring
  • 25.
    25 10/04/13 Footer Lesson2 - Character and Date String Functions 2-1-2 To replace a substring
  • 26.
    26 10/04/13 Footer Lesson2 - Character and Date String Functions 2-2-1 To complete the formula
  • 27.
    27 10/04/13 Footer Lesson2 - Character and Date String Functions 2-2-2 To complete the formula
  • 28.
    28 10/04/13 Footer Lesson2 - Character and Date String Functions 2-3 To display the data calculated by new variable
  • 29.
    29 10/04/13 Footer Lesson2 - Character and Date String Functions 2-4-1 To extract a substring using the Right() function
  • 30.
    30 10/04/13 Footer Lesson2 - Character and Date String Functions 2-4-2 To extract a substring using the Right() function
  • 31.
    31 10/04/13 Footer Lesson2 - Character and Date String Functions 2-5 To extract a substring using the Substr() function
  • 32.
    32 10/04/13 Footer Lesson2 - Character and Date String Functions 2-6-1 To use the Pos() function
  • 33.
    33 10/04/13 Footer Lesson2 - Character and Date String Functions 2-6-2 To use the Pos() function
  • 34.
    34 10/04/13 Footer Lesson2 - Character and Date String Functions 2-6-3 To use the Pos() function
  • 35.
    35 10/04/13 Footer Lesson2 - Character and Date String Functions 2-6-4 To use the Pos() function
  • 36.
    36 10/04/13 Footer Lesson2 - Character and Date String Functions 2-7-1 To concatenate a string with a date
  • 37.
    37 10/04/13 Footer Lesson2 - Character and Date String Functions 2-7-2 To concatenate a string with a date
  • 38.
    38 10/04/13 Footer Lesson2 - Character and Date String Functions 2-8-1 To convert a string to a date value
  • 39.
    39 10/04/13 Footer Lesson2 - Character and Date String Functions 2-8-2 To convert a string to a date value
  • 40.
    40 10/04/13 Footer Lesson2 - Character and Date String Functions 2-9 To create a date calculation
  • 41.
    41 10/04/13 Footer Lesson2 - Character and Date String Functions TASK Create a report using eFashion universe. Report should have 1 report with 1 table and should contain following data: 1)Filter - data for December 2003 only 2)Report title – text “Current date” and current date in format showed on next screenshot 3)Columns are showed on next screenshot. Columns “State – Store Name”, “1st day in month”, “Days Between 1st date in month and Current Date” contain calculated values: - “State – Store Name” should contain data from 2 dimensions: “State” and “Store Name”. Concatenation(), Pos(), Length() and Substr() functions should be used to calculate this value. - “1st date in month” should contain date value (data type = date) with first day of month created from “Month” and “Year” dimensions with format showed on next slide. - “Days Between 1st date in month and Current Date” contain quantity days between “1st date in month” and current date.
  • 42.
    42 10/04/13 Footer Lesson2 - Character and Date String Functions TASK
  • 43.
    43 10/04/13 Footer Lesson3 - Using If Logic 3-1-1 To group values using If() function in a formula
  • 44.
    44 10/04/13 Footer Lesson3 - Using If Logic 3-1-2 To group values using If() function in a formula
  • 45.
    45 10/04/13 Footer Lesson3 - Using If Logic 3-1-3 To group values using If() function in a formula
  • 46.
    46 10/04/13 Footer Lesson3 - Using If Logic 3-2-1 To use If() to show categories of values
  • 47.
    47 10/04/13 Footer Lesson3 - Using If Logic 3-2-2 To use If() to show categories of values
  • 48.
    48 10/04/13 Footer Lesson3 - Using If Logic 3-2-3 To use If() to show categories of values
  • 49.
    49 10/04/13 Footer Lesson3 - Using If Logic 3-2-4 To use If() to show categories of values
  • 50.
    50 10/04/13 Footer Lesson3 - Using If Logic 3-3 To display the grouped data in the report
  • 51.
    51 10/04/13 Footer Lesson3 - Using If Logic 3-4-1 To display the grouped values in a chart
  • 52.
    52 10/04/13 Footer Lesson3 - Using If Logic 3-4-2 To display the grouped values in a chart
  • 53.
    53 10/04/13 Footer Lesson3 - Using If Logic 3-5-1 To create variable that calculates revenue growth
  • 54.
    54 10/04/13 Footer Lesson3 - Using If Logic 3-5-2 To create variable that calculates revenue growth
  • 55.
    55 10/04/13 Footer Lesson3 - Using If Logic 3-6-1 To calculate the data and project it in the table
  • 56.
    56 10/04/13 Footer Lesson3 - Using If Logic 3-6-2 To calculate the data and project it in the table
  • 57.
    57 10/04/13 Footer Lesson3 - Using If Logic TASK Create a new WebI report using “eFashion” universe. Report should contain data for year 2003 and for states “California”, “Florida” and “Texas” only. You should create next: - Variable “Var_Quarter” which will contain quarter values and will be constructed from “Month” dimension using “If” logic (see report format on next slide); - Variable “Special Sales Revenue” will contain formula which provides “Sales Revenue / 100” for even values of “Month” dimension and “Sales Revenue” for all other “Month” values; - “% Sales revenue from Total” column contain % of sales revenue for month in total sales revenue for quarter. - “3D Pie” chart which shows sales revenue by quarters for year 2003. - All report objects should be split by sections by “State” dimension; - Report table should be done with breaks, subtotals and values format as showed on next slide.
  • 58.
    58 10/04/13 Footer Lesson3 - Using If Logic TASK
  • 59.
    59 10/04/13 Footer Lesson4 - Advanced Reporting Techniques 4-1-1 To view default break settings
  • 60.
    60 10/04/13 Footer Lesson4 - Advanced Reporting Techniques 4-1-2 To view default break settings
  • 61.
    61 10/04/13 Footer Lesson4 - Advanced Reporting Techniques 4-1-3 To view default break settings
  • 62.
    62 10/04/13 Footer Lesson4 - Advanced Reporting Techniques 4-2-1 To center value across break
  • 63.
    63 10/04/13 Footer Lesson4 - Advanced Reporting Techniques 4-2-2 To center value across break
  • 64.
    64 10/04/13 Footer Lesson4 - Advanced Reporting Techniques 4-3 To remove break headers and footers
  • 65.
    65 10/04/13 Footer Lesson4 - Advanced Reporting Techniques 4-4-1 Setting the priority of multiple breaks in a table
  • 66.
    66 10/04/13 Footer Lesson4 - Advanced Reporting Techniques 4-4-2 Setting the priority of multiple breaks in a table
  • 67.
    67 10/04/13 Footer Lesson4 - Advanced Reporting Techniques 4-4-3 Setting the priority of multiple breaks in a table
  • 68.
    68 10/04/13 Footer Lesson4 - Advanced Reporting Techniques 4-5-1 To use breaks with additional header rows
  • 69.
    69 10/04/13 Footer Lesson4 - Advanced Reporting Techniques 4-5-2 To use breaks with additional header rows
  • 70.
    70 10/04/13 Footer Lesson4 - Advanced Reporting Techniques 4-5-3 To use breaks with additional header rows
  • 71.
    71 10/04/13 Footer Lesson4 - Advanced Reporting Techniques 4-6-1 To apply a break on a column header in a crosstab
  • 72.
    72 10/04/13 Footer Lesson4 - Advanced Reporting Techniques 4-6-2 To apply a break on a column header in a crosstab
  • 73.
    73 10/04/13 Footer Lesson4 - Advanced Reporting Techniques 4-7-1 To create a custom sort
  • 74.
    74 10/04/13 Footer Lesson4 - Advanced Reporting Techniques 4-7-2 To create a custom sort
  • 75.
    75 10/04/13 Footer Lesson4 - Advanced Reporting Techniques 4-8 Display the user response to a prompt
  • 76.
    76 10/04/13 Footer Lesson4 - Advanced Reporting Techniques 4-9 Show prompt input with UserResponse()
  • 77.
    77 10/04/13 Footer Lesson4 - Advanced Reporting Techniques 4-10 Display the last refresh date in a cell
  • 78.
    78 10/04/13 Footer Lesson4 - Advanced Reporting Techniques 4-11-1 To use the NoFilter() function
  • 79.
    79 10/04/13 Footer Lesson4 - Advanced Reporting Techniques 4-11-2 To use the NoFilter() function
  • 80.
    80 10/04/13 Footer Lesson4 - Advanced Reporting Techniques 4-11-3 To use the NoFilter() function
  • 81.
    81 10/04/13 Footer Lesson4 - Advanced Reporting Techniques 4-11-4 To use the NoFilter() function
  • 82.
    82 10/04/13 Footer Lesson4 - Advanced Reporting Techniques 4-11-5 To use the NoFilter() function
  • 83.
    83 10/04/13 Footer Lesson4 - Advanced Reporting Techniques TASK Create a new report based on “eFashion” universe. Report should have 3 report sheets with 2 titles showing “report filters” (based on user prompt) and “report last refresh date”. User prompt “Year” should be created in report. 1) First report sheet contain 2 equal tables. Each table contain 2 breaks: by “Year” dimension and “Quarter” dimension. First table should contain following break order: 1 – Year, 2 – Quarter. Second table contain inversely break order. Table data should be formatted as it is showed on next slide.
  • 84.
    84 10/04/13 Footer Lesson4 - Advanced Reporting Techniques TASK
  • 85.
    85 10/04/13 Footer Lesson4 - Advanced Reporting Techniques TASK 2) Second report sheet contain cross-table with “Quantity” and “Sales Revenue” measures grouped by “Year”, “Month”, “State” and “Store Name” dimension. Table data should be formatted using “breaks”. You need to create year subtotals columns. Custom sort should be created for “State” column (see next slide for). Table format and “State” column values order are showed on next 2 slides.
  • 86.
    86 10/04/13 Footer Lesson4 - Advanced Reporting Techniques TASK
  • 87.
    87 10/04/13 Footer Lesson4 - Advanced Reporting Techniques TASK
  • 88.
    88 10/04/13 Footer Lesson4 - Advanced Reporting Techniques TASK 3) Third report sheet contains 2 tables. - First table contain data for top 4 stores based on “Quantity sold” measure. Ranking should be used to filter data in table. 3 totals need to be created (use NoFilter() function): - “Top 4 total” – sum of quantity sold for 4 top stores in report; - “Other Stores total” – sum of quantity sold for all stores in report excluding 4 top stores; - “Total for all Stores” - sum of quantity sold for all stores in report. - Second table shows data aggregated in context of “State” dimension. Table has filter: stores “Boston Newbury”, “New York 5th”, “Washington Tolbooth” and “Houston Leighton” are excluded from table. Column “Quantity sold” contain filtered data and column “NoFilter (Quantity sold)” show all data ignoring table filter. Alerter which will show rows with
  • 89.
    89 10/04/13 Footer Lesson4 - Advanced Reporting Techniques TASK
  • 90.
    90 10/04/13 Footer Lesson5 - Calculation Contexts 5-1-1 To redefine the output context
  • 91.
    91 10/04/13 Footer Lesson5 - Calculation Contexts 5-1-2 To redefine the output context
  • 92.
    92 10/04/13 Footer Lesson5 - Calculation Contexts 5-1-3 To redefine the output context
  • 93.
    93 10/04/13 Footer Lesson5 - Calculation Contexts 5-1-4 To redefine the output context
  • 94.
    94 10/04/13 Footer Lesson5 - Calculation Contexts 5-1-5 To redefine the output context
  • 95.
    95 10/04/13 Footer Lesson5 - Calculation Contexts 5-2 Using the In context operator
  • 96.
    96 10/04/13 Footer Lesson5 - Calculation Contexts 5-3-1 To use the In and Where context operators
  • 97.
    97 10/04/13 Footer Lesson5 - Calculation Contexts 5-3-2 To use the In and Where context operators
  • 98.
    98 10/04/13 Footer Lesson5 - Calculation Contexts 5-3-3 To use the In and Where context operators
  • 99.
    99 10/04/13 Footer Lesson5 - Calculation Contexts 5-4 To use the ForEach context operator
  • 100.
    100 10/04/13 Footer Lesson5 - Calculation Contexts 5-5-1 To use the ForAll context operator
  • 101.
    101 10/04/13 Footer Lesson5 - Calculation Contexts 5-5-2 To use the ForAll context operator
  • 102.
    102 10/04/13 Footer Lesson5 - Calculation Contexts 5-6-1 To calculate averages in a table
  • 103.
    103 10/04/13 Footer Lesson5 - Calculation Contexts 5-6-2 To calculate averages in a table
  • 104.
    104 10/04/13 Footer Lesson5 - Calculation Contexts 5-6-3 To calculate averages in a table
  • 105.
    105 10/04/13 Footer Lesson5 - Calculation Contexts 5-7 To redefine the calculation context using In Block
  • 106.
    106 10/04/13 Footer Lesson5 - Calculation Contexts 5-8-1 To build an alerter to highlight results
  • 107.
    107 10/04/13 Footer Lesson5 - Calculation Contexts 5-8-2 To build an alerter to highlight results
  • 108.
    108 10/04/13 Footer Lesson5 - Calculation Contexts 5-8-3 To build an alerter to highlight results
  • 109.
    109 10/04/13 Footer Lesson5 - Calculation Contexts 5-8-4 To build an alerter to highlight results
  • 110.
    110 10/04/13 Footer Lesson5 - Calculation Contexts TASK Create a report based on “eFashion” universe. Report should contain 2 report sheets. 1)First sheet consists of 2 tables: - Table 1 contains “Store name”, “Sales revenue” and 3 calculated columns created using context operators. Column “Max Sales revenue using "In" (2001)” shows maximum of monthly sales revenue in year 2001 for every store (operator “In” used). Column “Max Sales revenue using In” shows maximum of monthly sales for all time for every store (operator “In” used). Column “Max Sales revenue using “ForEach“” shows the same values as “Max Sales revenue using In” column but operator “ForEach” is used instead “In”. - Table 2 contains “Store name”, “Year”, “Month”, “Sales revenue” and “Sales revenue in Year” which shows total sales revenue per year for each store. For second table 2 alerters needs to be created. First marks rows with maximum monthly sales revenue for each store for all time (red background, white font). Second marks rows with maximum monthly sales revenue for each store for year 2001 (green background). Rows with maximum monthly sales revenue for each store for all time should be first rows in the table sorted by “Store name” dimension (see next screenshot). All other rows should have default sorting.
  • 111.
    111 10/04/13 Footer Lesson5 - Calculation Contexts TASK
  • 112.
    112 10/04/13 Footer Lesson5 - Calculation Contexts TASK 2) Second sheet contain 1 table. Table has “State”, “Sales revenue” and 3 calculated columns. - “Average in year and month (amount / quantity rows)” column shows average monthly sales revenue for state. This value is calculated without using average() function. - “Average in Table” column shows average sales revenue in table. Average() function is used. - “Average in year and month” shows average monthly sales revenue for every state. Table should contain total average for sales revenue. It is equal to “Average in Table” column. Report format is presented on next slide.
  • 113.
    113 10/04/13 Footer Lesson5 - Calculation Contexts TASK
  • 114.