SlideShare a Scribd company logo
1 of 55
1
Business economics (3)
Consumable equilibrium
Consumer’s Equilibrium through Utility:
A consumer is one who buys goods and services for
his/her personal satisfaction. In theoretical terms, consumer’s
equilibrium is achieved at a point when he/she reaches to the
maximum level of his/her satisfaction, given resources and other
conditions. On the other hand, in technical terms, a consumer
reaches his maximum satisfaction level when the last unit of
money spent on each good yield the same utility.
Let us take an example of one good to explain how a consumer
reaches equilibrium.
Suppose a consumer consumes only one good X
with a given income. He has two options either to spend income
to purchase good X or retain it in the form of an asset. If the MU
of good X (MUx) is greater than MU of money (MUm), the
consumer would purchase the good.
Therefore, the consumer would spend his income
on good X as long as utility of a good is greater than the price of
a good, which implies MUx > Px (MUm). Here, the assumption
is that MU of a good diminishes as more and more unit of the
good is consumed and MU of money remains constant that is
MUm=1.
Thus, consumer reaches equilibrium when:
MUx = Px(MUm)
Or
Mux/Px (MUm) = 1
2
The consumer’s equilibrium is shown graphically in Figure-
4:
As shown in Figure-4, the horizontal line Px
shows the constant utility of money and MUx curve represents
the diminishing marginal utility of a good. The intersection of
MUx and Px curve takes place at E that is when quantity
consumed is OQx, then MUx=Px(MUm).
Thus, consumer achieves equilibrium at E.
Above point E, MUx > Px(MUm) implying that a consumer
increase the consumption of good as utility achieved is more. At
point R, consumer gains MU as RC where cost incurred is TC.
Thus, marginal gain is RT and this situation exists till a
consumer reaches point E.
If we look at the point below point E, where
MUx < Px (MUm), a consumer would consume more than OQx
and loses utility. Thus, satisfaction is increased by reducing the
consumption. Therefore, point E is the equilibrium point.
In real life, a consumer consumes a large
amount of goods, thus question arises how a consumer achieves
equilibrium in case of a number of goods. A rational consumer
consumes goods according to the preference. He/she would first
3
purchase the good that yields the highest utility followed by the
good yielding second highest utility. The expenditure is
switched from one good to another till a stage is reached when
MU of each good is same per unit of expenditure. This is called
law of equi-marginal utility.
Let us discuss consumer equilibrium in case of two goods X and
Y whose prices are Px and Py, respectively.
Consumer’s equilibrium is given as:
MUx=Px (MUm)
And MUy=Py(MUm)
The consumer’s equilibrium is expressed as:
MUx/Px(MUx) = 1 = MUy/Py(MUy)
It can be further rewritten as:
MUx/Px = MUy/Py
The aforementioned equation implies that a consumer reaches
the equilibrium when MU derived from each rupees spent on
two goods is same.
or
MUx/MUy = Px/Py
The aforementioned equation implies that a consumer is in
equilibrium when MU ratio of any two goods equals the price
ratio.
Let us now take the numerical example to learn consumer’s equilibrium with
the help of Table-2:
Table-2 Consumer’s Equilibrium
Consumption
(Units)
Total Utility (Rs) Marginal Utility
(Rs)
Total
Expenditure
(Market
price=Rs.3)
Gain to consumer
0 0 0 - -
1 4 4 3 1
2 7 3 6 1
3 9 2 9 0
4 10 1 12 -2
5 10 0 15 -5
4
From Table-2, it can be seen when a consumer buys one unit of
a good at the market price of Rs. 3, he/she gains utility worth Rs.
4 In such a case, the consumer gains Re. 1. When he/she buys
two units, the utility gained is Rs. 7 and total price paid is Rs 6.
Again, he/she gains Re 1. Next, when he/she purchases three
units, the utility gained is Rs. 9 and price paid is Rs. 9.
In such a case’ he/she does not gain anything. If he buys further,
the total gain would become negative. From Table-2, it can be
seen that MU is equal to price two units of consumption.
Consumer equilibrium is achieved when the consumer buys two
units because at this point quantity and utility gained is
maximum and MU (Rs. 3) is equal to price (Rs. 3).
Derivation of Individual Demand:
The derivation of demand curve was done on the basis of the
law of demand. It should be noted that the demand curve and
law of demand are based on the utility maximizing behavior of
consumers. The analysis of consumer equilibrium helps in
deriving an individual demand curve for a good. As discussed
earlier, consumer equilibrium takes place when MUx= Px
(MUm).
5
Figure-5 shows the derivation of demand curve from MUx:
Figure-5 shows the derivation of demand curve for good X. The
price quantity combination corresponding to equilibrium points
E1 E2 and E3 are shown at point J, K, and L, respectively which
gives a demand curve for good X. Suppose E1 is the point of
equilibrium at price P3 and quantity OQ1. If price falls to P2,
the equilibrium would be disturbed and shift to E2 with quantity
OQ2.
Similarly, when the price becomes P1, equilibrium shifts to E3
with quantity OQ3. Thus, when price increases, quantity
demanded decreases. This inverse relationship between price
and quantity gives the demand curve. Explaining with the help
of utility, if P3 falls to P2, MUx > P3 (MUm) at OQ1. Thus, for
maintaining equilibrium, the quantity demanded by a consumer
should increase to OQ2, which would reduce MUx. Thus,
equilibrium is achieved at MUx =P2 (MUm).
6
Consumer satisfaction
It is a measure of how
products and services supplied by a company meet or
surpass customer expectation. Customer satisfaction is defined
as "the number of customers, or percentage of total customers,
whose reported experience with a firm, its products, or its
services (ratings) exceeds specified satisfaction goals."
7
Consumer equilibrium
The state of balance achieved by an end user of
products that refers to the amount of goods and services they can
purchase given their present level of income and the current
level of prices. Consumer equilibrium allows a consumer to
obtain the most satisfaction possible from their income.
8
In economics, equilibrium implies a position of rest
characterized by absence of change. ... This price is often called
the equilibrium price or market clearing price and will tend not
to change unless demand or supply change
In economics, general equilibrium theory attempts to explain
the behavior of supply, demand, and prices in a whole economy
with several or many interacting markets, by seeking to prove
that the interaction of demand and supply will result in an
overall general equilibrium.
Alfred Marshall, FBA (26 July 1842 – 13
July 1924) was one of the most influential economists of
9
his time. His book, Principles of Economics (1890), was
the dominant economic textbook in England for many
years. It brings the ideas of supply and demand, marginal
utility, and costs of production into a coherent whole.
In economics, an ordinal utility function is a
function representing the preferences of an agent on an
ordinal scale. The ordinal utility theory claims that it is
only meaningful to ask which option is better than the
other, but it is meaningless to ask how much better it is or
how good it is. All of the theory of consumer decision-
making underconditionsof certainty can be, and typically
is, expressed in terms of ordinal utility.
Customerequilibrium
The point at which the costumer is satisfied for
a given commodity is all about Customer equilibrium
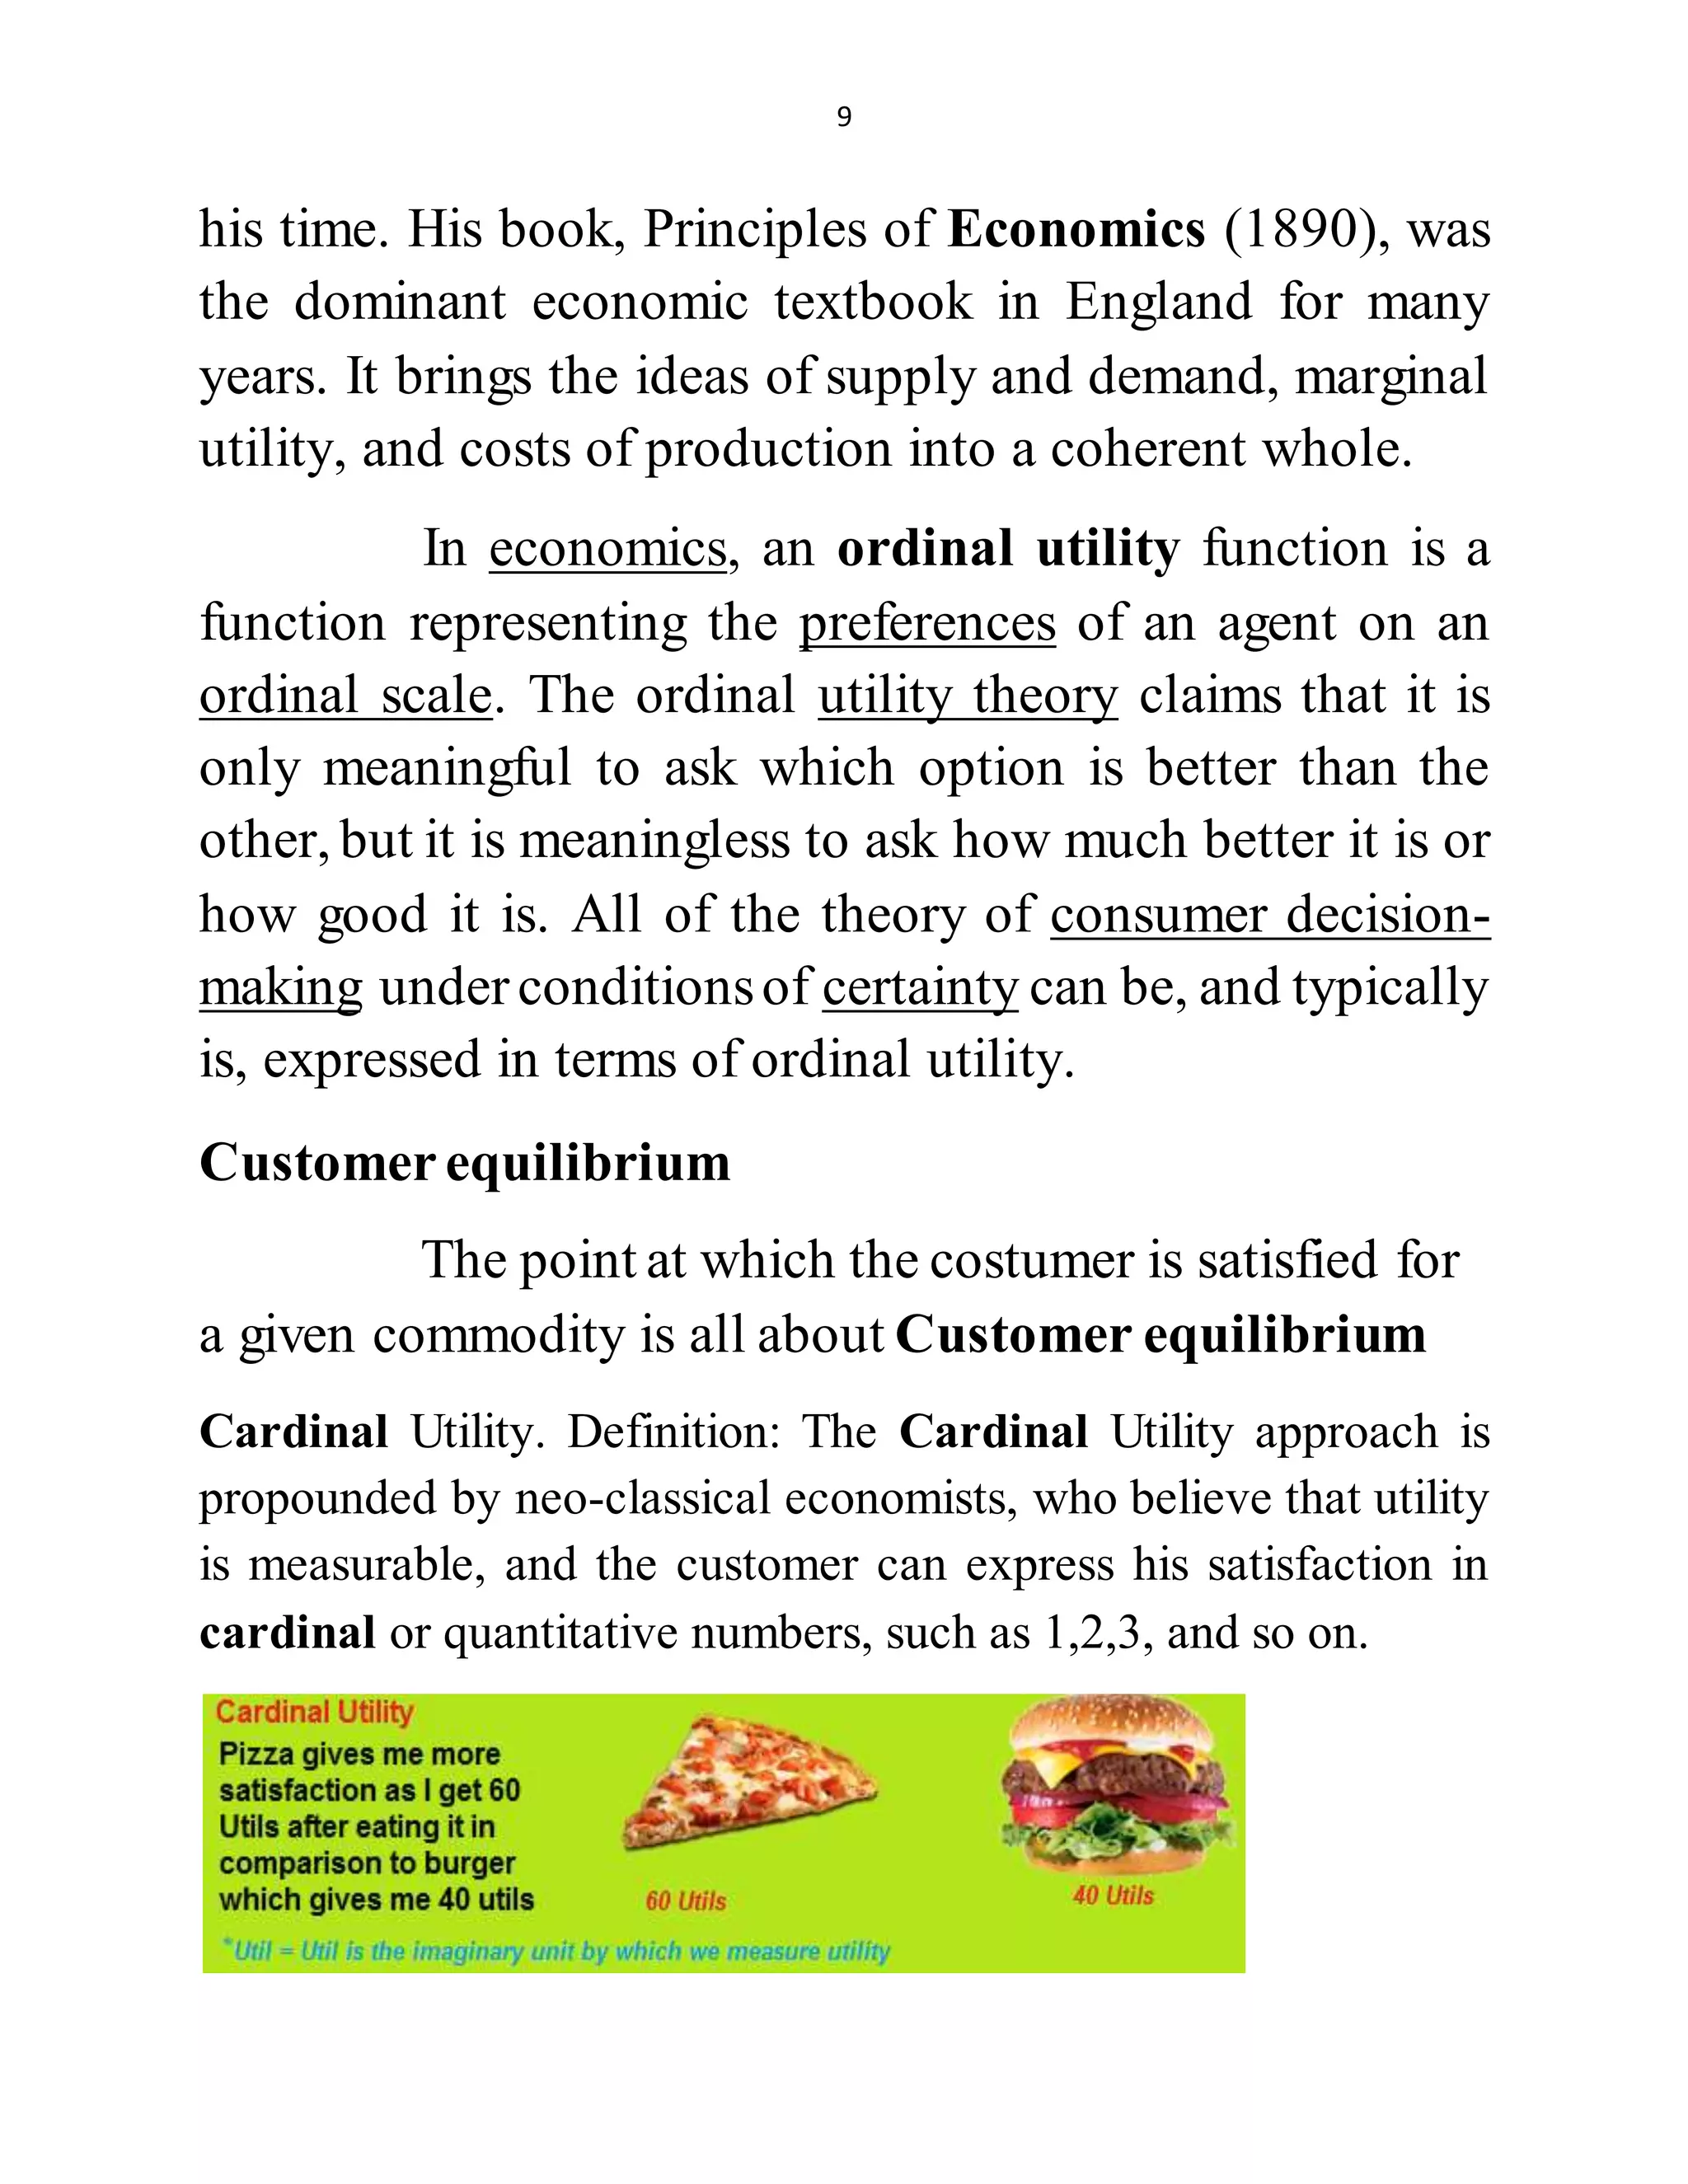
Cardinal Utility. Definition: The Cardinal Utility approach is
propounded by neo-classical economists, who believe that utility
is measurable, and the customer can express his satisfaction in
cardinal or quantitative numbers, such as 1,2,3, and so on.
10
What is cardinal and ordinal utility in economics?
Meaning.
Cardinal utility is the utility wherein the
satisfaction derived by the consumers from the consumption of
good or service can be expressed numerically. Ordinal utility
states that the satisfaction which a consumer derives from the
consumption of good or service cannot be expressed numerical
units.
Utility
Definition
Utility is a term used by economists to describe the
measurement of "useful-ness" that a consumer obtains from any
good. ... Utility may measure how much one enjoys a movie, or
the sense of security one gets from buying a deadbolt.
Revealed preference theory, pioneered by economist Paul
Samuelson, is a method of analyzing choices made by
individuals, mostly used for comparing the influence of policies
on consumer behavior. Revealed preference models assume
that the preferences of consumers can be revealed by their
purchasing habits.
11
REVEALED PREFERENCE THEORY
The revealed preference approach is quite
distinct from the two approaches. Alfred Marshall who built up
the theory of demand on the basis of the marginal utility
analysis. J.R. Hicks who reconstructed the theory of consumer’s
behavior on the basis of the indifference curve analysis. THE
YOUNG INDIAN ECONOMISTS REVEALED
PREFERENCE THEORY
REVEALED PREFERENCE THEORY
The revealed preference approach has been propounded by the
American Economists, Prof. Paul A. Samuelson in his article
“Consumption Theory In Terms Of Revealed Preference” in
1938. This theory relies on the market behavior of the consumer
to know about his preferences with regard to the various
combinations for the two reactions and responses of the
consumer. THE YOUNG INDIAN ECONOMISTS
ASSUMPTIONS
The consumer has only two combinations
of commodities The income of the consumer, prices of the two
commodities are constant during the period of analysis The
tastes of the consumer are given and remain unchanged during
the period of analysis The consumer should choose only one
combination of the commodities in a given price-income
situation Based on observed facts and ordinal utility analysis
12
ASSUMPTIONS
A consumer can be persuaded to buy
more of a commodity if its price is subjected to substantial cut
The choice of the consumer reveals his preference and market
behavior of the consumer Consistency states strong ordering
preference hypothesis of Samuelson Transitivity states that no
two observations of choice behavior can conflict with regard to
an individual consumer’s preferences.
EXPLANATION OF THE THEORY
When a consumer purchases some
commodities either because, he likes them more than other
cheaper than other commodities There are two combinations of
commodities; X and Y Consumer buys combination of X and
not combination of Y Assuming that both the commodities are
equally same cost and are equally good If the consumer buys X
combination rather than Y commodity, because he like X
combination better and revealed preference took place The
price line PL reflects the income-price situation for the
consumer
EXPLANATION OF THE THEORY
The consumer can choose any combination lying
on the price line i.e. C, A, B; below and to the left of the price
line G, E, D, F The consumer can purchase any combination
within the triangle known as Consumer’s Choice Triangle
These are all alternative combinations and the consumer is free
13
to choose any one of them The combinations lying on the price
line is equally costly The combinations lying below the price
line i.e. Consumer’s Choice Triangle is inferior zone The
combinations lying above the price line is superior zone The
gap between preferred zone and inferior zone is said to be
ignorance zone.
REVEALED PREFERENCE THEORY THE YOUNG INDIAN
ECONOMISTS
REVEALED PREFERENCE THEORY MERITS OF
REVEALED PREFERENCE THEORY More realistic More
scientific More consistent Based on fewer assumptions
DEMERITS OF REVEALED PREFERENCE THEORY Ruled
out the possibility of indifference in the behavior of the
consumer Fails to bring distinction between the income effect
and the substitution effect of a price change Deals only with the
individual demand curve Takes into account only that consumer
whose market behavior is governed strictly by the current
market conditions
CONCLUSION
Prof. Samuelson’s revealed preference theory is
really an improvement up on the indifference curve analysis It
has more implications for welfare economics The method of
actual observation makes it superior to other demand theories
The revealed preference theory is restrictive. “In Samuelson’s
revealed preference theory what is gained is rig our and
14
methodology is lost in the narrowness of the scope of its
application”.
Consumption Bundle
A consumption bundle is a set of goods that a
consumer may choose to consume. (Two or more commodities
with limited income)
Consumer budget
A budget constraint represents all the
combinations of goods and services that a consumer may
purchase given current prices within his or her given income.
Consumer theory uses the concepts of a budget constraint and a
preference map to analyze consumer choices.(Budget allocated
for spending goods and services )
Budgets sets
A budget set or opportunity set includes all possible
consumption bundles that someone can afford given the prices
of goods and the person's income level. The budget set is
bounded above by the budget line. (A set of consumption
bundle purchased within the limited income)
Rate of substitution
In economics, the marginal rate of substitution
(MRS) is the rate at which a consumer can give up some
amount of one good in exchange for another good while
maintaining the same level of utility. At equilibrium
consumption levels (assuming no externalities), marginal rates
of substitution are identical. (Rate at which the rate is
substituted for another, acceptance of a customer to purchase
one with a substation of other )
15
Marginal rate of substitution
In economics, the marginal rate of substitution is
the rate at which a consumer can give up some amount of one
good in exchange for another good while maintaining the same
level of utility. At equilibrium consumption levels, marginal
rates of substitution are identical.
What is the Marginal Rate of Substitution?
In economics, the marginal rate of substitution
(MRS) is the amount of a good that a consumer is willing to
give up for another good, as long as the new good is equally
satisfying. It's used in indifference theory to analyze consumer
behavior. The marginal rate of substitution is calculated between
two goods placed on an indifference curve, displaying a frontier
of equal utility for each combination of "good A" and "good B."
The amount of good to sacrifice to purchase one
more units
Revealed preference approach
Revealed preference theory, pioneered by
economist Paul Samuelson, is a method of analyzing choices
made by individuals, mostly used for comparing the influence of
policies on consumer behavior. Revealed preference models
assume that the preferences of consumers can be revealed by
their purchasing habits
Marginal utility
In economics, utility is the satisfaction or benefit
derived by consuming a product; thus the marginal utility of a
good or service is the change in the utility from an increase in
the consumption of that good or service.
16
Co ordinal utility
Cardinal utility is the utility wherein the
satisfaction derived by the consumers from the consumption of
good or service can be measured numerically. Ordinal utility
states that the satisfaction which a consumer derives from the
consumption of product or service cannot be measured
numerically.
What is the meaning of ordinal utility?
In economics, an ordinal utility function is a
function representing the preferences of an agent on an ordinal
scale. The ordinal utility theory claims that it is only
meaningful to ask which option is better than the other, but it is
meaningless to ask how much better it is or how good it is.
Utility analysis is a quantitative method that
estimates the dollar value of benefits generated by an
intervention based on the improvement it produces in worker
productivity.
a) Utility is the want – satisfying power of good or service
b) Usually referred to as “satisfaction” derived from
consumption.
c) Utility is subjective ,based on whims and fancies of
consumers
d) But early Neoclassical economists assumed that it can be
measured –called cardinal utility analysis
e) Walras, Called the want satisfying power of goods as utile.
The wants capacity to fulfill our needs .The wants satisfying
capacities of a particular product is called utility.
17
Total Utility
Total utility is the aggregate level of
satisfaction or fulfillment that a consumer receives through
the consumption of a specific good or service. Each
individual unit of a good or service has its own marginal
utility, and the total utility is simply the sum of all the
marginal utilities of the individual units.
The total satisfaction derive from the consumption about
the same commodity
Marginal utility
In economics, utility is the satisfaction or benefit
derived by consuming a product; thus the marginal utility
of a good or service is the change in the utility from an
increase in the consumption of that good or service.
18
Additional utility of utility to consuming to one
more extra units .It is the additional law of definition of
marginal utility
It states that each additional units will decline
No: of dhosha Utility (U) Total utility (Tu) Marginal
Utility (Mu)
1 10 10 -
2 8 18 8
3 5 23 5
4 2 25 2
5 - 25 0
6 -1 24 -1
7 -2 22 -2
35
30
25 * *
* *
20 * *
15
10 *
5
0
0 1 2 3 4 5 6 7 8 9 10 11 12 13
19
“utility” and show experimentally that experienced
utility, unlike decision-utility, is not being maximized. ... This
definition of experienced utility has the obvious advantage of
being simple and natural for an economist. We also refer to
“satisfaction” and “dissatisfaction” as a measure of pleasure
and pain.
What is law of marginal utility?
The Law of Diminishing Marginal Utility states
that all else equal as consumption increases the marginal utility
derived from each additional unit declines. ... Utility is an
economic term used to represent satisfaction or happiness.
What is an example of marginal utility?
Diminishing Marginal Utility. Consuming one
candy bar may satisfy a person's sweet tooth. If a second candy
bar is consumed, the satisfaction of eating that second bar will
be less than the satisfaction gained from eating the first. If a
third is eaten, the satisfaction will be even less.
Marginal Utility Formula
Marginal Utility = Change in total utility
Change in number of units consumed
Bar of Chocolate Total Utility Marginal Utility
1 5 5
2 11 6
3 16 5
4 19 3
5 19 0
6 17 –2
20
Indifference curve
An indifference curve connects points on a graph
representing different quantities of two goods, points between
which a consumer is indifferent. That is, the consumer has no
preference for one combination or bundle of goods over a
different combination on the same curve
What is an Indifference Curve?
It is a curve that represents all the combinations
of goods that give the same satisfaction to the consumer. Since
all the combinations give the same amount of satisfaction, the
consumer prefers them equally. Hence the name Indifference
Curve.
Here is an example to understand the indifference
curve better. Peter has 1 unit of food and 12 units of clothing.
Now, we ask Peter how many units of clothing he is willing to
give up in exchange for an additional unit of food so that his
21
level of satisfaction remains unchanged. Peter agrees to give up
6 units of clothing for an additional unit of food. Hence, we have
two combinations of food and clothing giving equal satisfaction
to Peter as follows:
1 unit of food and 12 units of clothing
2 units of food and 6 units of clothing
By asking him similar questions, we get various combinations as
follows:
Combination Food Clothing
A 1 12
B 2 6
C 3 4
D 4 3
Graphical Representation:
The diagram shows an Indifference curve (IC). Any
combination lying on this curve gives the same level of
consumer satisfaction. It is also known as Iso-Utility Curve.
22
Indifference Map
An Indifference Map is a set of Indifference
Curves. It depicts the complete picture of a consumer’s
preferences. The following diagram showing an indifference
map consisting of three curves:
We know that a consumer is indifferent among the
combinations lying on the same indifference curve. However, it
is important to note that he prefers the combinations on the
higher indifference curves to those on the lower ones. This is
because a higher indifference curve implies a higher level of
satisfaction. Therefore, all combinations on IC1 offer the same
satisfaction, but all combinations on IC2 give greater
satisfaction than those on IC1.
23
Marginal Rate of Substitution
This is the rate at which a consumer is prepared
to exchange a good X for Y. If we go back to Peter’s example
above, we have the following table:
Combination Food Clothing MRS
A 1 12 –
B 2 6 6
C 3 4 2
D 4 3 1
In this example, Peter initially gives up 6 units
of clothing to get an extra unit of food. Hence, the MRS is 6.
Similarly, for subsequent exchanges, the MRS is 2 and 1
respectively. Therefore, MRS of X for Y is the amount of Y
whose loss can be compensated by a unit gain of X, keeping the
satisfaction the same.
Interestingly, as Peter accumulates more units
of food, the MRS starts falling – meaning he is prepared to give
up fewer units of clothing for food. There are two reasons
behind this:
As Peter gets more units of food, his intensity
of desire for additional units of food decreases.
Most of the goods are imperfect substitutes for
one another. If they could substitute one another perfectly, then
MRS would remain constant.
Properties of an Indifference Curve or IC
Here are the properties of an indifference curve:
An IC slopes downwards to the right
This slope signifies that when the quantity of one commodity in
combination is increased, the amount of the other commodity
24
reduces. This is essential for the level of satisfaction to remain
the same on an indifference curve.
An IC is always convex to the origin
From our discussion above, we understand that as Peter
substitutes clothing for food, he is willing to part with less and
less of clothing. This is the diminishing marginal rate of
substitution. The rate gives a convex shape to the indifference
curve. However, there are two extreme scenarios:
Two commodities are perfect substitutes for each other – In
this case, the indifference curve is a straight line, where MRS is
constant.
Two goods are perfect complementary goods – An example
of such goods would be gasoline and water in a car. In such
cases, the IC will be L-shaped and convex to the origin.
Indifference curves never intersect each other
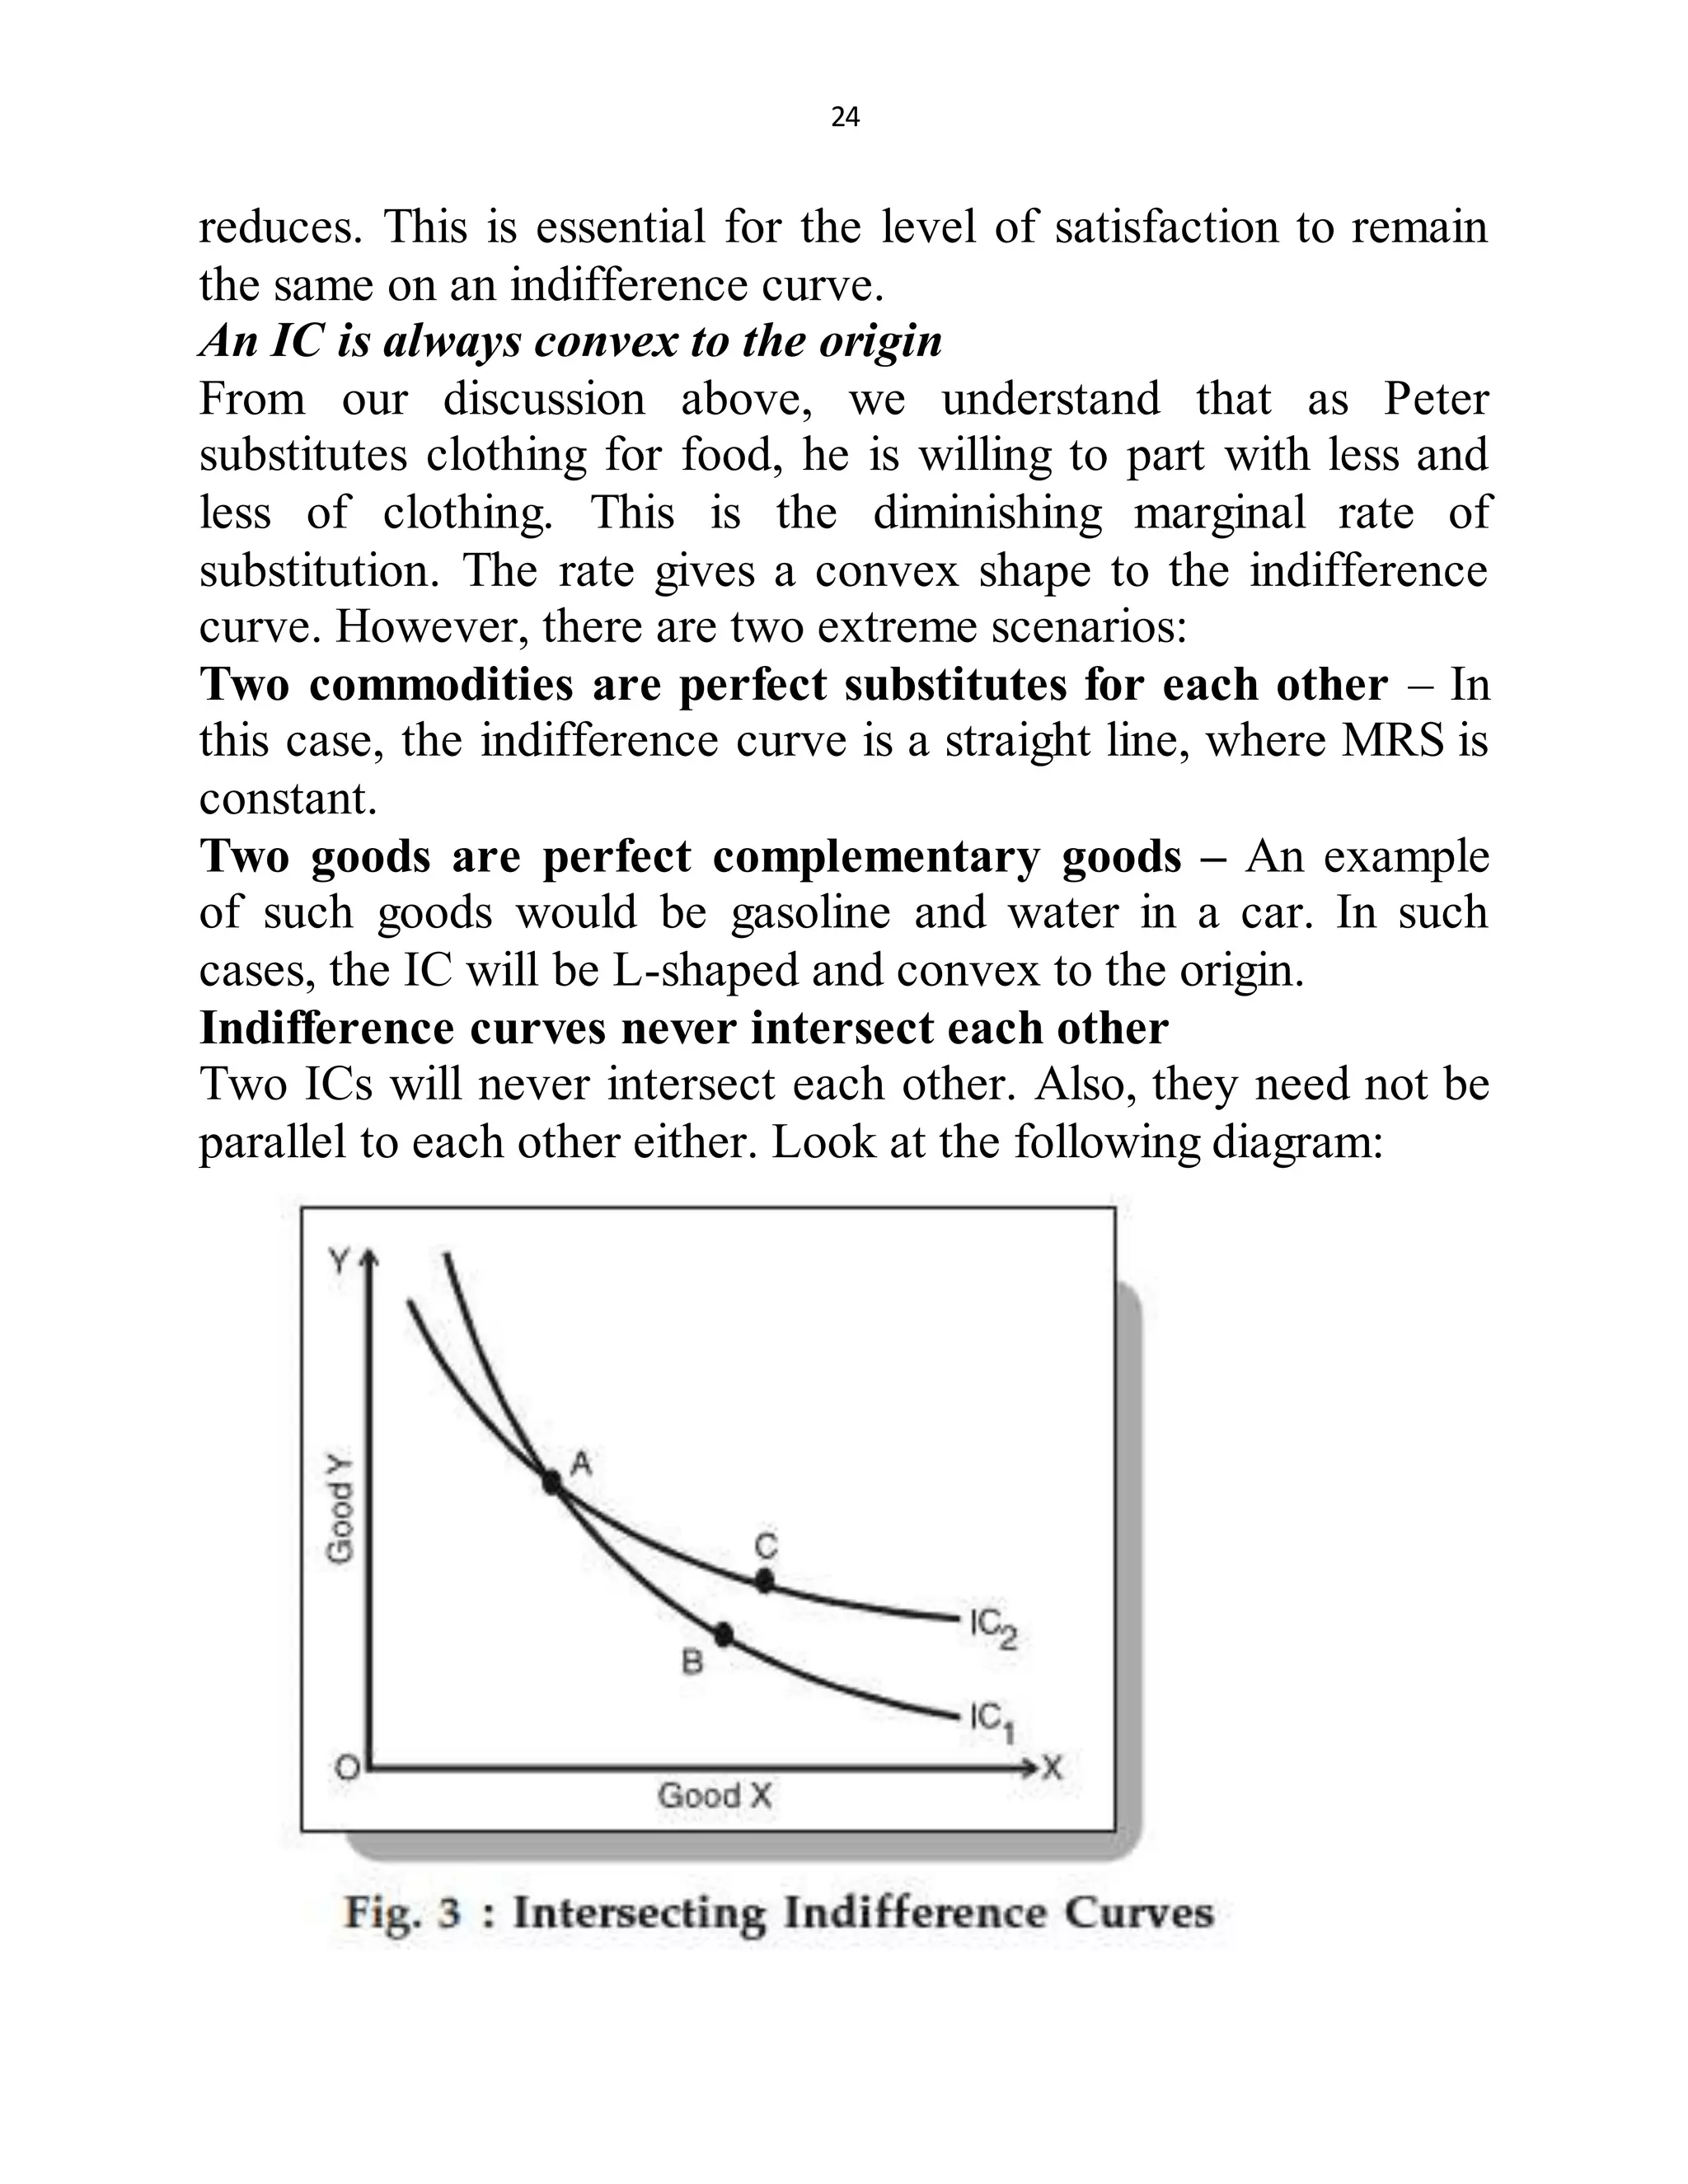
Two ICs will never intersect each other. Also, they need not be
parallel to each other either. Look at the following diagram:
25
Fig 3 shows tow ICs intersecting each other at point A. Since A
and B lie on IC1, the give the same satisfaction level. Similarly,
A and C give the same satisfaction level, as they lie on IC2.
Therefore, we can imply that B and C offer the same level of
satisfaction, which is logically absurd. Hence, no tow ICs can
touch or intersect each other.
A higher IC indicates a higher level of satisfaction as
compared to a lower IC
A higher IC means that a consumer prefers more goods than not.
An IC does not touch the axis
This is not possible because of our assumption that
a consumer considers different combinations of two
commodities and wants both of them. If the curve touches either
of the axes, then it means that he is satisfied with only one
commodity and does not want the other, which is contrary to our
assumption.
Budget Line
Since a higher indifference curve represents a
higher level of satisfaction, a consumer will try to reach the
highest possible IC to maximize his satisfaction. In order to do
so, he has to buy more goods and has to work under the
following two constraints:
He has to pay the price for the goods and
He income is limited, restricting the
availability of money for purchasing these goods
26
As can be seen above, a budget line shows all
possible combinations of two goods that a consumer can buy
within the funds available to him at the given prices of the
goods. All combinations that are within his reach lie on the
budget line.
A point outside the line (point H) represents a
combination beyond the financial reach of the consumer. On the
other hand, a point inside the line (point K) represents under-
spending by the consumer.
Indifferent curve
The combination of two goods
purchase of different commodity to get l satisfaction equally
Combination Food Cloth Satisfaction MRS
A 1 12 SAME -
B 2 6 SAME 6
C 3 4 SAME 2
D 4 3 SAME 1
The graphical representation of a
tabular form is the indifferent curve
27
10
8
6
Cloth 4
IC3
2 IC2
Ic1
1 2 3 4 5 6
Food
Indifferent map
A set of indifference curve is known as
Indifferent map
28
Marginal rate of substitution
The marginal rate of substitution is the rate at which a
consumer can give up some amount of one good in exchange for
another good while maintaining the same level of utility. At
equilibrium consumption levels, marginal rates of substitution
are identical.
The marginal rate of substitution (MRS) quantifies the
amount of one good a consumer will give up to obtain more of
another good
MRS is measured by the slope of indifference curve
29
Properties of marginal rate of substitution
The marginal rate of substitution (MRS) is the
rate at which a consumer can give up some amount of one good
in exchange for another good while maintaining the same level
of utility. At equilibrium consumption levels (assuming no
externalities), marginal rates of substitution are identical.
a) Because of the law of diminishing marginal rate of
substitution , indifference curve are bowed in toward the
origin
b) Indifference curve do not intersect
c) Indifferent curves are a graphical representation of
consumer’s tastes for the two goods
d) Always downwards to the right .It will be convex to the
origin ,because of the dimension marginal rate of substation
e) Indifferent curve never intersect each other and it does not
touch axis
1) Indifference Curves and Utility Maximization
Marginal utility analysis requires some numerical
measure of utility in order to determine the optimal
consumption combinations Economists have developed
another, more general, approach to utility and consumer
behavior This approach does not require that numbers be
attached to specific levels of utility
30
2) Indifference Curves and Utility Maximization
All this new approach requires is that consumers be
able to rank their preferences for various combinations of goods
specifically, the consumer should be able to say whether
Combination A is preferred to combination B Combination B is
preferred to combination A. or both combinations are equally
preferred
3) Consumer Preferences
Indifference curve shows all combinations of goods
that provide the consumer with the same satisfaction, or the
same utility Thus, the consumer finds all combinations on a
curve equally preferred since each of the alternative bundles
of goods yields the same level of utility, the consumer is
indifferent about which combination is actually consumed
4) Indifference Curves
For a person to remain indifferent among
consumption combinations, the increase in utility from
eating more pizza must just offset the decrease in utility
from watching fewer videos Thus, along an indifference
curve, there is an inverse relationship between the quantity
of one good consumed and the quantity of another
consumed indifference curves slope down
31
5) Indifference Curves
They are bowed inward toward the
originIndifference curves are also convex to the origin The
curve gets flatter as you move down it The marginal rate of
substitution, or MRS, between pizza and videos indicates the
number of videos that the consumer is willing to give up to get
one more pizza, while maintaining the same level of total utility
6) Marginal Rate of Substitution
The MRS measures the consumers’ willingness to
trade videos for pizza depends on the amount of each good the
consumer is consuming at the time Mathematically, the MRS
is equal to the absolute value of the slope of the indifference
curve For example, in moving from combination a to
combination b, the consumer is slope between thesewilling
to give up 4 videos to get 1 more pizza MRS =two points
equals –4 4; from b to c, MRS = 1
7) Marginal Rate of Substitution
The law of diminishing marginal rate of
substitution says that as a person’s consumption of pizza
increases, the number of videos that they are willing to give
up to get another pizza declines This as weimplies that the
indifference curve has a diminishing slope move down the
indifference curve, the consumption of pizza increases and
the marginal utility of additional pizza declines
32
8) Indifference Map
We can use the same approach to generate a
series of indifference curves, called an graphical
representation of a consumer’s tastesindifference map
Each curve in the map reflects a different level of utility
9) Properties of Indifference Curves
A particular indifference curve reflects a constant
level of utility the consumer is indifferent among all
consumption combinations along a given curve If total
utility is to remain constant, an increase in the consumption
of one good must be offset by a indifference curves
decrease in the consumption of the other good slope
downward Higher indifference curves represent higher
levels of utility
10) Properties of Indifference Curves
Because of the law of diminishing marginal rate
of substitution, indifference curves are bowed in toward the
origin Indifference curves do not intersect Indifference
curves are a graphical representation of a consumer’s tastes
for the two goods
11) Properties of Indifference Curves
Once we have the consumer’s
indifference may, we turn to the issue of how much of each
33
good will be consumed? To answer this question, we must
consider the relative prices of the two goods and the
consumer’s income
12) Budget Line
Budget line depicts all possible combinations of
movies and pizzas, given prices and your budget Suppose
movies rent for $4, pizza sells for $8, and the budget is $40
per week if you spend the entire $40 on videos, consumer
can purchase 10 videos, and if on pizzas person can afford 5
per week
13) Summary
The indifference curve indicates what the
consumer is willing to buy the budget line shows what the
consumer is able to buy when the indifference curve and the
budget line are combined; we find the quantities of each
good the consumer is both willing and able to buy
14) Consumer Equilibrium Consumer equilibrium
occurs where the slope of the indifference curve is equal to
the slope of the budget line Recall that the absolute value of
the slope of the indifference curve is the marginal rate of
substitution, and the absolute value of the slope of the
budget line equals the price ratio
15) Consumer Equilibrium Thus, MRS = Pp / Pv
Further, the marginal rate of substitution of pizzas for video
rentals can be MRS = MUp / MUv found from the marginal
utilities of pizza and video
34
16) Consumer Equilibrium
In fact, the absolute value of the slope of the
indifference curve equals MUp/MUv and the equilibrium
condition the slope of the budget line equals pp / pv for the
indifference curve approach can be written as
17) Effects of a Change in Price
What happens to the consumer’s
equilibrium consumption when there is a change in price?
The answer can be found by using indifference curve
approach to derive the demand curve
18) Income and Substitution Effects
The law of demand was initially
explained in terms of an income effect and a substitution
effect with indifference curve analysis we have the
analytical tools to examine these two effects more precisely
Law of utility of dimension
The Law Of Diminishing Marginal Utility states
that all else equal as consumption increases the marginal
utility derived from each additional unit declines. Marginal
utility is derived as the change in utility as an additional unit
is consumed. Utility is an economic term used to represent
satisfaction or happiness.
35
Law of diminishing marginal utility
The law is true under certain assumptions as follows
a) Rationality : The consumer aims at maximization of utility
subject to availability of his income
b) Constant marginal utility of money: The marginal utility
of money based for purchasing goods remains constant.
c) Diminishing marginal utility : The utility gained from the
successive units of a commodity diminishes in a given time
period
d) Utility is additive : The utility of different commodities are
independent
Cardinal utility approach
Cardinal Utility. Definition: The Cardinal
Utility approach is propounded by neo-classical
economists, who believe that utility is measurable, and the
customer can express his satisfaction in cardinal or
quantitative numbers, such as 1,2,3, and so on.
Production function
A production function gives the
technological relation between quantities of physical inputs
and quantities of output of goods.
36
A production function is a tool of
analysis used to explain the input output relationship .It
expresses physical relationship between production inputs and
the resultant output. It tells us that how much maximum output
can be obtained in the specified set of inputs and in the given
state of technology
Mathematically, the production function can be expressed as
Q=f (K, L)
Q is the level of output
K= Units of capital
L = Units of labour
f= Represents the production technology
37
Production analysis
Production is a process of transformation of the
factors of production into the economic goods. So in term of
production analysis we are dealing with the physical
relationships between inputs and outputs (i.e. we are observing
the dependence of physical production volume on physical
quantity of the inputs).
What do you mean by production analysis?
PRODUCTION ANALYSIS Production
Function. The technological physical relationship between
inputs and outputs per unit of time is referred to as production
function. The relationship between the inputs to the production
process and the resulting output is described by a production
function.
38
Productivity
Productivity describes various measures of the
efficiency of production. A productivity measure is expressed as
the ratio of output to inputs used in a production process, i.e.
output per unit of input. Productivity is a crucial factor in
production performance of firms and nations.
Service
A service is a transaction in which no physical
goods are transferred from the seller to the buyer. The benefits
of such a service are held to be demonstrated by the buyer's
willingness to make the exchange. Public services are those that
society as a whole pays for.
The four Ps are the categories involved in
the marketing of a good or service, and they include product,
price, place and promotion.
a) Product
Function packaging services
In marketing, a product is a system made
available for consumer use; it is anything that can be
offered to a market to satisfy the desire or need of a
customer. In retailing, products are often referred to as
merchandise, and in manufacturing, products are bought as
raw materials and then sold as finished goods
39
b)Price
Cost discount margin
A price is the quantity of payment or
compensation given by one party to another in return for
one unit of goods or services.
c) Place
Distribution logistics channel
You can use the place to refer to the point,
building, area, town, or country that you have already
mentioned.
d)Promotion
Advertising sales publicity
A promotion refers to the advancement of an
employee's rank or position in a hierarchical structure. In
marketing, promotion refers to a different sort of
advancement. A sales promotion entails the features - via
advertising and/or a discounted price - of a particular
product or service.
Once you've developed your marketing
strategy, there is a "Seven P Formula" you should use to
continually evaluate and reevaluate your business activities.
These seven are: product, price, promotion, place, packaging,
positioning and people.
40
Marketing Mix Definition:
The marketing mix definition is simple. It is about putting the
right product or a combination thereof in the place, at the right
time, and at the right price. The difficult part is doing this well,
as you need to know every aspect of your business plan.
As we noted before, the marketing mix is predominately
associated with the 4P’s of marketing, the 7P’s of service
marketing, and the 4 Cs theories developed in the 1990s
41
Marketing Mix 4P's
A marketing expert named E. Jerome McCarthy created the
Marketing 4Ps in the 1960s. This classification has been used
throughout the world. Business schools teach this concept in
basic marketing classes.
1) Marketing Mix – Product
A product is an item that is built or produced to
satisfy the needs of a certain group of people. The product can
be intangible or tangible as it can be in the form of services or
goods.
You must ensure to have the right type of
product that is in demand for your market. So during the product
42
development phase, the marketer must do an extensive research
on the life cycle of the product that they are creating.
A product has a certain life cycle that includes
the growth phase, the maturity phase, and the sales decline
phase. It is important for marketers to reinvent their products to
stimulate more demand once it reaches the sales decline phase.
Marketers must also create the right product mix.
It may be wise to expand your current product mix by
diversifying and increasing the depth of your product line.
All in all, marketers must ask themselves the
question “what can I do to offer a better product to this group of
people than my competitors”.
In developing the right product, you have to answer
the following questions:
1) What does the client want from the service or product?
2) How will the customer use it?
3) Where will the client use it?
4) What features must the product have to meet the client’s
needs?
5) Are there any necessary features that you missed out?
6) Are you creating features that are not needed by the client?
7) What’s the name of the product?
8) Does it have a catchy name?
9) What are the sizes or colors available?
10) How is the product different from the products of your
competitors?
11) What does the product look like?
43
2) Marketing Mix – Price
The price of the product is basically the amount
that a customer pays for to enjoy it. Price is a very important
component of the marketing mix definition.
It is also a very important component of a
marketing plan as it determines your firm’s profit and survival.
Adjusting the price of the product has a big impact on the entire
marketing strategy as well as greatly affecting the sales and
demand of the product.
This is inherently a touchy area though. If a
company is new to the market and has not made a name for
themselves yet, it is unlikely that your target market will be
willing to pay a high price.
Although they may be willing in the future to
hand over large sums of money, it is inevitably harder to get
them to do so during the birth of a business.
Pricing always help shape the perception of your product in
consumers eyes. Always remember that a low price usually
means an inferior good in the consumer’s eyes as they compare
your good to a competitor.
44
Consequently, prices too high will make the
costs outweigh the benefits in customer’s eyes, and they will
therefore value their money over your product. Be sure to
examine competitors pricing and price accordingly.
When setting the product price, marketers
should consider the perceived value that the product offers.
There are three major pricing strategies, and these are:
a) Market penetration pricing
b) Market skimming pricing
c) Neutral pricing
Here are some of the important questions that you should ask
yourself when you are setting the product price:
1) How much did it cost you to produce the product?
2) What is the customers’ perceived product value?
3) Do you think that the slight price decrease could
significantly increase your market share?
4) Can the current price of the product keep up with the price
of the product’s competitors?
45
3) Marketing Mix – Place
Placement or distribution is a very important
part of the product mix definition. You have to position and
distribute the product in a place that is accessible to potential
buyers.
This comes with a deep understanding of your
target market. Understand them inside out and you will discover
the most efficient positioning and distribution channels that
directly speak with your market.
There are many distribution strategies, including:
1) Intensive distribution
2) Exclusive distribution
3) Selective distribution
4) Franchising
Here are some of the questions that you should answer in
developing your distribution strategy:
1) Where do your clients look for your service or product?
2) What kind of stores do potential clients go to? Do they
shop in a mall, in a regular brick and mortar store, in the
supermarket, or online?
3) How do you access the different distribution channels?
46
4) How is your distribution strategy different from your
competitors?
5) Do you need a strong sales force?
6) Do you need to attend trade fairs?
7) Do you need to sell in an online store?
4) Marketing Mix – Promotion
Promotion is a very important component of
marketing as it can boost brand recognition and sales. Promotion
is comprised of various elements like:
1) Sales Organization
2) Public Relations
3) Advertising
4) Sales Promotion
Advertising typically covers communication
methods that are paid for like television advertisements, radio
commercials, print media, and internet advertisements. In
contemporary times, there seems to be a shift in focus offline to
the online world.
Public relations, on the other hand, are
communications that are typically not paid for. This includes
press releases, exhibitions, sponsorship deals, seminars,
conferences, and events.
47
Word of mouth is also a type of product
promotion. Word of mouth is an informal communication about
the benefits of the product by satisfied customers and ordinary
individuals. The sales staff plays a very important role in public
relations and word of mouth.
It is important to not take this literally. Word of
mouth can also circulate on the internet. Harnessed effectively
and it has the potential to be one of the most valuable assets you
have in boosting your profits online. An extremely good
example of this is online social media and managing a firm's
online social media presence.
In creating an effective product promotion
strategy, you need to answer the following questions:
1) How can you send marketing messages to your potential
buyers?
2) When is the best time to promote your product?
3) Will you reach your potential audience and buyers through
television ads?
4) Is it best to use the social media in promoting the product?
5) What is the promotion strategy of your competitors?
Your combination of promotional strategies and how you go
about promotion will depend on your budget, the message you
want to communicate, and the target market you have defined
already in previous steps.
Marketing Mix 7P's
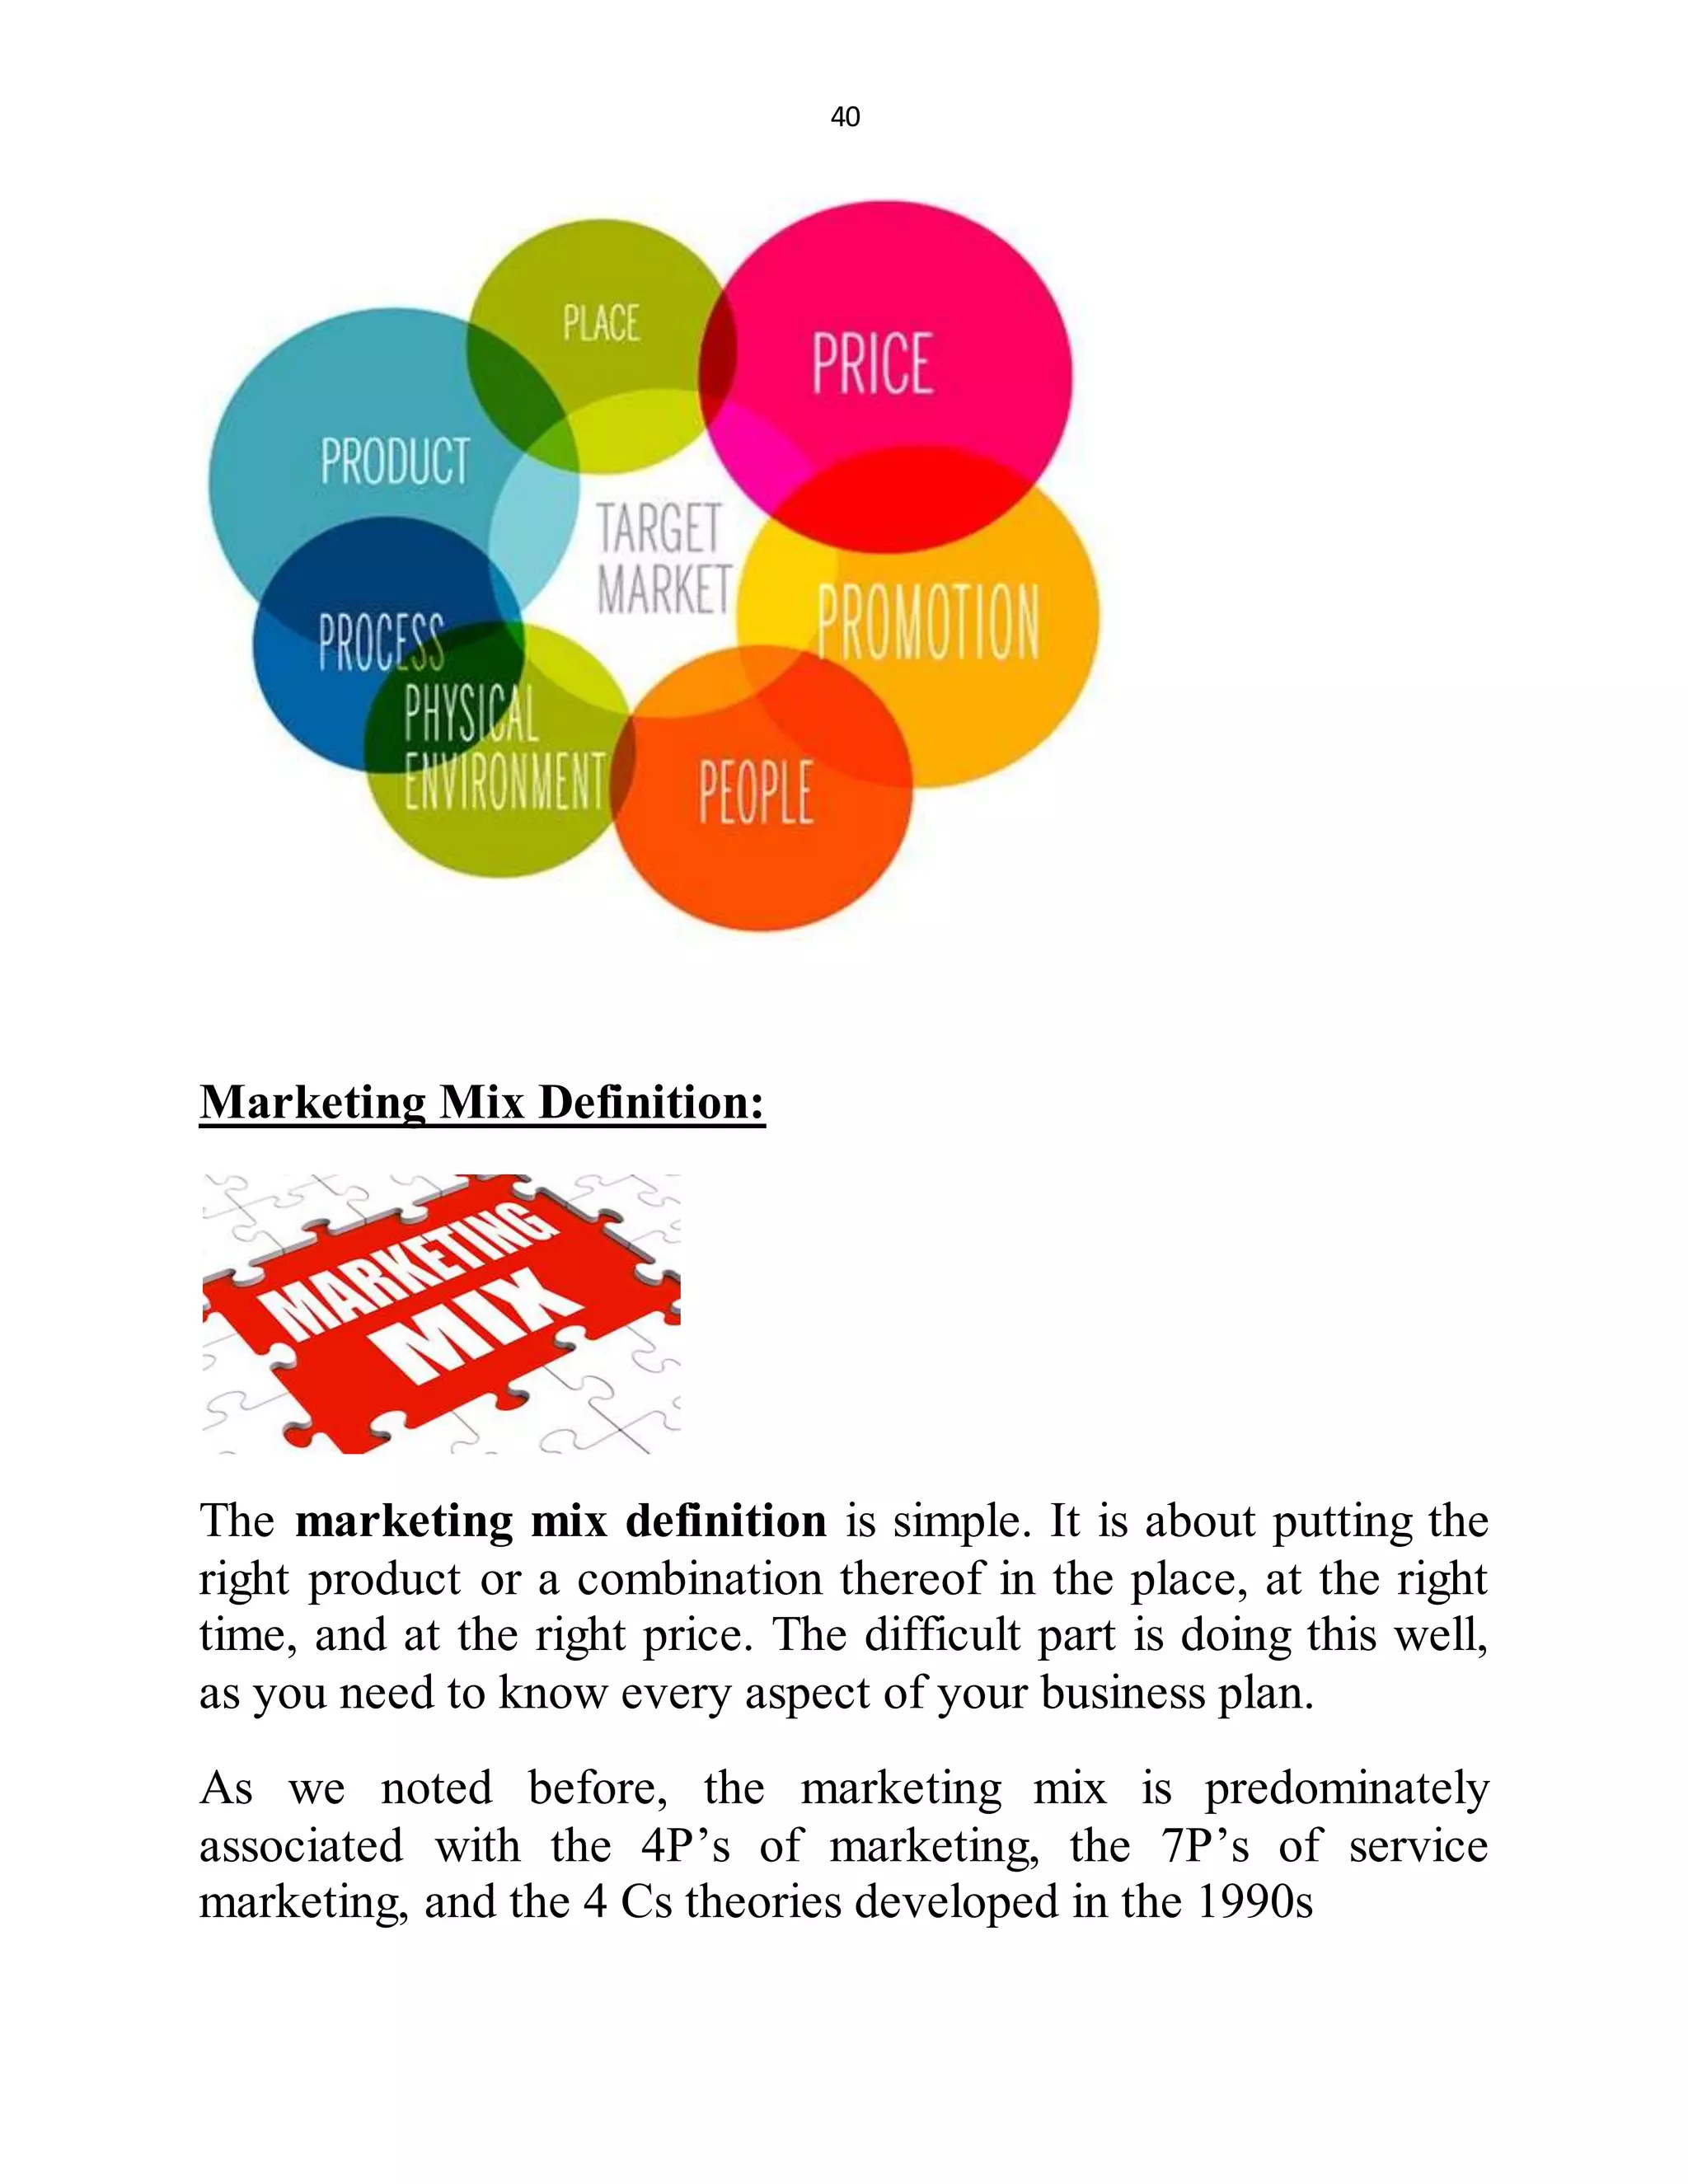
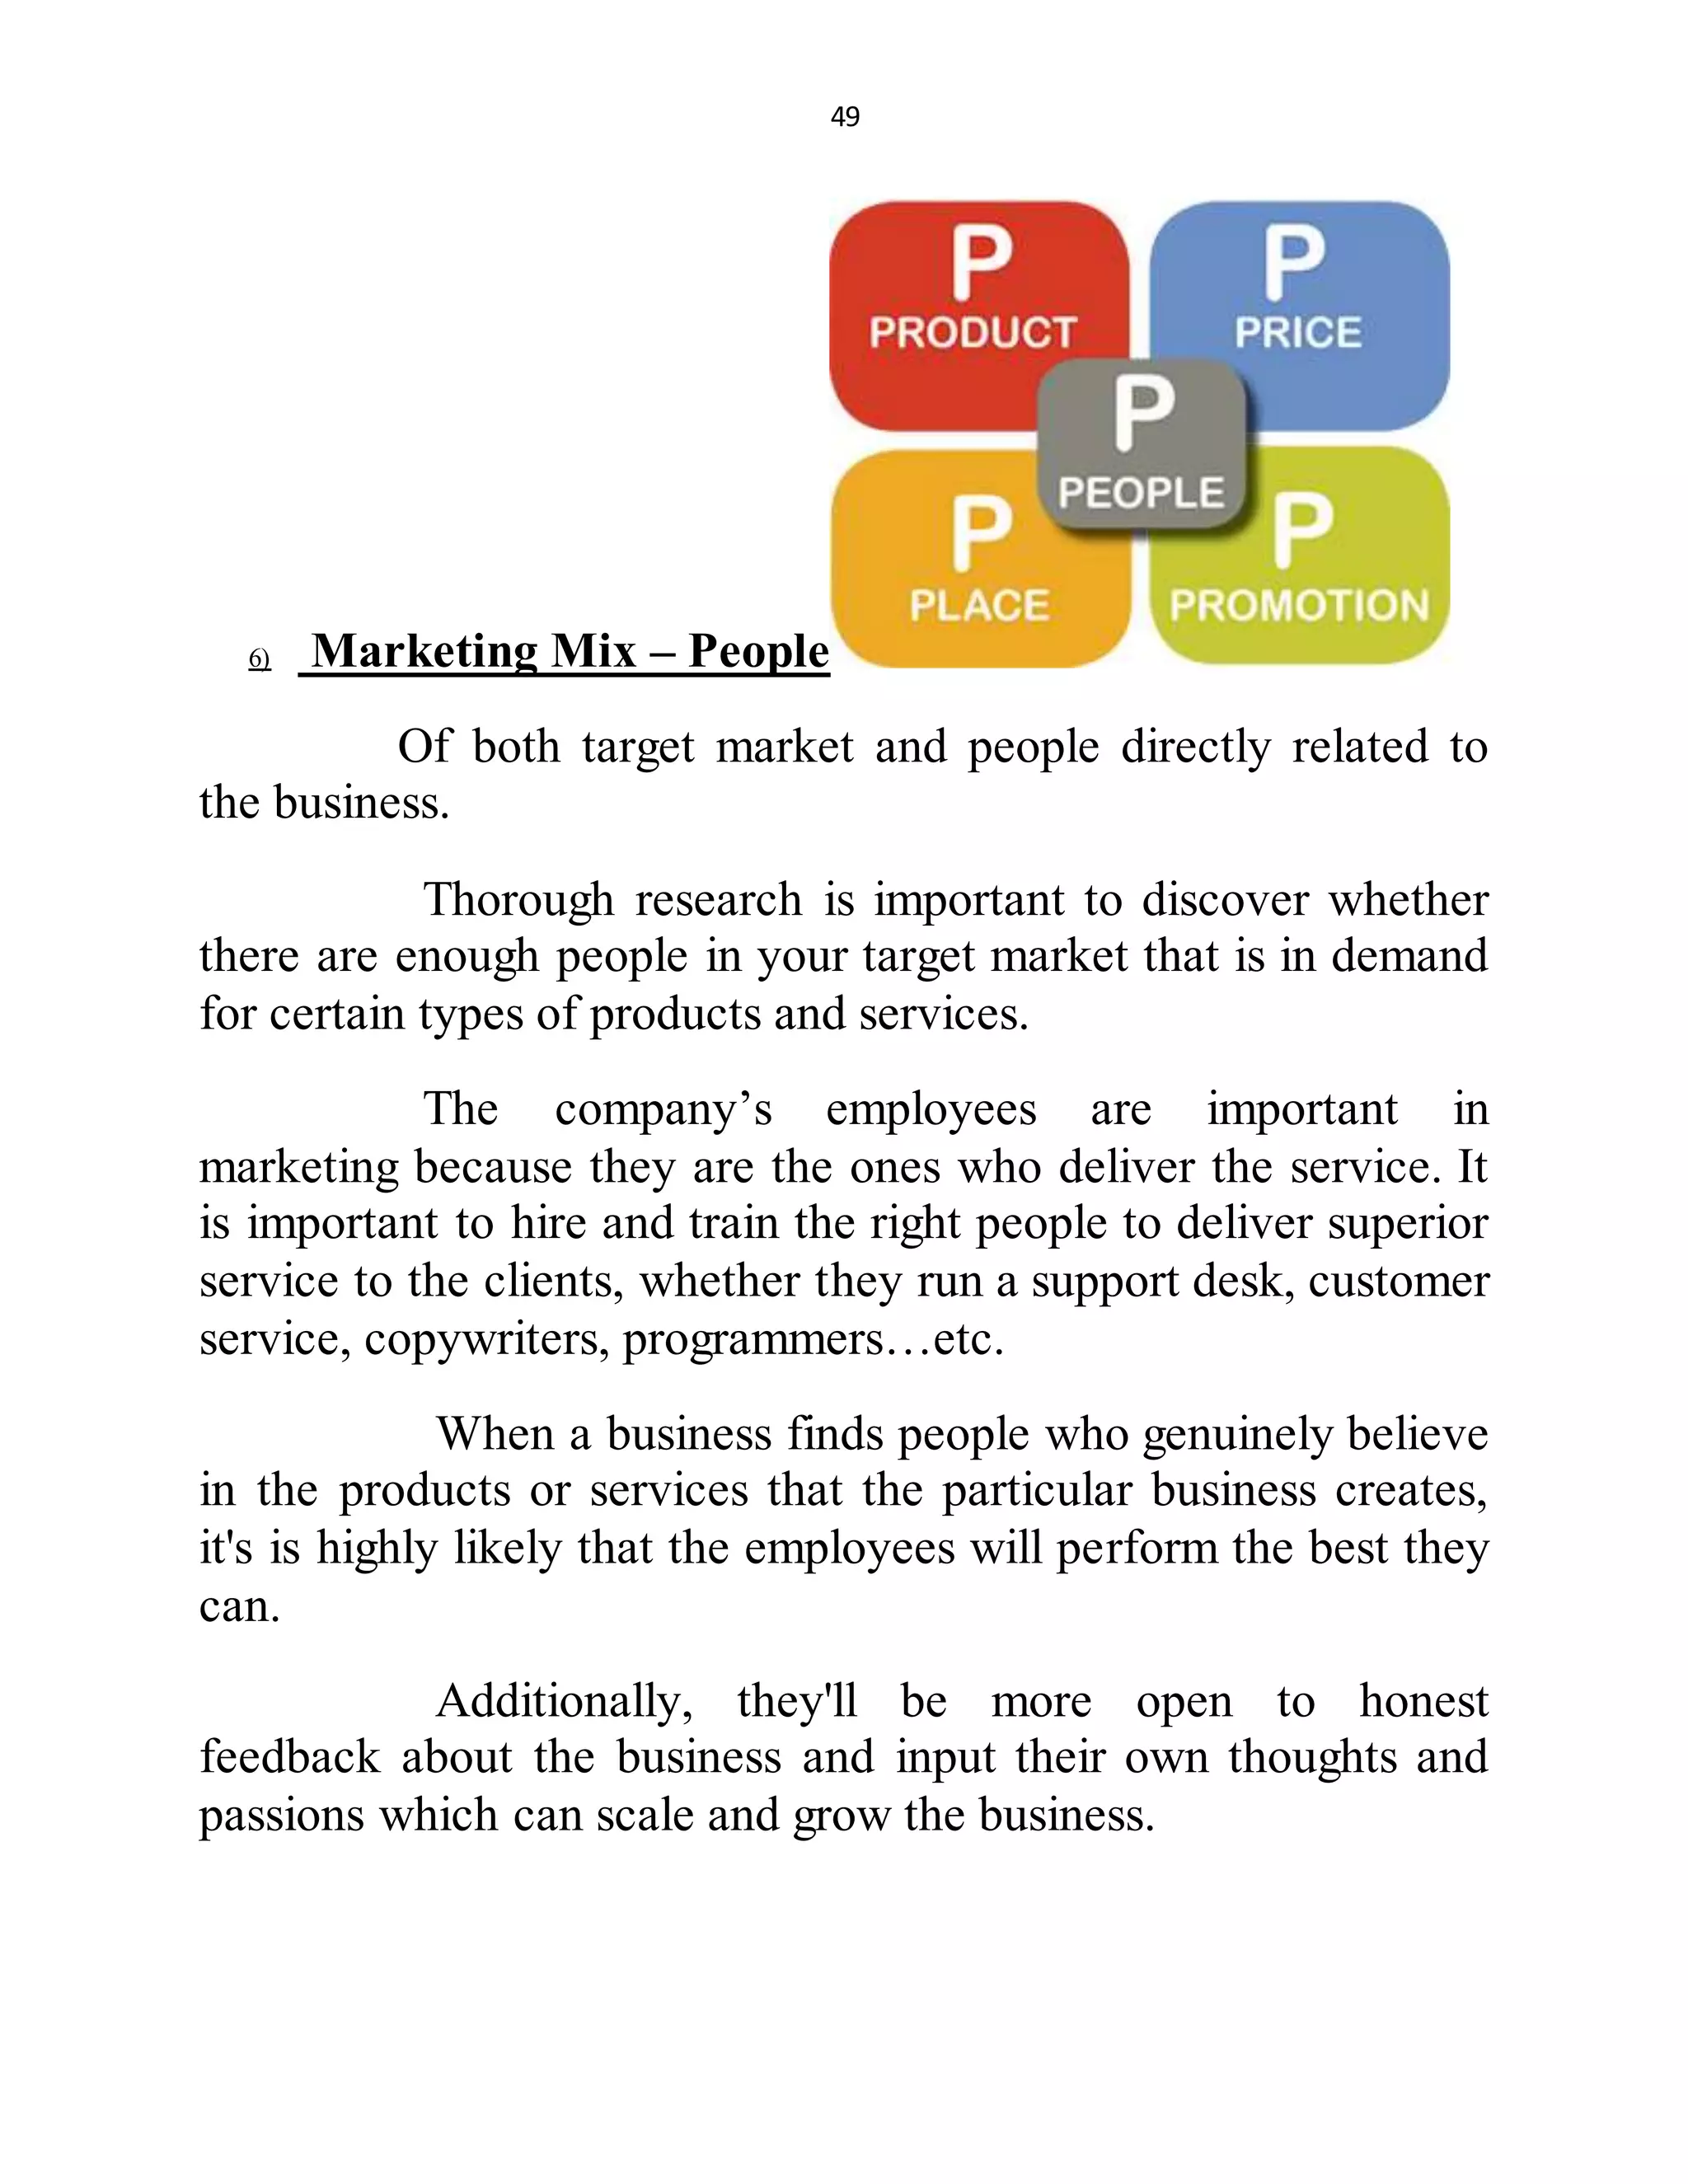
The 7Ps model is a marketing model that modifies the 4Ps
model. The 7Ps is generally used in the service industries.
48
Here is the expansions from the 4Ps to the 7Ps marketing model:
49
6) Marketing Mix – People
Of both target market and people directly related to
the business.
Thorough research is important to discover whether
there are enough people in your target market that is in demand
for certain types of products and services.
The company’s employees are important in
marketing because they are the ones who deliver the service. It
is important to hire and train the right people to deliver superior
service to the clients, whether they run a support desk, customer
service, copywriters, programmers…etc.
When a business finds people who genuinely believe
in the products or services that the particular business creates,
it's is highly likely that the employees will perform the best they
can.
Additionally, they'll be more open to honest
feedback about the business and input their own thoughts and
passions which can scale and grow the business.
50
This is a secret, “internal” competitive advantage a
business can have over other competitors which can inherently
affect a business's position in the marketplace.
6 ) Marketing Mix – Process
The systems and processes of the organization affect
the execution of the service.
So, you have to make sure that you have a well-
tailored process in place to minimize costs.
It could be your entire sales funnel, a pay system, distribution
system and other systematic procedures and steps to ensure a
working business that is running effectively.
Tweaking and enhancements can come later to “tighten up” a
business to minimize costs and maximize profits.
51
7) Marketing Mix – Physical Evidence
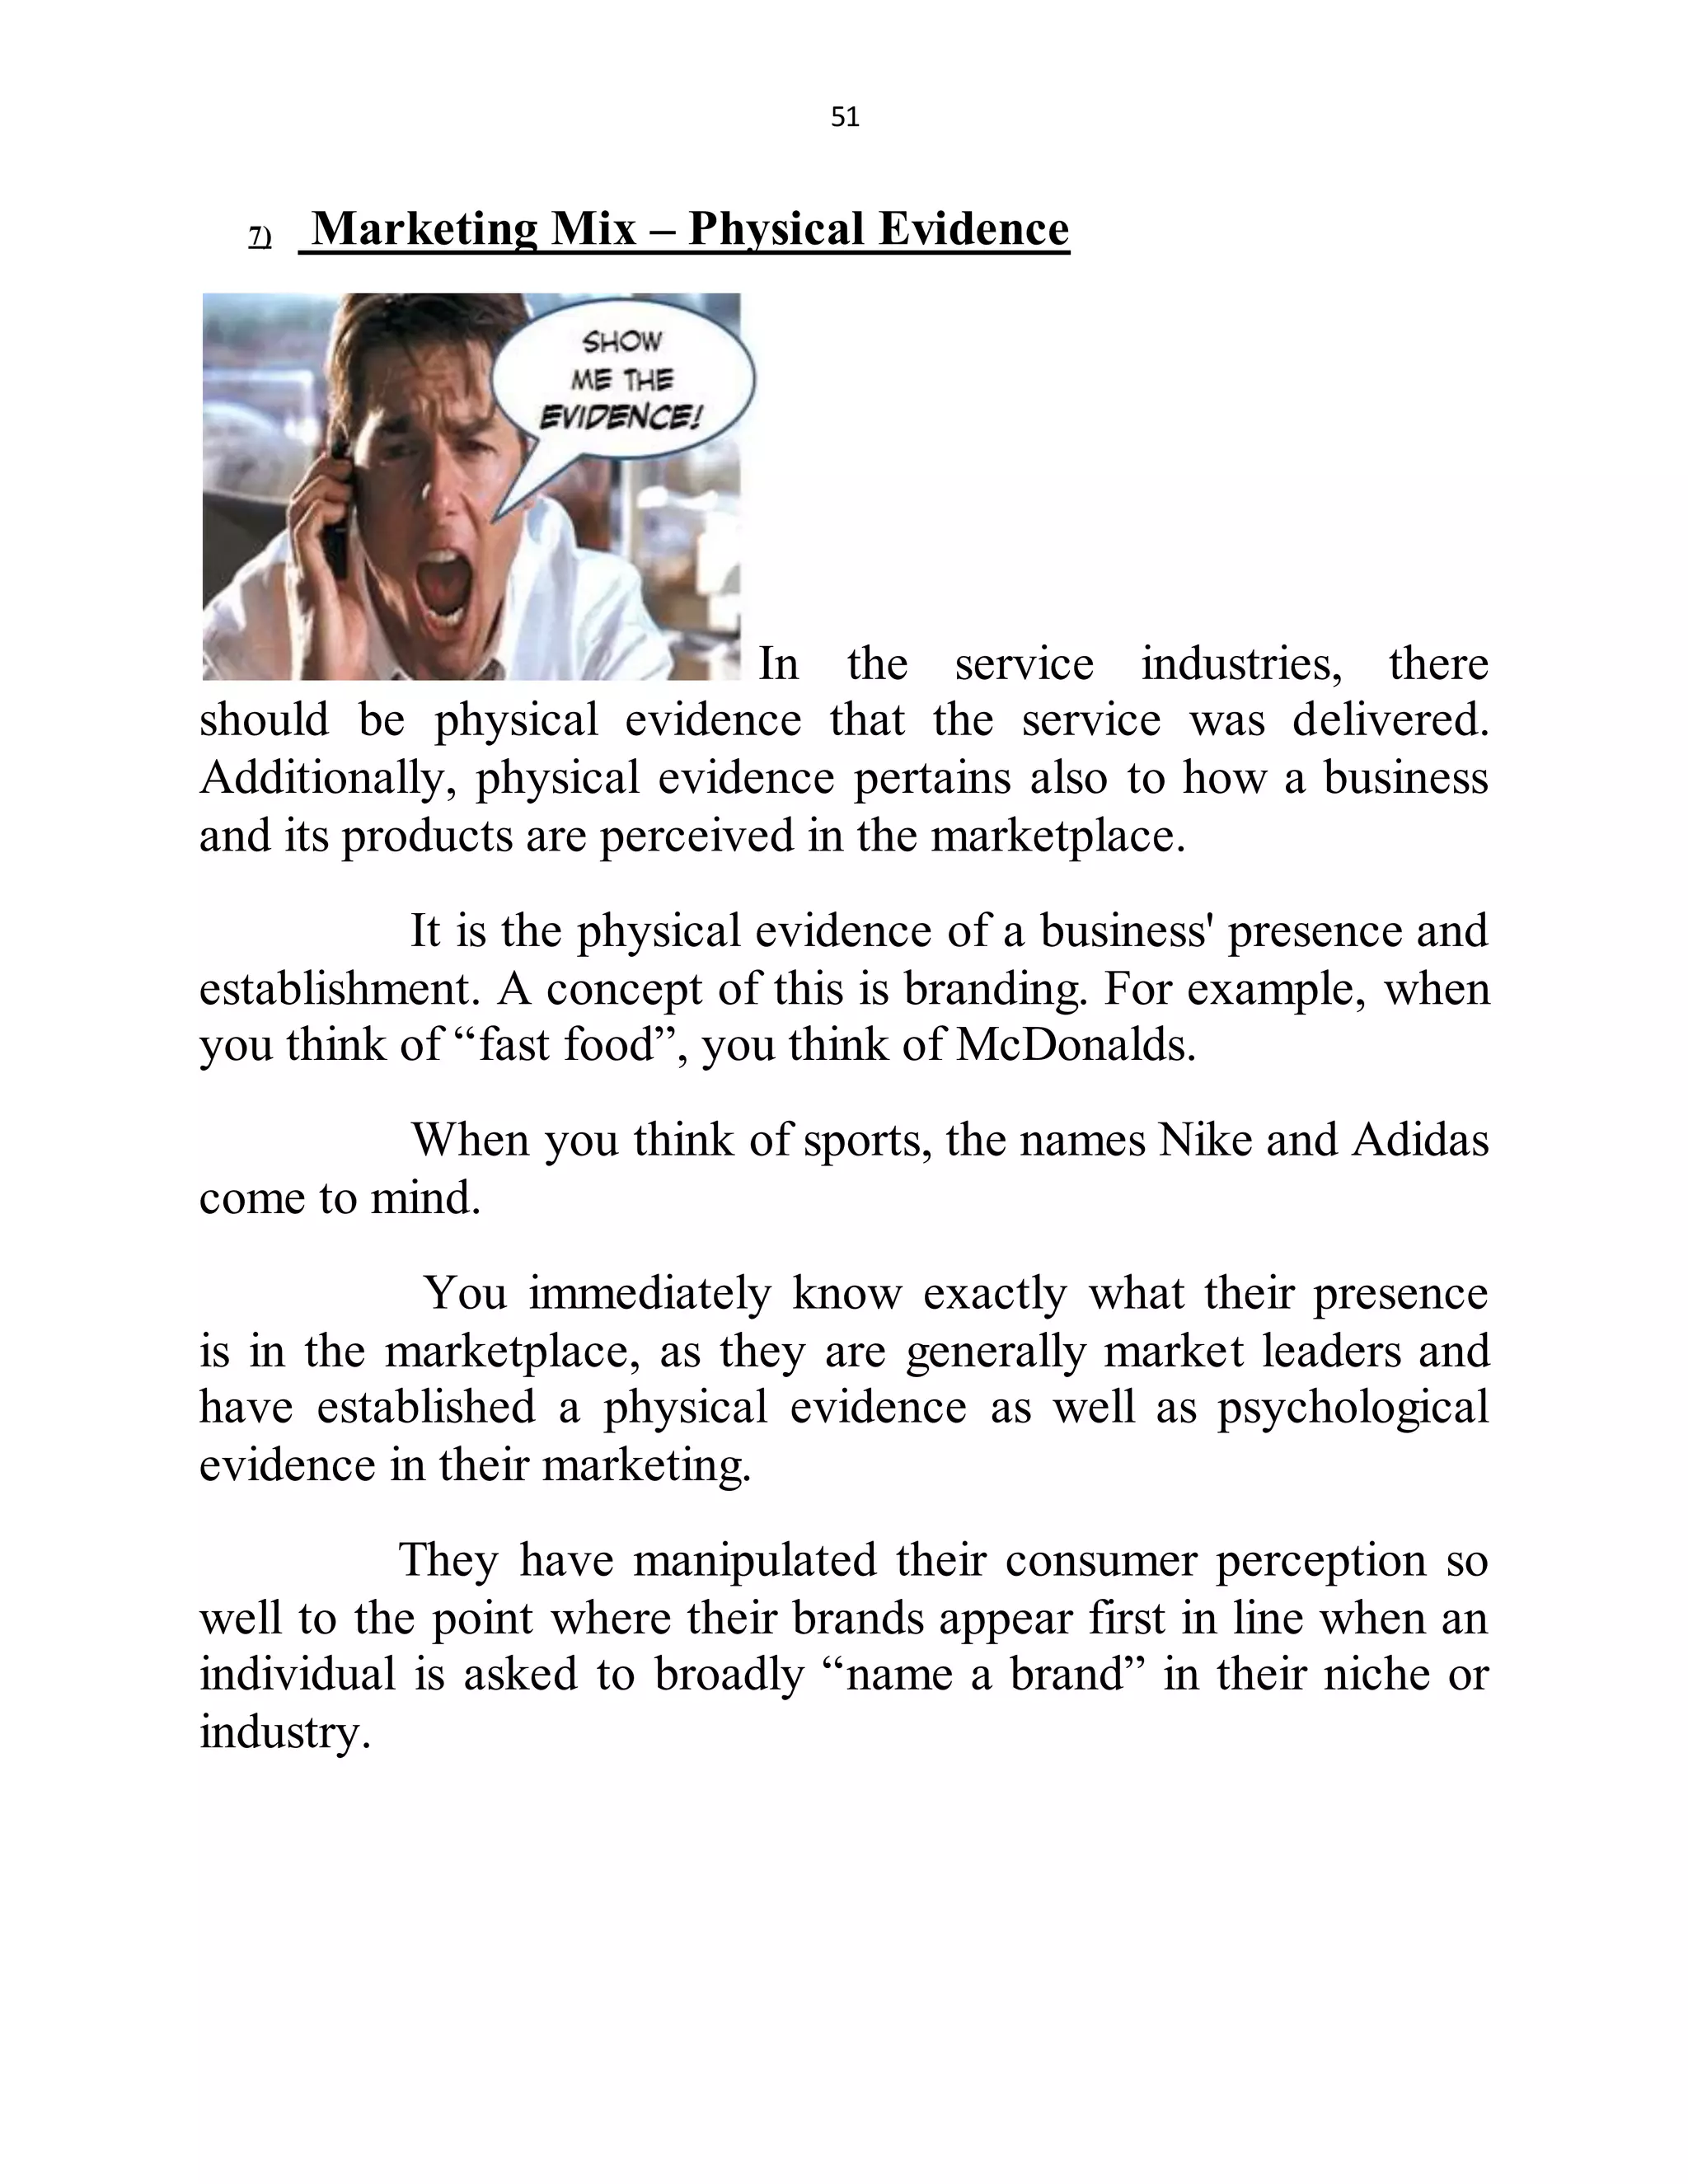
In the service industries, there
should be physical evidence that the service was delivered.
Additionally, physical evidence pertains also to how a business
and its products are perceived in the marketplace.
It is the physical evidence of a business' presence and
establishment. A concept of this is branding. For example, when
you think of “fast food”, you think of McDonalds.
When you think of sports, the names Nike and Adidas
come to mind.
You immediately know exactly what their presence
is in the marketplace, as they are generally market leaders and
have established a physical evidence as well as psychological
evidence in their marketing.
They have manipulated their consumer perception so
well to the point where their brands appear first in line when an
individual is asked to broadly “name a brand” in their niche or
industry.
52
Marketing Mix 4C's
The 4Cs marketing model was developed by Robert F.
Lauterborn in 1990. It is a modification of the 4Ps model. It is
not a basic part of the marketing mix definition, but rather an
extension. Here are the components of this marketing model:
1) Cost – According to Lauterborn, price is not the only cost
incurred when purchasing a product. Cost of conscience or
opportunity cost is also part of the cost of product
ownership.
2) Consumer Wants and Needs – A company should only
sell a product that addresses consumer demand. So,
marketers and business researchers should carefully study
the consumer wants and needs.
3) Communication – According to Lauterborn, “promotion”
is manipulative while communication is “cooperative”.
Marketers should aim to create an open dialogue with
potential clients based on their needs and wants.
53
4) Convenience – The product should be readily available to
the consumers. Marketers should strategically place the
products in several visible distribution points.
Whether you are using the 4Ps, the 7Ps, or the
4Cs, your marketing mix plan plays a vital role. It is important
to devise a plan that balances profit, client satisfaction, brand
recognition, and product availability. It is also extremely
important to consider the overall “how” aspect that will
ultimately determine your success or failure.
By understanding the basic concept of the
marketing mix and it's extensions, you will be sure to achieve
financial success whether it is your own business or whether you
are assisting in your workplace's business success.
The ultimate goal of business is to make profits and this is a
surefire, proven way to achieve this goal.
Value added services servitization production is the conversion
of input to output, Input may human resources, Raw metrical,
land and mercenary etc
Factors of production
Factors of production, resources, or inputs are
what is used in the production process to produce output—that
is, finished goods and services. The utilized amounts of the
various inputs determine the quantity of output according to the
relationship called the production function.
54
Resources required for generation of goods or services,
generally classified into four major groups:
1) Land (including all natural resources),
2) Labor (including all human resources),
3) Capital (including all man-made resources), and
Enterprise (which brings all the previous resources together for
production).
These factors
are classified also as management, machines, materials, and
money (this, the 4 Ms), or other such nomenclature. More
recently, knowledge has come to be recognized as distinct from
labor, and as a factor of production in its own right.
Production
Production is a process of combining various
material inputs and immaterial inputs in order to make
something for consumption. It is the act of creating output, a
good or service which has value and contributes to the utility of
individuals
Production require certain resources and each
resources can lie factors of production
1) Land
2) Labour
3) Capital
55
Entrepreneurship
Entrepreneurship is the process of
designing, launching and running a new business, which is often
initially a small business. The people who create these
businesses are called entrepreneurs
Production decision
The production decision is one of the basic
decisions made in the. Economy, since total output and
employment depend on the aggre- gate of all the production
decisions made in firms large and small across the land.
Number of decision taken by production manager
to covert the available resources to output to fulfill the need and
wants of the customer
Production include two or more input to on output
1) How should the term produces output
2) How much should the term sell and the cost
3) How should the farm promoted the product
4) How much should be the quantity of product at what rate

More Related Content

What's hot (20)

7 utility
7 utility7 utility
7 utility
 
indifference_curve
indifference_curveindifference_curve
indifference_curve
 
Consumer behaviour iaa
Consumer behaviour  iaaConsumer behaviour  iaa
Consumer behaviour iaa
 
Utility
UtilityUtility
Utility
 
THEORY OF CONSUMER BEHAVIOUR
THEORY OF CONSUMER BEHAVIOURTHEORY OF CONSUMER BEHAVIOUR
THEORY OF CONSUMER BEHAVIOUR
 
Business Economics 04 Consumer Behaviour
Business Economics 04 Consumer BehaviourBusiness Economics 04 Consumer Behaviour
Business Economics 04 Consumer Behaviour
 
Imt 20 managerial economics m1
Imt 20 managerial economics m1Imt 20 managerial economics m1
Imt 20 managerial economics m1
 
Utility Analysis Of Demand
Utility Analysis Of DemandUtility Analysis Of Demand
Utility Analysis Of Demand
 
Chapter 4 Consumer Behavior
Chapter 4 Consumer Behavior �Chapter 4 Consumer Behavior �
Chapter 4 Consumer Behavior
 
Consumer Surplus
Consumer SurplusConsumer Surplus
Consumer Surplus
 
CONCEPT OF UTILITY & ELASTICITY OF DEMAND
CONCEPT OF UTILITY & ELASTICITY OF DEMANDCONCEPT OF UTILITY & ELASTICITY OF DEMAND
CONCEPT OF UTILITY & ELASTICITY OF DEMAND
 
Consumer choice
Consumer choiceConsumer choice
Consumer choice
 
Marginal Utility
Marginal UtilityMarginal Utility
Marginal Utility
 
Utility theory
Utility theoryUtility theory
Utility theory
 
Consumer's equilibrium
Consumer's equilibriumConsumer's equilibrium
Consumer's equilibrium
 
Concept of utility
Concept of utilityConcept of utility
Concept of utility
 
Utility analysis
Utility analysisUtility analysis
Utility analysis
 
cardinal and ordinal utility analysis.
cardinal and ordinal utility analysis.cardinal and ordinal utility analysis.
cardinal and ordinal utility analysis.
 
Utility analysis ppt
Utility analysis pptUtility analysis ppt
Utility analysis ppt
 
Consumer Surplus & Producer Surplus
Consumer Surplus & Producer SurplusConsumer Surplus & Producer Surplus
Consumer Surplus & Producer Surplus
 

Similar to Business economics3

Business economics2
Business economics2Business economics2
Business economics2vibuchandran
 
Theory of Consumer Behaviour Class 12 Economics
Theory of Consumer Behaviour Class 12 EconomicsTheory of Consumer Behaviour Class 12 Economics
Theory of Consumer Behaviour Class 12 EconomicsAnjaliKaur3
 
THEORY OF CONSUMER BEHAVIOR AND DEMAND.pptx
THEORY OF CONSUMER BEHAVIOR AND DEMAND.pptxTHEORY OF CONSUMER BEHAVIOR AND DEMAND.pptx
THEORY OF CONSUMER BEHAVIOR AND DEMAND.pptxJaafar47
 
4. consumer choice indifference theory
4. consumer choice   indifference theory4. consumer choice   indifference theory
4. consumer choice indifference theoryShivam Taneja
 
CONSUMER BEHAVIOR.pptx
CONSUMER BEHAVIOR.pptxCONSUMER BEHAVIOR.pptx
CONSUMER BEHAVIOR.pptxBejameeLobo
 
Consumer behaviour
Consumer behaviourConsumer behaviour
Consumer behaviourRavi Muchhal
 
Consumer prefrence and choice
Consumer prefrence and choiceConsumer prefrence and choice
Consumer prefrence and choiceBhupendra Thakur
 
Theory of consumer behavior
Theory of consumer behaviorTheory of consumer behavior
Theory of consumer behaviorPriyanka31997
 
ECONOMICS THEORY OF CONSUMER BEHAVIOUR.pptx
ECONOMICS THEORY OF CONSUMER BEHAVIOUR.pptxECONOMICS THEORY OF CONSUMER BEHAVIOUR.pptx
ECONOMICS THEORY OF CONSUMER BEHAVIOUR.pptxAnanyaRai56
 
Bba 1 be 1 u-3 consumer behavior and demand analysis
Bba 1 be 1 u-3 consumer behavior and demand analysisBba 1 be 1 u-3 consumer behavior and demand analysis
Bba 1 be 1 u-3 consumer behavior and demand analysisRai University
 
Bba 1 be 1 u-3 consumer behavior and demand analysis
Bba 1 be 1 u-3 consumer behavior and demand analysisBba 1 be 1 u-3 consumer behavior and demand analysis
Bba 1 be 1 u-3 consumer behavior and demand analysisBhavik Panchal
 
Consumer Behaviour And Consumer Equilibrium
Consumer Behaviour And Consumer Equilibrium Consumer Behaviour And Consumer Equilibrium
Consumer Behaviour And Consumer Equilibrium ShrutiJain330
 
Agricultural Economics
 Agricultural Economics Agricultural Economics
Agricultural EconomicsAdawe123
 
UTILITY_ANALYSIS_HS_PPT[1] (1).pptx
UTILITY_ANALYSIS_HS_PPT[1] (1).pptxUTILITY_ANALYSIS_HS_PPT[1] (1).pptx
UTILITY_ANALYSIS_HS_PPT[1] (1).pptxRudreshPatel17
 
theoryofconsumerbehavior-151109140500-lva1-app6891 (1) (1).pptx
theoryofconsumerbehavior-151109140500-lva1-app6891 (1) (1).pptxtheoryofconsumerbehavior-151109140500-lva1-app6891 (1) (1).pptx
theoryofconsumerbehavior-151109140500-lva1-app6891 (1) (1).pptxsadiqfarhan2
 
Economic Analysis Part-II.pptx
Economic Analysis Part-II.pptxEconomic Analysis Part-II.pptx
Economic Analysis Part-II.pptxvigneswaran81
 
Consumer's equilibrium through Utility Analysis and IC Analysis
Consumer's equilibrium through Utility Analysis and IC AnalysisConsumer's equilibrium through Utility Analysis and IC Analysis
Consumer's equilibrium through Utility Analysis and IC Analysiscooldeep22
 

Similar to Business economics3 (20)

Business economics2
Business economics2Business economics2
Business economics2
 
Theory of Consumer Behaviour Class 12 Economics
Theory of Consumer Behaviour Class 12 EconomicsTheory of Consumer Behaviour Class 12 Economics
Theory of Consumer Behaviour Class 12 Economics
 
THEORY OF CONSUMER BEHAVIOR AND DEMAND.pptx
THEORY OF CONSUMER BEHAVIOR AND DEMAND.pptxTHEORY OF CONSUMER BEHAVIOR AND DEMAND.pptx
THEORY OF CONSUMER BEHAVIOR AND DEMAND.pptx
 
4. consumer choice indifference theory
4. consumer choice   indifference theory4. consumer choice   indifference theory
4. consumer choice indifference theory
 
CONSUMER BEHAVIOR.pptx
CONSUMER BEHAVIOR.pptxCONSUMER BEHAVIOR.pptx
CONSUMER BEHAVIOR.pptx
 
Consumer behaviour
Consumer behaviourConsumer behaviour
Consumer behaviour
 
Consumer prefrence and choice
Consumer prefrence and choiceConsumer prefrence and choice
Consumer prefrence and choice
 
Theory of consumer behavior
Theory of consumer behaviorTheory of consumer behavior
Theory of consumer behavior
 
ECONOMICS THEORY OF CONSUMER BEHAVIOUR.pptx
ECONOMICS THEORY OF CONSUMER BEHAVIOUR.pptxECONOMICS THEORY OF CONSUMER BEHAVIOUR.pptx
ECONOMICS THEORY OF CONSUMER BEHAVIOUR.pptx
 
Cardinal utility analysis
Cardinal utility analysisCardinal utility analysis
Cardinal utility analysis
 
Bba 1 be 1 u-3 consumer behavior and demand analysis
Bba 1 be 1 u-3 consumer behavior and demand analysisBba 1 be 1 u-3 consumer behavior and demand analysis
Bba 1 be 1 u-3 consumer behavior and demand analysis
 
Bba 1 be 1 u-3 consumer behavior and demand analysis
Bba 1 be 1 u-3 consumer behavior and demand analysisBba 1 be 1 u-3 consumer behavior and demand analysis
Bba 1 be 1 u-3 consumer behavior and demand analysis
 
Consumer Behaviour And Consumer Equilibrium
Consumer Behaviour And Consumer Equilibrium Consumer Behaviour And Consumer Equilibrium
Consumer Behaviour And Consumer Equilibrium
 
Agricultural Economics
 Agricultural Economics Agricultural Economics
Agricultural Economics
 
CHAPTER 3.pptx
CHAPTER 3.pptxCHAPTER 3.pptx
CHAPTER 3.pptx
 
UTILITY_ANALYSIS_HS_PPT[1] (1).pptx
UTILITY_ANALYSIS_HS_PPT[1] (1).pptxUTILITY_ANALYSIS_HS_PPT[1] (1).pptx
UTILITY_ANALYSIS_HS_PPT[1] (1).pptx
 
theoryofconsumerbehavior-151109140500-lva1-app6891 (1) (1).pptx
theoryofconsumerbehavior-151109140500-lva1-app6891 (1) (1).pptxtheoryofconsumerbehavior-151109140500-lva1-app6891 (1) (1).pptx
theoryofconsumerbehavior-151109140500-lva1-app6891 (1) (1).pptx
 
Economic Analysis Part-II.pptx
Economic Analysis Part-II.pptxEconomic Analysis Part-II.pptx
Economic Analysis Part-II.pptx
 
Consumer Surplus
Consumer SurplusConsumer Surplus
Consumer Surplus
 
Consumer's equilibrium through Utility Analysis and IC Analysis
Consumer's equilibrium through Utility Analysis and IC AnalysisConsumer's equilibrium through Utility Analysis and IC Analysis
Consumer's equilibrium through Utility Analysis and IC Analysis
 

More from vibuchandran

Business communication and soft skills 4
Business communication and soft skills 4Business communication and soft skills 4
Business communication and soft skills 4vibuchandran
 
Mba 3 h7 performance management
Mba 3 h7   performance managementMba 3 h7   performance management
Mba 3 h7 performance managementvibuchandran
 
Mgt 203 human resources management
Mgt 203 human resources managementMgt 203 human resources management
Mgt 203 human resources managementvibuchandran
 
Mgt 201 business law
Mgt 201 business lawMgt 201 business law
Mgt 201 business lawvibuchandran
 
Business environment and ethics1
Business environment and ethics1Business environment and ethics1
Business environment and ethics1vibuchandran
 
Business environment and ethics1
Business environment and ethics1Business environment and ethics1
Business environment and ethics1vibuchandran
 
Business environment and ethics2
Business environment and ethics2Business environment and ethics2
Business environment and ethics2vibuchandran
 
Business economics
Business economicsBusiness economics
Business economicsvibuchandran
 
Business economics 4
Business economics 4Business economics 4
Business economics 4vibuchandran
 
Business economics 5
Business economics 5Business economics 5
Business economics 5vibuchandran
 

More from vibuchandran (13)

Qt notes
Qt notesQt notes
Qt notes
 
Henry fayol,s
Henry fayol,sHenry fayol,s
Henry fayol,s
 
Business communication and soft skills 4
Business communication and soft skills 4Business communication and soft skills 4
Business communication and soft skills 4
 
Pestel analyis
Pestel analyisPestel analyis
Pestel analyis
 
Mba 3 h7 performance management
Mba 3 h7   performance managementMba 3 h7   performance management
Mba 3 h7 performance management
 
Mgt 203 human resources management
Mgt 203 human resources managementMgt 203 human resources management
Mgt 203 human resources management
 
Mgt 201 business law
Mgt 201 business lawMgt 201 business law
Mgt 201 business law
 
Business environment and ethics1
Business environment and ethics1Business environment and ethics1
Business environment and ethics1
 
Business environment and ethics1
Business environment and ethics1Business environment and ethics1
Business environment and ethics1
 
Business environment and ethics2
Business environment and ethics2Business environment and ethics2
Business environment and ethics2
 
Business economics
Business economicsBusiness economics
Business economics
 
Business economics 4
Business economics 4Business economics 4
Business economics 4
 
Business economics 5
Business economics 5Business economics 5
Business economics 5
 

Recently uploaded

mini mental status format.docx
mini    mental       status     format.docxmini    mental       status     format.docx
mini mental status format.docxPoojaSen20
 
ECONOMIC CONTEXT - LONG FORM TV DRAMA - PPT
ECONOMIC CONTEXT - LONG FORM TV DRAMA - PPTECONOMIC CONTEXT - LONG FORM TV DRAMA - PPT
ECONOMIC CONTEXT - LONG FORM TV DRAMA - PPTiammrhaywood
 
Class 11 Legal Studies Ch-1 Concept of State .pdf
Class 11 Legal Studies Ch-1 Concept of State .pdfClass 11 Legal Studies Ch-1 Concept of State .pdf
Class 11 Legal Studies Ch-1 Concept of State .pdfakmcokerachita
 
Hybridoma Technology ( Production , Purification , and Application )
Hybridoma Technology  ( Production , Purification , and Application  ) Hybridoma Technology  ( Production , Purification , and Application  )
Hybridoma Technology ( Production , Purification , and Application ) Sakshi Ghasle
 
“Oh GOSH! Reflecting on Hackteria's Collaborative Practices in a Global Do-It...
“Oh GOSH! Reflecting on Hackteria's Collaborative Practices in a Global Do-It...“Oh GOSH! Reflecting on Hackteria's Collaborative Practices in a Global Do-It...
“Oh GOSH! Reflecting on Hackteria's Collaborative Practices in a Global Do-It...Marc Dusseiller Dusjagr
 
microwave assisted reaction. General introduction
microwave assisted reaction. General introductionmicrowave assisted reaction. General introduction
microwave assisted reaction. General introductionMaksud Ahmed
 
Incoming and Outgoing Shipments in 1 STEP Using Odoo 17
Incoming and Outgoing Shipments in 1 STEP Using Odoo 17Incoming and Outgoing Shipments in 1 STEP Using Odoo 17
Incoming and Outgoing Shipments in 1 STEP Using Odoo 17Celine George
 
call girls in Kamla Market (DELHI) 🔝 >༒9953330565🔝 genuine Escort Service 🔝✔️✔️
call girls in Kamla Market (DELHI) 🔝 >༒9953330565🔝 genuine Escort Service 🔝✔️✔️call girls in Kamla Market (DELHI) 🔝 >༒9953330565🔝 genuine Escort Service 🔝✔️✔️
call girls in Kamla Market (DELHI) 🔝 >༒9953330565🔝 genuine Escort Service 🔝✔️✔️9953056974 Low Rate Call Girls In Saket, Delhi NCR
 
Kisan Call Centre - To harness potential of ICT in Agriculture by answer farm...
Kisan Call Centre - To harness potential of ICT in Agriculture by answer farm...Kisan Call Centre - To harness potential of ICT in Agriculture by answer farm...
Kisan Call Centre - To harness potential of ICT in Agriculture by answer farm...Krashi Coaching
 
How to Configure Email Server in Odoo 17
How to Configure Email Server in Odoo 17How to Configure Email Server in Odoo 17
How to Configure Email Server in Odoo 17Celine George
 
Employee wellbeing at the workplace.pptx
Employee wellbeing at the workplace.pptxEmployee wellbeing at the workplace.pptx
Employee wellbeing at the workplace.pptxNirmalaLoungPoorunde1
 
Organic Name Reactions for the students and aspirants of Chemistry12th.pptx
Organic Name Reactions  for the students and aspirants of Chemistry12th.pptxOrganic Name Reactions  for the students and aspirants of Chemistry12th.pptx
Organic Name Reactions for the students and aspirants of Chemistry12th.pptxVS Mahajan Coaching Centre
 
How to Make a Pirate ship Primary Education.pptx
How to Make a Pirate ship Primary Education.pptxHow to Make a Pirate ship Primary Education.pptx
How to Make a Pirate ship Primary Education.pptxmanuelaromero2013
 
A Critique of the Proposed National Education Policy Reform
A Critique of the Proposed National Education Policy ReformA Critique of the Proposed National Education Policy Reform
A Critique of the Proposed National Education Policy ReformChameera Dedduwage
 
Mastering the Unannounced Regulatory Inspection
Mastering the Unannounced Regulatory InspectionMastering the Unannounced Regulatory Inspection
Mastering the Unannounced Regulatory InspectionSafetyChain Software
 
Interactive Powerpoint_How to Master effective communication
Interactive Powerpoint_How to Master effective communicationInteractive Powerpoint_How to Master effective communication
Interactive Powerpoint_How to Master effective communicationnomboosow
 
Concept of Vouching. B.Com(Hons) /B.Compdf
Concept of Vouching. B.Com(Hons) /B.CompdfConcept of Vouching. B.Com(Hons) /B.Compdf
Concept of Vouching. B.Com(Hons) /B.CompdfUmakantAnnand
 
Introduction to ArtificiaI Intelligence in Higher Education
Introduction to ArtificiaI Intelligence in Higher EducationIntroduction to ArtificiaI Intelligence in Higher Education
Introduction to ArtificiaI Intelligence in Higher Educationpboyjonauth
 

Recently uploaded (20)

mini mental status format.docx
mini    mental       status     format.docxmini    mental       status     format.docx
mini mental status format.docx
 
ECONOMIC CONTEXT - LONG FORM TV DRAMA - PPT
ECONOMIC CONTEXT - LONG FORM TV DRAMA - PPTECONOMIC CONTEXT - LONG FORM TV DRAMA - PPT
ECONOMIC CONTEXT - LONG FORM TV DRAMA - PPT
 
Class 11 Legal Studies Ch-1 Concept of State .pdf
Class 11 Legal Studies Ch-1 Concept of State .pdfClass 11 Legal Studies Ch-1 Concept of State .pdf
Class 11 Legal Studies Ch-1 Concept of State .pdf
 
Hybridoma Technology ( Production , Purification , and Application )
Hybridoma Technology  ( Production , Purification , and Application  ) Hybridoma Technology  ( Production , Purification , and Application  )
Hybridoma Technology ( Production , Purification , and Application )
 
“Oh GOSH! Reflecting on Hackteria's Collaborative Practices in a Global Do-It...
“Oh GOSH! Reflecting on Hackteria's Collaborative Practices in a Global Do-It...“Oh GOSH! Reflecting on Hackteria's Collaborative Practices in a Global Do-It...
“Oh GOSH! Reflecting on Hackteria's Collaborative Practices in a Global Do-It...
 
microwave assisted reaction. General introduction
microwave assisted reaction. General introductionmicrowave assisted reaction. General introduction
microwave assisted reaction. General introduction
 
Incoming and Outgoing Shipments in 1 STEP Using Odoo 17
Incoming and Outgoing Shipments in 1 STEP Using Odoo 17Incoming and Outgoing Shipments in 1 STEP Using Odoo 17
Incoming and Outgoing Shipments in 1 STEP Using Odoo 17
 
Staff of Color (SOC) Retention Efforts DDSD
Staff of Color (SOC) Retention Efforts DDSDStaff of Color (SOC) Retention Efforts DDSD
Staff of Color (SOC) Retention Efforts DDSD
 
call girls in Kamla Market (DELHI) 🔝 >༒9953330565🔝 genuine Escort Service 🔝✔️✔️
call girls in Kamla Market (DELHI) 🔝 >༒9953330565🔝 genuine Escort Service 🔝✔️✔️call girls in Kamla Market (DELHI) 🔝 >༒9953330565🔝 genuine Escort Service 🔝✔️✔️
call girls in Kamla Market (DELHI) 🔝 >༒9953330565🔝 genuine Escort Service 🔝✔️✔️
 
Kisan Call Centre - To harness potential of ICT in Agriculture by answer farm...
Kisan Call Centre - To harness potential of ICT in Agriculture by answer farm...Kisan Call Centre - To harness potential of ICT in Agriculture by answer farm...
Kisan Call Centre - To harness potential of ICT in Agriculture by answer farm...
 
How to Configure Email Server in Odoo 17
How to Configure Email Server in Odoo 17How to Configure Email Server in Odoo 17
How to Configure Email Server in Odoo 17
 
Employee wellbeing at the workplace.pptx
Employee wellbeing at the workplace.pptxEmployee wellbeing at the workplace.pptx
Employee wellbeing at the workplace.pptx
 
Organic Name Reactions for the students and aspirants of Chemistry12th.pptx
Organic Name Reactions  for the students and aspirants of Chemistry12th.pptxOrganic Name Reactions  for the students and aspirants of Chemistry12th.pptx
Organic Name Reactions for the students and aspirants of Chemistry12th.pptx
 
How to Make a Pirate ship Primary Education.pptx
How to Make a Pirate ship Primary Education.pptxHow to Make a Pirate ship Primary Education.pptx
How to Make a Pirate ship Primary Education.pptx
 
A Critique of the Proposed National Education Policy Reform
A Critique of the Proposed National Education Policy ReformA Critique of the Proposed National Education Policy Reform
A Critique of the Proposed National Education Policy Reform
 
Mastering the Unannounced Regulatory Inspection
Mastering the Unannounced Regulatory InspectionMastering the Unannounced Regulatory Inspection
Mastering the Unannounced Regulatory Inspection
 
Interactive Powerpoint_How to Master effective communication
Interactive Powerpoint_How to Master effective communicationInteractive Powerpoint_How to Master effective communication
Interactive Powerpoint_How to Master effective communication
 
Concept of Vouching. B.Com(Hons) /B.Compdf
Concept of Vouching. B.Com(Hons) /B.CompdfConcept of Vouching. B.Com(Hons) /B.Compdf
Concept of Vouching. B.Com(Hons) /B.Compdf
 
Introduction to ArtificiaI Intelligence in Higher Education
Introduction to ArtificiaI Intelligence in Higher EducationIntroduction to ArtificiaI Intelligence in Higher Education
Introduction to ArtificiaI Intelligence in Higher Education
 
9953330565 Low Rate Call Girls In Rohini Delhi NCR
9953330565 Low Rate Call Girls In Rohini  Delhi NCR9953330565 Low Rate Call Girls In Rohini  Delhi NCR
9953330565 Low Rate Call Girls In Rohini Delhi NCR
 

Business economics3

  • 1. 1 Business economics (3) Consumable equilibrium Consumer’s Equilibrium through Utility: A consumer is one who buys goods and services for his/her personal satisfaction. In theoretical terms, consumer’s equilibrium is achieved at a point when he/she reaches to the maximum level of his/her satisfaction, given resources and other conditions. On the other hand, in technical terms, a consumer reaches his maximum satisfaction level when the last unit of money spent on each good yield the same utility. Let us take an example of one good to explain how a consumer reaches equilibrium. Suppose a consumer consumes only one good X with a given income. He has two options either to spend income to purchase good X or retain it in the form of an asset. If the MU of good X (MUx) is greater than MU of money (MUm), the consumer would purchase the good. Therefore, the consumer would spend his income on good X as long as utility of a good is greater than the price of a good, which implies MUx > Px (MUm). Here, the assumption is that MU of a good diminishes as more and more unit of the good is consumed and MU of money remains constant that is MUm=1. Thus, consumer reaches equilibrium when: MUx = Px(MUm) Or Mux/Px (MUm) = 1
  • 2. 2 The consumer’s equilibrium is shown graphically in Figure- 4: As shown in Figure-4, the horizontal line Px shows the constant utility of money and MUx curve represents the diminishing marginal utility of a good. The intersection of MUx and Px curve takes place at E that is when quantity consumed is OQx, then MUx=Px(MUm). Thus, consumer achieves equilibrium at E. Above point E, MUx > Px(MUm) implying that a consumer increase the consumption of good as utility achieved is more. At point R, consumer gains MU as RC where cost incurred is TC. Thus, marginal gain is RT and this situation exists till a consumer reaches point E. If we look at the point below point E, where MUx < Px (MUm), a consumer would consume more than OQx and loses utility. Thus, satisfaction is increased by reducing the consumption. Therefore, point E is the equilibrium point. In real life, a consumer consumes a large amount of goods, thus question arises how a consumer achieves equilibrium in case of a number of goods. A rational consumer consumes goods according to the preference. He/she would first
  • 3. 3 purchase the good that yields the highest utility followed by the good yielding second highest utility. The expenditure is switched from one good to another till a stage is reached when MU of each good is same per unit of expenditure. This is called law of equi-marginal utility. Let us discuss consumer equilibrium in case of two goods X and Y whose prices are Px and Py, respectively. Consumer’s equilibrium is given as: MUx=Px (MUm) And MUy=Py(MUm) The consumer’s equilibrium is expressed as: MUx/Px(MUx) = 1 = MUy/Py(MUy) It can be further rewritten as: MUx/Px = MUy/Py The aforementioned equation implies that a consumer reaches the equilibrium when MU derived from each rupees spent on two goods is same. or MUx/MUy = Px/Py The aforementioned equation implies that a consumer is in equilibrium when MU ratio of any two goods equals the price ratio. Let us now take the numerical example to learn consumer’s equilibrium with the help of Table-2: Table-2 Consumer’s Equilibrium Consumption (Units) Total Utility (Rs) Marginal Utility (Rs) Total Expenditure (Market price=Rs.3) Gain to consumer 0 0 0 - - 1 4 4 3 1 2 7 3 6 1 3 9 2 9 0 4 10 1 12 -2 5 10 0 15 -5
  • 4. 4 From Table-2, it can be seen when a consumer buys one unit of a good at the market price of Rs. 3, he/she gains utility worth Rs. 4 In such a case, the consumer gains Re. 1. When he/she buys two units, the utility gained is Rs. 7 and total price paid is Rs 6. Again, he/she gains Re 1. Next, when he/she purchases three units, the utility gained is Rs. 9 and price paid is Rs. 9. In such a case’ he/she does not gain anything. If he buys further, the total gain would become negative. From Table-2, it can be seen that MU is equal to price two units of consumption. Consumer equilibrium is achieved when the consumer buys two units because at this point quantity and utility gained is maximum and MU (Rs. 3) is equal to price (Rs. 3). Derivation of Individual Demand: The derivation of demand curve was done on the basis of the law of demand. It should be noted that the demand curve and law of demand are based on the utility maximizing behavior of consumers. The analysis of consumer equilibrium helps in deriving an individual demand curve for a good. As discussed earlier, consumer equilibrium takes place when MUx= Px (MUm).
  • 5. 5 Figure-5 shows the derivation of demand curve from MUx: Figure-5 shows the derivation of demand curve for good X. The price quantity combination corresponding to equilibrium points E1 E2 and E3 are shown at point J, K, and L, respectively which gives a demand curve for good X. Suppose E1 is the point of equilibrium at price P3 and quantity OQ1. If price falls to P2, the equilibrium would be disturbed and shift to E2 with quantity OQ2. Similarly, when the price becomes P1, equilibrium shifts to E3 with quantity OQ3. Thus, when price increases, quantity demanded decreases. This inverse relationship between price and quantity gives the demand curve. Explaining with the help of utility, if P3 falls to P2, MUx > P3 (MUm) at OQ1. Thus, for maintaining equilibrium, the quantity demanded by a consumer should increase to OQ2, which would reduce MUx. Thus, equilibrium is achieved at MUx =P2 (MUm).
  • 6. 6 Consumer satisfaction It is a measure of how products and services supplied by a company meet or surpass customer expectation. Customer satisfaction is defined as "the number of customers, or percentage of total customers, whose reported experience with a firm, its products, or its services (ratings) exceeds specified satisfaction goals."
  • 7. 7 Consumer equilibrium The state of balance achieved by an end user of products that refers to the amount of goods and services they can purchase given their present level of income and the current level of prices. Consumer equilibrium allows a consumer to obtain the most satisfaction possible from their income.
  • 8. 8 In economics, equilibrium implies a position of rest characterized by absence of change. ... This price is often called the equilibrium price or market clearing price and will tend not to change unless demand or supply change In economics, general equilibrium theory attempts to explain the behavior of supply, demand, and prices in a whole economy with several or many interacting markets, by seeking to prove that the interaction of demand and supply will result in an overall general equilibrium. Alfred Marshall, FBA (26 July 1842 – 13 July 1924) was one of the most influential economists of
  • 9. 9 his time. His book, Principles of Economics (1890), was the dominant economic textbook in England for many years. It brings the ideas of supply and demand, marginal utility, and costs of production into a coherent whole. In economics, an ordinal utility function is a function representing the preferences of an agent on an ordinal scale. The ordinal utility theory claims that it is only meaningful to ask which option is better than the other, but it is meaningless to ask how much better it is or how good it is. All of the theory of consumer decision- making underconditionsof certainty can be, and typically is, expressed in terms of ordinal utility. Customerequilibrium The point at which the costumer is satisfied for a given commodity is all about Customer equilibrium Cardinal Utility. Definition: The Cardinal Utility approach is propounded by neo-classical economists, who believe that utility is measurable, and the customer can express his satisfaction in cardinal or quantitative numbers, such as 1,2,3, and so on.
  • 10. 10 What is cardinal and ordinal utility in economics? Meaning. Cardinal utility is the utility wherein the satisfaction derived by the consumers from the consumption of good or service can be expressed numerically. Ordinal utility states that the satisfaction which a consumer derives from the consumption of good or service cannot be expressed numerical units. Utility Definition Utility is a term used by economists to describe the measurement of "useful-ness" that a consumer obtains from any good. ... Utility may measure how much one enjoys a movie, or the sense of security one gets from buying a deadbolt. Revealed preference theory, pioneered by economist Paul Samuelson, is a method of analyzing choices made by individuals, mostly used for comparing the influence of policies on consumer behavior. Revealed preference models assume that the preferences of consumers can be revealed by their purchasing habits.
  • 11. 11 REVEALED PREFERENCE THEORY The revealed preference approach is quite distinct from the two approaches. Alfred Marshall who built up the theory of demand on the basis of the marginal utility analysis. J.R. Hicks who reconstructed the theory of consumer’s behavior on the basis of the indifference curve analysis. THE YOUNG INDIAN ECONOMISTS REVEALED PREFERENCE THEORY REVEALED PREFERENCE THEORY The revealed preference approach has been propounded by the American Economists, Prof. Paul A. Samuelson in his article “Consumption Theory In Terms Of Revealed Preference” in 1938. This theory relies on the market behavior of the consumer to know about his preferences with regard to the various combinations for the two reactions and responses of the consumer. THE YOUNG INDIAN ECONOMISTS ASSUMPTIONS The consumer has only two combinations of commodities The income of the consumer, prices of the two commodities are constant during the period of analysis The tastes of the consumer are given and remain unchanged during the period of analysis The consumer should choose only one combination of the commodities in a given price-income situation Based on observed facts and ordinal utility analysis
  • 12. 12 ASSUMPTIONS A consumer can be persuaded to buy more of a commodity if its price is subjected to substantial cut The choice of the consumer reveals his preference and market behavior of the consumer Consistency states strong ordering preference hypothesis of Samuelson Transitivity states that no two observations of choice behavior can conflict with regard to an individual consumer’s preferences. EXPLANATION OF THE THEORY When a consumer purchases some commodities either because, he likes them more than other cheaper than other commodities There are two combinations of commodities; X and Y Consumer buys combination of X and not combination of Y Assuming that both the commodities are equally same cost and are equally good If the consumer buys X combination rather than Y commodity, because he like X combination better and revealed preference took place The price line PL reflects the income-price situation for the consumer EXPLANATION OF THE THEORY The consumer can choose any combination lying on the price line i.e. C, A, B; below and to the left of the price line G, E, D, F The consumer can purchase any combination within the triangle known as Consumer’s Choice Triangle These are all alternative combinations and the consumer is free
  • 13. 13 to choose any one of them The combinations lying on the price line is equally costly The combinations lying below the price line i.e. Consumer’s Choice Triangle is inferior zone The combinations lying above the price line is superior zone The gap between preferred zone and inferior zone is said to be ignorance zone. REVEALED PREFERENCE THEORY THE YOUNG INDIAN ECONOMISTS REVEALED PREFERENCE THEORY MERITS OF REVEALED PREFERENCE THEORY More realistic More scientific More consistent Based on fewer assumptions DEMERITS OF REVEALED PREFERENCE THEORY Ruled out the possibility of indifference in the behavior of the consumer Fails to bring distinction between the income effect and the substitution effect of a price change Deals only with the individual demand curve Takes into account only that consumer whose market behavior is governed strictly by the current market conditions CONCLUSION Prof. Samuelson’s revealed preference theory is really an improvement up on the indifference curve analysis It has more implications for welfare economics The method of actual observation makes it superior to other demand theories The revealed preference theory is restrictive. “In Samuelson’s revealed preference theory what is gained is rig our and
  • 14. 14 methodology is lost in the narrowness of the scope of its application”. Consumption Bundle A consumption bundle is a set of goods that a consumer may choose to consume. (Two or more commodities with limited income) Consumer budget A budget constraint represents all the combinations of goods and services that a consumer may purchase given current prices within his or her given income. Consumer theory uses the concepts of a budget constraint and a preference map to analyze consumer choices.(Budget allocated for spending goods and services ) Budgets sets A budget set or opportunity set includes all possible consumption bundles that someone can afford given the prices of goods and the person's income level. The budget set is bounded above by the budget line. (A set of consumption bundle purchased within the limited income) Rate of substitution In economics, the marginal rate of substitution (MRS) is the rate at which a consumer can give up some amount of one good in exchange for another good while maintaining the same level of utility. At equilibrium consumption levels (assuming no externalities), marginal rates of substitution are identical. (Rate at which the rate is substituted for another, acceptance of a customer to purchase one with a substation of other )
  • 15. 15 Marginal rate of substitution In economics, the marginal rate of substitution is the rate at which a consumer can give up some amount of one good in exchange for another good while maintaining the same level of utility. At equilibrium consumption levels, marginal rates of substitution are identical. What is the Marginal Rate of Substitution? In economics, the marginal rate of substitution (MRS) is the amount of a good that a consumer is willing to give up for another good, as long as the new good is equally satisfying. It's used in indifference theory to analyze consumer behavior. The marginal rate of substitution is calculated between two goods placed on an indifference curve, displaying a frontier of equal utility for each combination of "good A" and "good B." The amount of good to sacrifice to purchase one more units Revealed preference approach Revealed preference theory, pioneered by economist Paul Samuelson, is a method of analyzing choices made by individuals, mostly used for comparing the influence of policies on consumer behavior. Revealed preference models assume that the preferences of consumers can be revealed by their purchasing habits Marginal utility In economics, utility is the satisfaction or benefit derived by consuming a product; thus the marginal utility of a good or service is the change in the utility from an increase in the consumption of that good or service.
  • 16. 16 Co ordinal utility Cardinal utility is the utility wherein the satisfaction derived by the consumers from the consumption of good or service can be measured numerically. Ordinal utility states that the satisfaction which a consumer derives from the consumption of product or service cannot be measured numerically. What is the meaning of ordinal utility? In economics, an ordinal utility function is a function representing the preferences of an agent on an ordinal scale. The ordinal utility theory claims that it is only meaningful to ask which option is better than the other, but it is meaningless to ask how much better it is or how good it is. Utility analysis is a quantitative method that estimates the dollar value of benefits generated by an intervention based on the improvement it produces in worker productivity. a) Utility is the want – satisfying power of good or service b) Usually referred to as “satisfaction” derived from consumption. c) Utility is subjective ,based on whims and fancies of consumers d) But early Neoclassical economists assumed that it can be measured –called cardinal utility analysis e) Walras, Called the want satisfying power of goods as utile. The wants capacity to fulfill our needs .The wants satisfying capacities of a particular product is called utility.
  • 17. 17 Total Utility Total utility is the aggregate level of satisfaction or fulfillment that a consumer receives through the consumption of a specific good or service. Each individual unit of a good or service has its own marginal utility, and the total utility is simply the sum of all the marginal utilities of the individual units. The total satisfaction derive from the consumption about the same commodity Marginal utility In economics, utility is the satisfaction or benefit derived by consuming a product; thus the marginal utility of a good or service is the change in the utility from an increase in the consumption of that good or service.
  • 18. 18 Additional utility of utility to consuming to one more extra units .It is the additional law of definition of marginal utility It states that each additional units will decline No: of dhosha Utility (U) Total utility (Tu) Marginal Utility (Mu) 1 10 10 - 2 8 18 8 3 5 23 5 4 2 25 2 5 - 25 0 6 -1 24 -1 7 -2 22 -2 35 30 25 * * * * 20 * * 15 10 * 5 0 0 1 2 3 4 5 6 7 8 9 10 11 12 13
  • 19. 19 “utility” and show experimentally that experienced utility, unlike decision-utility, is not being maximized. ... This definition of experienced utility has the obvious advantage of being simple and natural for an economist. We also refer to “satisfaction” and “dissatisfaction” as a measure of pleasure and pain. What is law of marginal utility? The Law of Diminishing Marginal Utility states that all else equal as consumption increases the marginal utility derived from each additional unit declines. ... Utility is an economic term used to represent satisfaction or happiness. What is an example of marginal utility? Diminishing Marginal Utility. Consuming one candy bar may satisfy a person's sweet tooth. If a second candy bar is consumed, the satisfaction of eating that second bar will be less than the satisfaction gained from eating the first. If a third is eaten, the satisfaction will be even less. Marginal Utility Formula Marginal Utility = Change in total utility Change in number of units consumed Bar of Chocolate Total Utility Marginal Utility 1 5 5 2 11 6 3 16 5 4 19 3 5 19 0 6 17 –2
  • 20. 20 Indifference curve An indifference curve connects points on a graph representing different quantities of two goods, points between which a consumer is indifferent. That is, the consumer has no preference for one combination or bundle of goods over a different combination on the same curve What is an Indifference Curve? It is a curve that represents all the combinations of goods that give the same satisfaction to the consumer. Since all the combinations give the same amount of satisfaction, the consumer prefers them equally. Hence the name Indifference Curve. Here is an example to understand the indifference curve better. Peter has 1 unit of food and 12 units of clothing. Now, we ask Peter how many units of clothing he is willing to give up in exchange for an additional unit of food so that his
  • 21. 21 level of satisfaction remains unchanged. Peter agrees to give up 6 units of clothing for an additional unit of food. Hence, we have two combinations of food and clothing giving equal satisfaction to Peter as follows: 1 unit of food and 12 units of clothing 2 units of food and 6 units of clothing By asking him similar questions, we get various combinations as follows: Combination Food Clothing A 1 12 B 2 6 C 3 4 D 4 3 Graphical Representation: The diagram shows an Indifference curve (IC). Any combination lying on this curve gives the same level of consumer satisfaction. It is also known as Iso-Utility Curve.
  • 22. 22 Indifference Map An Indifference Map is a set of Indifference Curves. It depicts the complete picture of a consumer’s preferences. The following diagram showing an indifference map consisting of three curves: We know that a consumer is indifferent among the combinations lying on the same indifference curve. However, it is important to note that he prefers the combinations on the higher indifference curves to those on the lower ones. This is because a higher indifference curve implies a higher level of satisfaction. Therefore, all combinations on IC1 offer the same satisfaction, but all combinations on IC2 give greater satisfaction than those on IC1.
  • 23. 23 Marginal Rate of Substitution This is the rate at which a consumer is prepared to exchange a good X for Y. If we go back to Peter’s example above, we have the following table: Combination Food Clothing MRS A 1 12 – B 2 6 6 C 3 4 2 D 4 3 1 In this example, Peter initially gives up 6 units of clothing to get an extra unit of food. Hence, the MRS is 6. Similarly, for subsequent exchanges, the MRS is 2 and 1 respectively. Therefore, MRS of X for Y is the amount of Y whose loss can be compensated by a unit gain of X, keeping the satisfaction the same. Interestingly, as Peter accumulates more units of food, the MRS starts falling – meaning he is prepared to give up fewer units of clothing for food. There are two reasons behind this: As Peter gets more units of food, his intensity of desire for additional units of food decreases. Most of the goods are imperfect substitutes for one another. If they could substitute one another perfectly, then MRS would remain constant. Properties of an Indifference Curve or IC Here are the properties of an indifference curve: An IC slopes downwards to the right This slope signifies that when the quantity of one commodity in combination is increased, the amount of the other commodity
  • 24. 24 reduces. This is essential for the level of satisfaction to remain the same on an indifference curve. An IC is always convex to the origin From our discussion above, we understand that as Peter substitutes clothing for food, he is willing to part with less and less of clothing. This is the diminishing marginal rate of substitution. The rate gives a convex shape to the indifference curve. However, there are two extreme scenarios: Two commodities are perfect substitutes for each other – In this case, the indifference curve is a straight line, where MRS is constant. Two goods are perfect complementary goods – An example of such goods would be gasoline and water in a car. In such cases, the IC will be L-shaped and convex to the origin. Indifference curves never intersect each other Two ICs will never intersect each other. Also, they need not be parallel to each other either. Look at the following diagram:
  • 25. 25 Fig 3 shows tow ICs intersecting each other at point A. Since A and B lie on IC1, the give the same satisfaction level. Similarly, A and C give the same satisfaction level, as they lie on IC2. Therefore, we can imply that B and C offer the same level of satisfaction, which is logically absurd. Hence, no tow ICs can touch or intersect each other. A higher IC indicates a higher level of satisfaction as compared to a lower IC A higher IC means that a consumer prefers more goods than not. An IC does not touch the axis This is not possible because of our assumption that a consumer considers different combinations of two commodities and wants both of them. If the curve touches either of the axes, then it means that he is satisfied with only one commodity and does not want the other, which is contrary to our assumption. Budget Line Since a higher indifference curve represents a higher level of satisfaction, a consumer will try to reach the highest possible IC to maximize his satisfaction. In order to do so, he has to buy more goods and has to work under the following two constraints: He has to pay the price for the goods and He income is limited, restricting the availability of money for purchasing these goods
  • 26. 26 As can be seen above, a budget line shows all possible combinations of two goods that a consumer can buy within the funds available to him at the given prices of the goods. All combinations that are within his reach lie on the budget line. A point outside the line (point H) represents a combination beyond the financial reach of the consumer. On the other hand, a point inside the line (point K) represents under- spending by the consumer. Indifferent curve The combination of two goods purchase of different commodity to get l satisfaction equally Combination Food Cloth Satisfaction MRS A 1 12 SAME - B 2 6 SAME 6 C 3 4 SAME 2 D 4 3 SAME 1 The graphical representation of a tabular form is the indifferent curve
  • 27. 27 10 8 6 Cloth 4 IC3 2 IC2 Ic1 1 2 3 4 5 6 Food Indifferent map A set of indifference curve is known as Indifferent map
  • 28. 28 Marginal rate of substitution The marginal rate of substitution is the rate at which a consumer can give up some amount of one good in exchange for another good while maintaining the same level of utility. At equilibrium consumption levels, marginal rates of substitution are identical. The marginal rate of substitution (MRS) quantifies the amount of one good a consumer will give up to obtain more of another good MRS is measured by the slope of indifference curve
  • 29. 29 Properties of marginal rate of substitution The marginal rate of substitution (MRS) is the rate at which a consumer can give up some amount of one good in exchange for another good while maintaining the same level of utility. At equilibrium consumption levels (assuming no externalities), marginal rates of substitution are identical. a) Because of the law of diminishing marginal rate of substitution , indifference curve are bowed in toward the origin b) Indifference curve do not intersect c) Indifferent curves are a graphical representation of consumer’s tastes for the two goods d) Always downwards to the right .It will be convex to the origin ,because of the dimension marginal rate of substation e) Indifferent curve never intersect each other and it does not touch axis 1) Indifference Curves and Utility Maximization Marginal utility analysis requires some numerical measure of utility in order to determine the optimal consumption combinations Economists have developed another, more general, approach to utility and consumer behavior This approach does not require that numbers be attached to specific levels of utility
  • 30. 30 2) Indifference Curves and Utility Maximization All this new approach requires is that consumers be able to rank their preferences for various combinations of goods specifically, the consumer should be able to say whether Combination A is preferred to combination B Combination B is preferred to combination A. or both combinations are equally preferred 3) Consumer Preferences Indifference curve shows all combinations of goods that provide the consumer with the same satisfaction, or the same utility Thus, the consumer finds all combinations on a curve equally preferred since each of the alternative bundles of goods yields the same level of utility, the consumer is indifferent about which combination is actually consumed 4) Indifference Curves For a person to remain indifferent among consumption combinations, the increase in utility from eating more pizza must just offset the decrease in utility from watching fewer videos Thus, along an indifference curve, there is an inverse relationship between the quantity of one good consumed and the quantity of another consumed indifference curves slope down
  • 31. 31 5) Indifference Curves They are bowed inward toward the originIndifference curves are also convex to the origin The curve gets flatter as you move down it The marginal rate of substitution, or MRS, between pizza and videos indicates the number of videos that the consumer is willing to give up to get one more pizza, while maintaining the same level of total utility 6) Marginal Rate of Substitution The MRS measures the consumers’ willingness to trade videos for pizza depends on the amount of each good the consumer is consuming at the time Mathematically, the MRS is equal to the absolute value of the slope of the indifference curve For example, in moving from combination a to combination b, the consumer is slope between thesewilling to give up 4 videos to get 1 more pizza MRS =two points equals –4 4; from b to c, MRS = 1 7) Marginal Rate of Substitution The law of diminishing marginal rate of substitution says that as a person’s consumption of pizza increases, the number of videos that they are willing to give up to get another pizza declines This as weimplies that the indifference curve has a diminishing slope move down the indifference curve, the consumption of pizza increases and the marginal utility of additional pizza declines
  • 32. 32 8) Indifference Map We can use the same approach to generate a series of indifference curves, called an graphical representation of a consumer’s tastesindifference map Each curve in the map reflects a different level of utility 9) Properties of Indifference Curves A particular indifference curve reflects a constant level of utility the consumer is indifferent among all consumption combinations along a given curve If total utility is to remain constant, an increase in the consumption of one good must be offset by a indifference curves decrease in the consumption of the other good slope downward Higher indifference curves represent higher levels of utility 10) Properties of Indifference Curves Because of the law of diminishing marginal rate of substitution, indifference curves are bowed in toward the origin Indifference curves do not intersect Indifference curves are a graphical representation of a consumer’s tastes for the two goods 11) Properties of Indifference Curves Once we have the consumer’s indifference may, we turn to the issue of how much of each
  • 33. 33 good will be consumed? To answer this question, we must consider the relative prices of the two goods and the consumer’s income 12) Budget Line Budget line depicts all possible combinations of movies and pizzas, given prices and your budget Suppose movies rent for $4, pizza sells for $8, and the budget is $40 per week if you spend the entire $40 on videos, consumer can purchase 10 videos, and if on pizzas person can afford 5 per week 13) Summary The indifference curve indicates what the consumer is willing to buy the budget line shows what the consumer is able to buy when the indifference curve and the budget line are combined; we find the quantities of each good the consumer is both willing and able to buy 14) Consumer Equilibrium Consumer equilibrium occurs where the slope of the indifference curve is equal to the slope of the budget line Recall that the absolute value of the slope of the indifference curve is the marginal rate of substitution, and the absolute value of the slope of the budget line equals the price ratio 15) Consumer Equilibrium Thus, MRS = Pp / Pv Further, the marginal rate of substitution of pizzas for video rentals can be MRS = MUp / MUv found from the marginal utilities of pizza and video
  • 34. 34 16) Consumer Equilibrium In fact, the absolute value of the slope of the indifference curve equals MUp/MUv and the equilibrium condition the slope of the budget line equals pp / pv for the indifference curve approach can be written as 17) Effects of a Change in Price What happens to the consumer’s equilibrium consumption when there is a change in price? The answer can be found by using indifference curve approach to derive the demand curve 18) Income and Substitution Effects The law of demand was initially explained in terms of an income effect and a substitution effect with indifference curve analysis we have the analytical tools to examine these two effects more precisely Law of utility of dimension The Law Of Diminishing Marginal Utility states that all else equal as consumption increases the marginal utility derived from each additional unit declines. Marginal utility is derived as the change in utility as an additional unit is consumed. Utility is an economic term used to represent satisfaction or happiness.
  • 35. 35 Law of diminishing marginal utility The law is true under certain assumptions as follows a) Rationality : The consumer aims at maximization of utility subject to availability of his income b) Constant marginal utility of money: The marginal utility of money based for purchasing goods remains constant. c) Diminishing marginal utility : The utility gained from the successive units of a commodity diminishes in a given time period d) Utility is additive : The utility of different commodities are independent Cardinal utility approach Cardinal Utility. Definition: The Cardinal Utility approach is propounded by neo-classical economists, who believe that utility is measurable, and the customer can express his satisfaction in cardinal or quantitative numbers, such as 1,2,3, and so on. Production function A production function gives the technological relation between quantities of physical inputs and quantities of output of goods.
  • 36. 36 A production function is a tool of analysis used to explain the input output relationship .It expresses physical relationship between production inputs and the resultant output. It tells us that how much maximum output can be obtained in the specified set of inputs and in the given state of technology Mathematically, the production function can be expressed as Q=f (K, L) Q is the level of output K= Units of capital L = Units of labour f= Represents the production technology
  • 37. 37 Production analysis Production is a process of transformation of the factors of production into the economic goods. So in term of production analysis we are dealing with the physical relationships between inputs and outputs (i.e. we are observing the dependence of physical production volume on physical quantity of the inputs). What do you mean by production analysis? PRODUCTION ANALYSIS Production Function. The technological physical relationship between inputs and outputs per unit of time is referred to as production function. The relationship between the inputs to the production process and the resulting output is described by a production function.
  • 38. 38 Productivity Productivity describes various measures of the efficiency of production. A productivity measure is expressed as the ratio of output to inputs used in a production process, i.e. output per unit of input. Productivity is a crucial factor in production performance of firms and nations. Service A service is a transaction in which no physical goods are transferred from the seller to the buyer. The benefits of such a service are held to be demonstrated by the buyer's willingness to make the exchange. Public services are those that society as a whole pays for. The four Ps are the categories involved in the marketing of a good or service, and they include product, price, place and promotion. a) Product Function packaging services In marketing, a product is a system made available for consumer use; it is anything that can be offered to a market to satisfy the desire or need of a customer. In retailing, products are often referred to as merchandise, and in manufacturing, products are bought as raw materials and then sold as finished goods
  • 39. 39 b)Price Cost discount margin A price is the quantity of payment or compensation given by one party to another in return for one unit of goods or services. c) Place Distribution logistics channel You can use the place to refer to the point, building, area, town, or country that you have already mentioned. d)Promotion Advertising sales publicity A promotion refers to the advancement of an employee's rank or position in a hierarchical structure. In marketing, promotion refers to a different sort of advancement. A sales promotion entails the features - via advertising and/or a discounted price - of a particular product or service. Once you've developed your marketing strategy, there is a "Seven P Formula" you should use to continually evaluate and reevaluate your business activities. These seven are: product, price, promotion, place, packaging, positioning and people.
  • 40. 40 Marketing Mix Definition: The marketing mix definition is simple. It is about putting the right product or a combination thereof in the place, at the right time, and at the right price. The difficult part is doing this well, as you need to know every aspect of your business plan. As we noted before, the marketing mix is predominately associated with the 4P’s of marketing, the 7P’s of service marketing, and the 4 Cs theories developed in the 1990s
  • 41. 41 Marketing Mix 4P's A marketing expert named E. Jerome McCarthy created the Marketing 4Ps in the 1960s. This classification has been used throughout the world. Business schools teach this concept in basic marketing classes. 1) Marketing Mix – Product A product is an item that is built or produced to satisfy the needs of a certain group of people. The product can be intangible or tangible as it can be in the form of services or goods. You must ensure to have the right type of product that is in demand for your market. So during the product
  • 42. 42 development phase, the marketer must do an extensive research on the life cycle of the product that they are creating. A product has a certain life cycle that includes the growth phase, the maturity phase, and the sales decline phase. It is important for marketers to reinvent their products to stimulate more demand once it reaches the sales decline phase. Marketers must also create the right product mix. It may be wise to expand your current product mix by diversifying and increasing the depth of your product line. All in all, marketers must ask themselves the question “what can I do to offer a better product to this group of people than my competitors”. In developing the right product, you have to answer the following questions: 1) What does the client want from the service or product? 2) How will the customer use it? 3) Where will the client use it? 4) What features must the product have to meet the client’s needs? 5) Are there any necessary features that you missed out? 6) Are you creating features that are not needed by the client? 7) What’s the name of the product? 8) Does it have a catchy name? 9) What are the sizes or colors available? 10) How is the product different from the products of your competitors? 11) What does the product look like?
  • 43. 43 2) Marketing Mix – Price The price of the product is basically the amount that a customer pays for to enjoy it. Price is a very important component of the marketing mix definition. It is also a very important component of a marketing plan as it determines your firm’s profit and survival. Adjusting the price of the product has a big impact on the entire marketing strategy as well as greatly affecting the sales and demand of the product. This is inherently a touchy area though. If a company is new to the market and has not made a name for themselves yet, it is unlikely that your target market will be willing to pay a high price. Although they may be willing in the future to hand over large sums of money, it is inevitably harder to get them to do so during the birth of a business. Pricing always help shape the perception of your product in consumers eyes. Always remember that a low price usually means an inferior good in the consumer’s eyes as they compare your good to a competitor.
  • 44. 44 Consequently, prices too high will make the costs outweigh the benefits in customer’s eyes, and they will therefore value their money over your product. Be sure to examine competitors pricing and price accordingly. When setting the product price, marketers should consider the perceived value that the product offers. There are three major pricing strategies, and these are: a) Market penetration pricing b) Market skimming pricing c) Neutral pricing Here are some of the important questions that you should ask yourself when you are setting the product price: 1) How much did it cost you to produce the product? 2) What is the customers’ perceived product value? 3) Do you think that the slight price decrease could significantly increase your market share? 4) Can the current price of the product keep up with the price of the product’s competitors?
  • 45. 45 3) Marketing Mix – Place Placement or distribution is a very important part of the product mix definition. You have to position and distribute the product in a place that is accessible to potential buyers. This comes with a deep understanding of your target market. Understand them inside out and you will discover the most efficient positioning and distribution channels that directly speak with your market. There are many distribution strategies, including: 1) Intensive distribution 2) Exclusive distribution 3) Selective distribution 4) Franchising Here are some of the questions that you should answer in developing your distribution strategy: 1) Where do your clients look for your service or product? 2) What kind of stores do potential clients go to? Do they shop in a mall, in a regular brick and mortar store, in the supermarket, or online? 3) How do you access the different distribution channels?
  • 46. 46 4) How is your distribution strategy different from your competitors? 5) Do you need a strong sales force? 6) Do you need to attend trade fairs? 7) Do you need to sell in an online store? 4) Marketing Mix – Promotion Promotion is a very important component of marketing as it can boost brand recognition and sales. Promotion is comprised of various elements like: 1) Sales Organization 2) Public Relations 3) Advertising 4) Sales Promotion Advertising typically covers communication methods that are paid for like television advertisements, radio commercials, print media, and internet advertisements. In contemporary times, there seems to be a shift in focus offline to the online world. Public relations, on the other hand, are communications that are typically not paid for. This includes press releases, exhibitions, sponsorship deals, seminars, conferences, and events.
  • 47. 47 Word of mouth is also a type of product promotion. Word of mouth is an informal communication about the benefits of the product by satisfied customers and ordinary individuals. The sales staff plays a very important role in public relations and word of mouth. It is important to not take this literally. Word of mouth can also circulate on the internet. Harnessed effectively and it has the potential to be one of the most valuable assets you have in boosting your profits online. An extremely good example of this is online social media and managing a firm's online social media presence. In creating an effective product promotion strategy, you need to answer the following questions: 1) How can you send marketing messages to your potential buyers? 2) When is the best time to promote your product? 3) Will you reach your potential audience and buyers through television ads? 4) Is it best to use the social media in promoting the product? 5) What is the promotion strategy of your competitors? Your combination of promotional strategies and how you go about promotion will depend on your budget, the message you want to communicate, and the target market you have defined already in previous steps. Marketing Mix 7P's The 7Ps model is a marketing model that modifies the 4Ps model. The 7Ps is generally used in the service industries.
  • 48. 48 Here is the expansions from the 4Ps to the 7Ps marketing model:
  • 49. 49 6) Marketing Mix – People Of both target market and people directly related to the business. Thorough research is important to discover whether there are enough people in your target market that is in demand for certain types of products and services. The company’s employees are important in marketing because they are the ones who deliver the service. It is important to hire and train the right people to deliver superior service to the clients, whether they run a support desk, customer service, copywriters, programmers…etc. When a business finds people who genuinely believe in the products or services that the particular business creates, it's is highly likely that the employees will perform the best they can. Additionally, they'll be more open to honest feedback about the business and input their own thoughts and passions which can scale and grow the business.
  • 50. 50 This is a secret, “internal” competitive advantage a business can have over other competitors which can inherently affect a business's position in the marketplace. 6 ) Marketing Mix – Process The systems and processes of the organization affect the execution of the service. So, you have to make sure that you have a well- tailored process in place to minimize costs. It could be your entire sales funnel, a pay system, distribution system and other systematic procedures and steps to ensure a working business that is running effectively. Tweaking and enhancements can come later to “tighten up” a business to minimize costs and maximize profits.
  • 51. 51 7) Marketing Mix – Physical Evidence In the service industries, there should be physical evidence that the service was delivered. Additionally, physical evidence pertains also to how a business and its products are perceived in the marketplace. It is the physical evidence of a business' presence and establishment. A concept of this is branding. For example, when you think of “fast food”, you think of McDonalds. When you think of sports, the names Nike and Adidas come to mind. You immediately know exactly what their presence is in the marketplace, as they are generally market leaders and have established a physical evidence as well as psychological evidence in their marketing. They have manipulated their consumer perception so well to the point where their brands appear first in line when an individual is asked to broadly “name a brand” in their niche or industry.
  • 52. 52 Marketing Mix 4C's The 4Cs marketing model was developed by Robert F. Lauterborn in 1990. It is a modification of the 4Ps model. It is not a basic part of the marketing mix definition, but rather an extension. Here are the components of this marketing model: 1) Cost – According to Lauterborn, price is not the only cost incurred when purchasing a product. Cost of conscience or opportunity cost is also part of the cost of product ownership. 2) Consumer Wants and Needs – A company should only sell a product that addresses consumer demand. So, marketers and business researchers should carefully study the consumer wants and needs. 3) Communication – According to Lauterborn, “promotion” is manipulative while communication is “cooperative”. Marketers should aim to create an open dialogue with potential clients based on their needs and wants.
  • 53. 53 4) Convenience – The product should be readily available to the consumers. Marketers should strategically place the products in several visible distribution points. Whether you are using the 4Ps, the 7Ps, or the 4Cs, your marketing mix plan plays a vital role. It is important to devise a plan that balances profit, client satisfaction, brand recognition, and product availability. It is also extremely important to consider the overall “how” aspect that will ultimately determine your success or failure. By understanding the basic concept of the marketing mix and it's extensions, you will be sure to achieve financial success whether it is your own business or whether you are assisting in your workplace's business success. The ultimate goal of business is to make profits and this is a surefire, proven way to achieve this goal. Value added services servitization production is the conversion of input to output, Input may human resources, Raw metrical, land and mercenary etc Factors of production Factors of production, resources, or inputs are what is used in the production process to produce output—that is, finished goods and services. The utilized amounts of the various inputs determine the quantity of output according to the relationship called the production function.
  • 54. 54 Resources required for generation of goods or services, generally classified into four major groups: 1) Land (including all natural resources), 2) Labor (including all human resources), 3) Capital (including all man-made resources), and Enterprise (which brings all the previous resources together for production). These factors are classified also as management, machines, materials, and money (this, the 4 Ms), or other such nomenclature. More recently, knowledge has come to be recognized as distinct from labor, and as a factor of production in its own right. Production Production is a process of combining various material inputs and immaterial inputs in order to make something for consumption. It is the act of creating output, a good or service which has value and contributes to the utility of individuals Production require certain resources and each resources can lie factors of production 1) Land 2) Labour 3) Capital
  • 55. 55 Entrepreneurship Entrepreneurship is the process of designing, launching and running a new business, which is often initially a small business. The people who create these businesses are called entrepreneurs Production decision The production decision is one of the basic decisions made in the. Economy, since total output and employment depend on the aggre- gate of all the production decisions made in firms large and small across the land. Number of decision taken by production manager to covert the available resources to output to fulfill the need and wants of the customer Production include two or more input to on output 1) How should the term produces output 2) How much should the term sell and the cost 3) How should the farm promoted the product 4) How much should be the quantity of product at what rate