Download to read offline


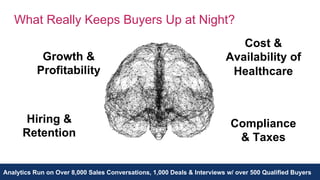
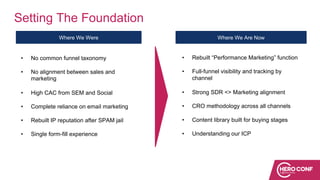
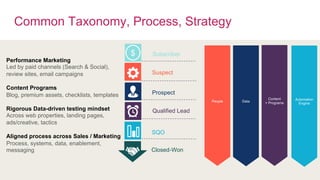


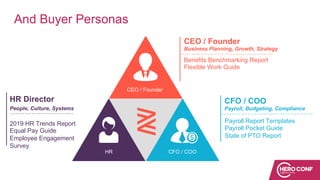


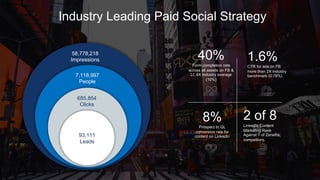
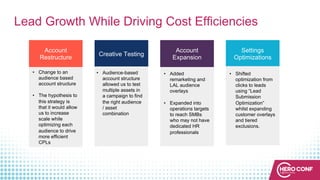
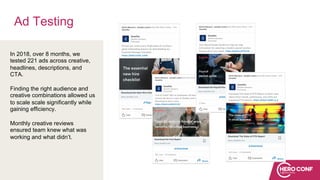
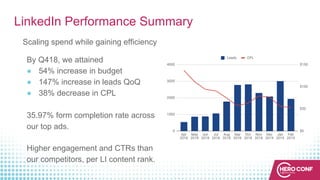
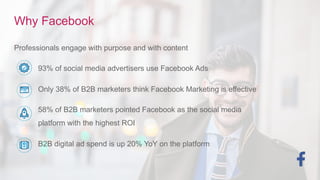
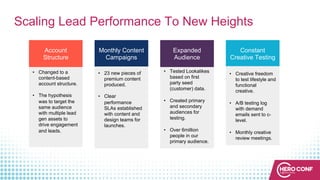
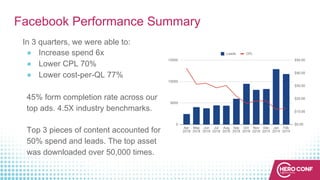


The document outlines a case study on Zenefits, detailing how they transformed their marketing strategy to drive growth through data-driven performance marketing initiatives, particularly on social media. Key elements include creating a content strategy focused on value drivers, aligning sales and marketing activities, and implementing rigorous testing for lead generation efficiency. The results demonstrate significant improvements in engagement metrics, lead conversion rates, and reduced costs per lead across platforms like LinkedIn and Facebook.


![How to Craft an Account-Based Marketing Budget with Kwanzoo and MarianaIQ [PPT]](https://cdn.slidesharecdn.com/ss_thumbnails/slidesmarianakwanzoowebinar-170921184850-thumbnail.jpg?width=640&height=640&fit=bounds)


![LinkedIn - What’s [in] It for You](https://cdn.slidesharecdn.com/ss_thumbnails/linkedin-200211211156-thumbnail.jpg?width=640&height=640&fit=bounds)


![[rokonz.com] Glossary of Semantic SEO Part-1.pdf](https://cdn.slidesharecdn.com/ss_thumbnails/rokonz-260123200456-440e4060-thumbnail.jpg?width=640&height=640&fit=bounds)


