1. For a positive user experience, the whole system is more important than individual devices, as the intelligence of the platform is greater than any single device.
2. Results come from fragmented interactions across multiple devices and situations, not from a single device.
3. The key design challenge is the system architecture and how the parts can connect, rather than any single device's capabilities. User actions activate relationships between parts.
AI, Machine Learning, and their Application for Growth - #GHConf18GrowthHackers
There’s a reason why Adelyn Zhou was listed in Forbes as one of the nine AI minds you should follow ASAP. In this presentation Adelyn will broaden your perspective on how, why, and when AI and machine learning will play a role in your organization’s future growth
Information Visualisation – an introductionAlan Dix
Slides for the Information Visualisation unit of my 2013 online course on HCI
https://hcibook.com/hcicourse/2013/unit/08-infovis
Contents:
* What is Information Visualisation? – making data easier to understand using direct sensory experience – especially visual! ... but can have aural, tactile ‘visualisation’
* Why Information Visualisation? – for the data analyst: scientist, statistician, possibly you; and for the data consumer: audience, client, reader, end-user
* A Brief History of Visualisation – from 2500 BC to 2012
Visualisation in Context Section – how visualisation fits into the decision making process
* Designing Visualisation – choosing representations, managing trade-offs and making them flexible through interaction
* Classic Visualisation – the visualisations that have shaped the area
Recommended for CTOs, architects, IT Managers
COVID-19 has emphasized the fact that business agility and hence technology agility are the most if not the only factors for business success. However, technology agility in most IT departments is not the “strongest muscle”. Technology adoption of Cloud, Devops, Integration, Low-Code and Zero Trust are affecting all IT departments and even the entire organization. New
processes and relationships between the various branches of the IT department should emerge, forsaking old habits and technologies. New technologies and roles\responsibilities are taking their place.
User centred design (UCD) and the connected homeCyber-Duck
This presentation is a summary of a workshop that was conducted at UX London and Mozfest by Cyber-Duck, an agency that merges lean and agile deliver with user centred design (UCD). The workshop was aimed at those wanting to apply UCD to futuristic technologies. The workshop explored the concepts and thinking of ‘how to design an Internet Connected Dishwasher app’ while considering a wider eco system. The workshop started by introducing IoT (and ‘nearables’), why its relevant now and how the UCD process can adapt to it. The workshop frames UCD in a wider product delivery context and is aimed at those wanting to learn on how UX tactics can be applied to successfully design IoT products and systems.
A massive introduction into Lean Product Design. This presentation will set you on track to start thinking lean from day one. Start creating your next online or mobile product using these techniques and tools.
The discovery workshop allows participants to take a strategic view of their project by working towards achieving the business objectives, using business models to visualise, to explore, challenge and settle on the requirements that bring the most value to a project. The requirements analysis activity can include process design, requirements analysis in a user story - acceptance criteria format, data modelling and prototypes. The Discovery workshop pack illustrates how the end product would look as a presentation.
Microsoft Business Intelligence Vision and StrategyNic Smith
Microsoft Business Intelligence slide deck, learn the Microsoft vision and strategy for business intelligence. These slides include the offering and value proposition for Microsoft BI.
How to re-frame business problems to customer-centric opportunity spaces that drive value. Design thinking is your shortcut to customer empathy. A good understanding on how this method could help you identify real customer problems and unmet needs is essential. Moreover we will share techniques and tools that you can implement directly after this crash course. Start inventing the future.
IT Governance PowerPoint Presentation SlidesSlideTeam
This deck consists of total of twenty one slides. It has PPT slides highlighting important topics of It Governance PowerPoint Presentation Slides. This deck comprises of amazing visuals with thoroughly researched content. Each template is well crafted and designed by our PowerPoint experts. Our designers have included all the necessary PowerPoint layouts in this deck. From icons to graphs, this PPT deck has it all. The best part is that these templates are easily customizable. Just click the DOWNLOAD button shown below. Edit the colour, text, font size, add or delete the content as per the requirement. Download this deck now and engage your audience with this ready made presentation. http://bit.ly/39hBT7Z
A very short and compact introduction to the great field of Systems (Design and) Engineering. I gave this presentation on September 7th at the Opening of the Industry Academy at University College of Southeast Norway, in Kongsberg, Norway.
Ever heard of the semantic web? Cloud computing? The Transmission Effect? Lori H. Schwartz, SVP, Director of the Interpublic Emerging Media Lab presents the most up-to-date and exciting emerging trends. Don’t get left behind!
Computing ecosystem that encompasses a range of computing devices, many of which are portable/mobile, that are connected to the internet, through which the consumers are able to seamlessly create, store, access, share and synchronize their data, software / applications, social networks, entertainment content etc.; all of which are always available and can be accessed via apps residing on the devices or through browsers
GfK NIS and nurago: Measuring Digital Consumer Journeysnurago
GfK NIS and nurago are measuring Digital Consumer Journeys across all media types and customer touchpoints.
We combine Network-centered measuring (NIS) with User-centered metering (nurago).
GfK Network Intelligence Solution’s methodology transfers anonymised, real-time IP traffic into fine-grained metrics to understand cross media and long tail consumer behaviour in motion.
GfK nurago‘s LEOtrace® technology measures and tracks individual user behaviour and application usage
on-device within controlled consumer panels.
Measuring and interpreting traffic on mobile network operator’s backbones helps understanding the long tail of Mobile. Currently, data from 5+ million unique users are anonymously evaluated. NIS is new and tested in 7 countries with 8 operators. Data is enriched with demographics, geographics, device features, and content categorisation into a fully consumer privacy proof solution.
nurago‘s LEOtrace® technology provides Holistic Measurement in smaller samples:
Events and data points measured at the point of origin: Web and App Usage, Communication, Location — then enriched with purchase information, attitudinal user feedbacks – and other media usage.
The combination of both results in multidimensional analysis and robust insights.
The presentation was held at M-Days 2012, Feb 1.
White Paper Part 2 Interactive Dooh ExperienceStephen Randall
Building an Interactive Digital Out of Home Experience - Basic Considerations for Mobile & Social Interactivity on Digital Out of Home Networks, August 2009
Executive Summary
Simple text-to-screen and photo-to-screen applications are commonplace at pop concerts. Twitter feeds are springing up in conferences. It can't be too hard to add an engaging mobile and social interactive applications to digital out of home ("DOOH") networks, right? Wrong. A capable interactive DOOH network supports real-time user engagement. Engagement might come from a user at the location or via the web (e.g. via a social network connected to the location through the affinity of a brand). Engagement might be sporadic or frequent, but whenever it happens, it creates an enhanced user experience as well as a measurable "mobile click." The resulting "pulse" for the location can then be used to help the location or advertiser improve services and/or messaging.
iMediaShare integrates smartphones with internet-enabled TVs and game consoles, PS3 and Xbox included, making it possible to browse and play the phone media content from other devices.
A lok at current trends in technology including social business and mobile with some implications for the travel business for the Concur User Conference presentation on Feb 3, 2010
LF Energy Webinar: Electrical Grid Modelling and Simulation Through PowSyBl -...DanBrown980551
Do you want to learn how to model and simulate an electrical network from scratch in under an hour?
Then welcome to this PowSyBl workshop, hosted by Rte, the French Transmission System Operator (TSO)!
During the webinar, you will discover the PowSyBl ecosystem as well as handle and study an electrical network through an interactive Python notebook.
PowSyBl is an open source project hosted by LF Energy, which offers a comprehensive set of features for electrical grid modelling and simulation. Among other advanced features, PowSyBl provides:
- A fully editable and extendable library for grid component modelling;
- Visualization tools to display your network;
- Grid simulation tools, such as power flows, security analyses (with or without remedial actions) and sensitivity analyses;
The framework is mostly written in Java, with a Python binding so that Python developers can access PowSyBl functionalities as well.
What you will learn during the webinar:
- For beginners: discover PowSyBl's functionalities through a quick general presentation and the notebook, without needing any expert coding skills;
- For advanced developers: master the skills to efficiently apply PowSyBl functionalities to your real-world scenarios.
Search and Society: Reimagining Information Access for Radical FuturesBhaskar Mitra
The field of Information retrieval (IR) is currently undergoing a transformative shift, at least partly due to the emerging applications of generative AI to information access. In this talk, we will deliberate on the sociotechnical implications of generative AI for information access. We will argue that there is both a critical necessity and an exciting opportunity for the IR community to re-center our research agendas on societal needs while dismantling the artificial separation between the work on fairness, accountability, transparency, and ethics in IR and the rest of IR research. Instead of adopting a reactionary strategy of trying to mitigate potential social harms from emerging technologies, the community should aim to proactively set the research agenda for the kinds of systems we should build inspired by diverse explicitly stated sociotechnical imaginaries. The sociotechnical imaginaries that underpin the design and development of information access technologies needs to be explicitly articulated, and we need to develop theories of change in context of these diverse perspectives. Our guiding future imaginaries must be informed by other academic fields, such as democratic theory and critical theory, and should be co-developed with social science scholars, legal scholars, civil rights and social justice activists, and artists, among others.
"Impact of front-end architecture on development cost", Viktor TurskyiFwdays
I have heard many times that architecture is not important for the front-end. Also, many times I have seen how developers implement features on the front-end just following the standard rules for a framework and think that this is enough to successfully launch the project, and then the project fails. How to prevent this and what approach to choose? I have launched dozens of complex projects and during the talk we will analyze which approaches have worked for me and which have not.
The Art of the Pitch: WordPress Relationships and SalesLaura Byrne
Clients don’t know what they don’t know. What web solutions are right for them? How does WordPress come into the picture? How do you make sure you understand scope and timeline? What do you do if sometime changes?
All these questions and more will be explored as we talk about matching clients’ needs with what your agency offers without pulling teeth or pulling your hair out. Practical tips, and strategies for successful relationship building that leads to closing the deal.
Essentials of Automations: Optimizing FME Workflows with ParametersSafe Software
Are you looking to streamline your workflows and boost your projects’ efficiency? Do you find yourself searching for ways to add flexibility and control over your FME workflows? If so, you’re in the right place.
Join us for an insightful dive into the world of FME parameters, a critical element in optimizing workflow efficiency. This webinar marks the beginning of our three-part “Essentials of Automation” series. This first webinar is designed to equip you with the knowledge and skills to utilize parameters effectively: enhancing the flexibility, maintainability, and user control of your FME projects.
Here’s what you’ll gain:
- Essentials of FME Parameters: Understand the pivotal role of parameters, including Reader/Writer, Transformer, User, and FME Flow categories. Discover how they are the key to unlocking automation and optimization within your workflows.
- Practical Applications in FME Form: Delve into key user parameter types including choice, connections, and file URLs. Allow users to control how a workflow runs, making your workflows more reusable. Learn to import values and deliver the best user experience for your workflows while enhancing accuracy.
- Optimization Strategies in FME Flow: Explore the creation and strategic deployment of parameters in FME Flow, including the use of deployment and geometry parameters, to maximize workflow efficiency.
- Pro Tips for Success: Gain insights on parameterizing connections and leveraging new features like Conditional Visibility for clarity and simplicity.
We’ll wrap up with a glimpse into future webinars, followed by a Q&A session to address your specific questions surrounding this topic.
Don’t miss this opportunity to elevate your FME expertise and drive your projects to new heights of efficiency.
Transcript: Selling digital books in 2024: Insights from industry leaders - T...BookNet Canada
The publishing industry has been selling digital audiobooks and ebooks for over a decade and has found its groove. What’s changed? What has stayed the same? Where do we go from here? Join a group of leading sales peers from across the industry for a conversation about the lessons learned since the popularization of digital books, best practices, digital book supply chain management, and more.
Link to video recording: https://bnctechforum.ca/sessions/selling-digital-books-in-2024-insights-from-industry-leaders/
Presented by BookNet Canada on May 28, 2024, with support from the Department of Canadian Heritage.
Software Delivery At the Speed of AI: Inflectra Invests In AI-Powered QualityInflectra
In this insightful webinar, Inflectra explores how artificial intelligence (AI) is transforming software development and testing. Discover how AI-powered tools are revolutionizing every stage of the software development lifecycle (SDLC), from design and prototyping to testing, deployment, and monitoring.
Learn about:
• The Future of Testing: How AI is shifting testing towards verification, analysis, and higher-level skills, while reducing repetitive tasks.
• Test Automation: How AI-powered test case generation, optimization, and self-healing tests are making testing more efficient and effective.
• Visual Testing: Explore the emerging capabilities of AI in visual testing and how it's set to revolutionize UI verification.
• Inflectra's AI Solutions: See demonstrations of Inflectra's cutting-edge AI tools like the ChatGPT plugin and Azure Open AI platform, designed to streamline your testing process.
Whether you're a developer, tester, or QA professional, this webinar will give you valuable insights into how AI is shaping the future of software delivery.
Kubernetes & AI - Beauty and the Beast !?! @KCD Istanbul 2024Tobias Schneck
As AI technology is pushing into IT I was wondering myself, as an “infrastructure container kubernetes guy”, how get this fancy AI technology get managed from an infrastructure operational view? Is it possible to apply our lovely cloud native principals as well? What benefit’s both technologies could bring to each other?
Let me take this questions and provide you a short journey through existing deployment models and use cases for AI software. On practical examples, we discuss what cloud/on-premise strategy we may need for applying it to our own infrastructure to get it to work from an enterprise perspective. I want to give an overview about infrastructure requirements and technologies, what could be beneficial or limiting your AI use cases in an enterprise environment. An interactive Demo will give you some insides, what approaches I got already working for real.
Slack (or Teams) Automation for Bonterra Impact Management (fka Social Soluti...Jeffrey Haguewood
Sidekick Solutions uses Bonterra Impact Management (fka Social Solutions Apricot) and automation solutions to integrate data for business workflows.
We believe integration and automation are essential to user experience and the promise of efficient work through technology. Automation is the critical ingredient to realizing that full vision. We develop integration products and services for Bonterra Case Management software to support the deployment of automations for a variety of use cases.
This video focuses on the notifications, alerts, and approval requests using Slack for Bonterra Impact Management. The solutions covered in this webinar can also be deployed for Microsoft Teams.
Interested in deploying notification automations for Bonterra Impact Management? Contact us at sales@sidekicksolutionsllc.com to discuss next steps.
Accelerate your Kubernetes clusters with Varnish CachingThijs Feryn
A presentation about the usage and availability of Varnish on Kubernetes. This talk explores the capabilities of Varnish caching and shows how to use the Varnish Helm chart to deploy it to Kubernetes.
This presentation was delivered at K8SUG Singapore. See https://feryn.eu/presentations/accelerate-your-kubernetes-clusters-with-varnish-caching-k8sug-singapore-28-2024 for more details.
JMeter webinar - integration with InfluxDB and GrafanaRTTS
Watch this recorded webinar about real-time monitoring of application performance. See how to integrate Apache JMeter, the open-source leader in performance testing, with InfluxDB, the open-source time-series database, and Grafana, the open-source analytics and visualization application.
In this webinar, we will review the benefits of leveraging InfluxDB and Grafana when executing load tests and demonstrate how these tools are used to visualize performance metrics.
Length: 30 minutes
Session Overview
-------------------------------------------
During this webinar, we will cover the following topics while demonstrating the integrations of JMeter, InfluxDB and Grafana:
- What out-of-the-box solutions are available for real-time monitoring JMeter tests?
- What are the benefits of integrating InfluxDB and Grafana into the load testing stack?
- Which features are provided by Grafana?
- Demonstration of InfluxDB and Grafana using a practice web application
To view the webinar recording, go to:
https://www.rttsweb.com/jmeter-integration-webinar
JMeter webinar - integration with InfluxDB and Grafana
Connecting the Dots of the User Experience
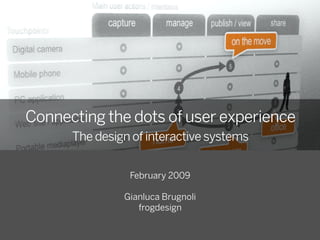
1. Connecting the dots of user experience
The design of interactive systems
February 2009
Gianluca Brugnoli
frogdesign
2. DECONSTRUCTING THE MACHINE: THE SYSTEM PARADIGM
Traditionally interaction design is centered on the
relation of a man with a machine or a service, where
(usually) goals and sphere of action are well defined.
What happen if the “machine” is broken down into a
network made of services and distributed applications?
What happen if interaction is no longer based on
functional and clear goals, but becomes an open and
borderless experience where the main goal is living the
experience itself?
2
3. Experience is a conversation
Many locations
Many situations
Many channels
One conversation
3
4. Experience is
what we can remember
what we learn
Experience is meaning
Source: Stephen P. Anderson
4
5. CONTENT IS GETTING INDEPENDENT FROM THE MEDIA
According to the annual CENSIS* report about media
consumption in Italy in 2005, teenage users don’t mind
about the media used to enjoy contents (music and
information).
Contents are streams they freely catch where possible
with any media available.
Media are getting undi erentiated for the user
experience.
Context and user intentions makes the
di erence.
*CENSIS, from the 1964, is the main Italian social study and research public foundation. http://www.censis.it/
5
14. Photography eco-system map
Web application
Mobile media player
Photo sharing on
the web
Camera phone
Mobile phone
Desktop application Media center
Digital camera
Print
Digital frame
14
15. Photography eco-system map
Web application
Mobile media player
Photo sharing on
the web
share
Camera phone
Mobile phone
capture manage
publish / view
Desktop application Media center
Digital camera
Print
Digital frame
15
16. Photography eco-system map
Web application
Mobile media player
Photo sharing on
the web
public distribution
Camera phone
Mobile phone
private distribution
Desktop application Media center
Digital camera
Print
Digital frame
16
17. Photography eco-system map
Web application
Mobile media player
Photo sharing on
the web
outdoor
Camera phone
Mobile phone
indoor
outdoor
Desktop application Media center
living room
Digital camera
Print
Digital frame
17
18. User scenarios
a: + +
T exports his
om he retouches it and …and transfers the new
photo on is laptop saves a new photo on a digital frame
version… at home.
b: + +
T exports his
om He uploads it on He show o the
photo on is laptop Flickr adding few tags photo to a friend in a
pub using mobile
web
18
19. User scenarios
a: Di
+ configurations
erent
+
T exports his
om
Di erent interfaces transfers the new
he retouches it and
photo on is laptop
saves a new
…and
photo on a digital frame
version… at home.
Di erent contexts
Di erent interactions
Di erent results
b: + +
T exports his
om He uploads it on He show o the
photo on is laptop Flickr adding few tags photo to a friend in a
pub using mobile
web
19
20. Photography Customer Journey
Main user actions / intentions
capture manage publish / view share
Touchpoints
Digital camera
Mobile phone
PC application
Web site / application
Portable mediaplayer
Print media
Home mediacenter / TV
21. Connecting the dots - 1
Main user actions / intentions
capture manage publish / view share
Touchpoints
Digital camera 1
Mobile phone
persona
PC application 2
Web site / application 3 4
Portable mediaplayer
Print media
Home mediacenter / TV
21
22. Connecting the dots - 2
Main user actions / intentions
capture manage publish / view share
Touchpoints
Digital camera
Mobile phone 1
PC application persona
Web site / application 2
Portable mediaplayer
Print media 3
Home mediacenter / TV
22
23. Connecting the dots - 3
Main user actions / intentions
capture manage publish / view share
Touchpoints
Digital camera on the move
Mobile phone 5
PC application 4
Web site / application 3 1 persona
Portable mediaplayer 2
home o ce
Print media
living room
Home mediacenter / TV
23
24. Design considerations
Many entry points are possible
In the system there are many entry points where the user can initiate
the interaction, following context, situation and other needs and goals.
There is no one best way
Interaction and task flow doesn’t always follow one single optimal
process, but is the combination of various partial and occasional actions
accomplished by the user with di erent tools in di erent context.
Design for connections
In the system scenario, design is mainly focused on finding the
connections with the whole network, than in creating closed and self-
su cient systems, tools and services. Connections are social and
cultural assets, other than technical.
24
25. Connecting the dots
1. For a positive and fulfilling user experience, the whole is
more important than the parts.
Moreover, the intelligence of the platform is more
important than the intelligence of the single device,
which could be replaced or completed.
25
26. Connecting the dots
1. For a positive and fulfilling user experience, the whole is more important than the parts.
Moreover, the intelligence of the platform is more important than that of the single
device, which could be replaced or completed.
2. Results are not delivered by a single device.
They are the arrival point of a fragmented and random
interaction flow which goes through many devices and
di erent situations.
26
27. Connecting the dots
1. For a positive and fulfilling user experience, the whole is more important than the parts.
Moreover, the intelligence of the platform is more important than that of the single
device, which could be replaced or completed.
2. Results are not delivered by a single device. They are the arrival point of a fragmented
and random interaction flow which goes through many devices and di erent situations.
3. The architecture of the system becomes a key design
challenge. Before focusing on the capabilities and on the
features of a single device, the design should start from
the organization of the system, and from the possible
relationships and connections between the parts which
can be activated by the user action.
27
28. Connecting the dots
1. For a positive and fulfilling user experience, the whole is more important than the parts.
Moreover, the intelligence of the platform is more important than that of the single
device, which could be replaced or completed.
2. Results are not delivered by a single device. They are the arrival point of a fragmented
and random interaction flow which goes through many devices and di erent situations.
3. The architecture of the system becomes a key design challenge. Before focusing on the
capabilities and on the features of a single device, the design should start from the
organization of the system, and from the possible relationships and connections
between the parts which can be activated by the user action.
4. Device’s features and use follow its role within the system,
which changes continuously in a opportunistic and
situated way following the di erent contexts and user
situations.
28
29. Connecting the dots
1. For a positive and fulfilling user experience, the whole is more important than the parts.
Moreover, the intelligence of the platform is more important than that of the single
device, which could be replaced or completed.
2. Results are not delivered by a single device. They are the arrival point of a fragmented
and random interaction flow which goes through many devices and di erent situations.
3. The architecture of the system becomes a key design challenge. Before focusing on the
capabilities and on the features of a single device, the design should start from the
organization of the system, and from the possible relationships and connections
between the parts which can be activated by the user action.
4. Device’s features and use follow its role within the system, which changes continuously
in a opportunistic and situated way following the di erent contexts and user situations.
5. Tasks and processes depend on the connections and on
the parts combined by the user within the system.
Primary and secondary features switch continuously
following user interaction, also in a occasional and
opportunistic way.
29
30. Connecting the dots
1. For a positive and fulfilling user experience, the whole is more important than the parts.
Moreover, the intelligence of the platform is more important than that of the single
device, which could be replaced or completed.
2. Results are not delivered by a single device. They are the arrival point of a fragmented
and random interaction flow which goes through many devices and di erent situations.
3. The architecture of the system becomes a key design challenge. Before focusing on the
capabilities and on the features of a single device, the design should start from the
organization of the system, and from the possible relationships and connections
between the parts which can be activated by the user action.
4. Device’s features and use follow its role within the system, which changes continuously
in a opportunistic and situated way following the di erent contexts and user situations.
5. Tasks and processes depend on the connections and on the parts combined by the user
within the system. Primary and secondary features switch continuously following user
interaction, also in a occasional and opportunistic way.
6. Users are always in the center: they are the protagonist
which freely and actively connect the dots, selecting and
putting together the di erent pieces of the system.
30